


Depression is the leading cause of disease-related disability among women throughout the world, and the prevalence of depression is highest during the childbearing years(Reference Kessler1). One in seven women will develop depression during pregnancy or after birth(Reference Gaynes, Gavin and Meltzer-Brody2). Antenatal depression increases the risk of adverse outcomes, including preterm birth, pre-eclampsia, fetal growth restriction and altered neonatal and infant behaviour(Reference Yonkers, Wisner and Stewart3–Reference Grote, Bridge and Gavin5). Pregnant depressed mothers are at risk of poor weight gain, substance abuse and failure to obtain adequate prenatal care(Reference Zuckerman, Bauchner and Parker6). Untreated major depression during pregnancy can lead to a worsening of the condition, thereby leading to suicide ideation or suicide attempts(Reference Hirschfeld, Keller and Panico7) and a continuation of depression into the postpartum period(Reference Hirschfeld, Keller and Panico7). Thus, prevention, identification and treatment of perinatal depression are major public health priorities.
Poor maternal nutritional status may be a modifiable risk factor for major depressive disorder (MDD). Nutrients are required for many aspects of brain functioning, including enzymatic activity, cellular and oxidative processes, receptor function, signal transmission, maintenance of neuronal tissue and synthesis and function of neurotransmitters and catecholamines. A wide range of nutrients has been linked with depression in adults(Reference Benton and Cook8–Reference Rucklidge, Gately and Kaplan19), but few investigators have studied nutrition and depression in the context of pregnancy(Reference Bodnar and Wisner20–Reference Otto, de Groot and Hornstra25). Pregnant women are particularly vulnerable to nutritional deficiencies. Requirements for many key nutrients are higher during pregnancy than at any other time in the life cycle(26). These needs are often difficult to meet with a typical Western diet or existing maternal stores. Moreover, standard prenatal vitamins may be inadequate for some nutrients (e.g. vitamin D, essentially fatty acids). Identification of a relationship between maternal nutrition and MDD has the potential to lead to safe, inexpensive and acceptable interventions for prevention and treatment of mood disorders among pregnant women.
Our objectives in the present study were twofold. First, we used exploratory factor analysis to investigate whether there was a meaningful, underlying structure of maternal dietary biomarkers. Factor analysis is a powerful data reduction technique, but this approach has seen limited use in deriving patterns with nutritional biomarkers. Second, we evaluated the association between the dietary biomarker factors and MDD. We studied essential fatty acids, folate, homocysteine (Hcy), vitamins A, C, D and E, carotenoids and iron because these nutrients are of major public health interest and have been previously studied in relation to MDD or have a biologically plausible link to MDD(Reference Benton and Donohoe17, Reference Bodnar and Wisner20, Reference Prasad27). Additionally, each nutrient has a biomarker of intake that is specific and highly predictive of the nutrient and represents integrated exposure over time(Reference Hunter28).
Experimental methods
The Antidepressant Use During Pregnancy (ADUP) Study is a prospective cohort study designed to examine the effects of maternal depression and antidepressant use on maternal and childhood outcomes(Reference Wisner, Sit and Hanusa29). Pregnant women with or without major depression and/or antidepressant use and singleton gestations were invited to enrol at ≤20 weeks’ gestation after providing informed, written consent. Study visits occurred at approximately 20, 30 and 36 weeks’ gestation. At baseline, a non-fasting blood sample was obtained and data on sociodemographic characteristics, health behaviour and medication exposures were collected via interview. At each study visit, maternal depression was assessed by an experienced, trained clinician (details below). At the 30-week visit, usual dietary intake in the past 3 months was assessed with a modified Block98 FFQ. Approval was obtained from the University of Pittsburgh Institutional Review Board.
Women who were interviewed for study eligibility from April 2004 to January 2006 had blood samples processed for nutritional biomarkers. Of the 166 women interviewed during this period, 135 (81 %) provided a non-fasting blood sample at ≤20 weeks that was processed for a full panel of nutritional biomarkers (described below). Of these, 73 % had complete MDD diagnosis data at all three pregnancy study visits, while 16 % and 11 % had depression data available at two or one visit, respectively. Therefore, a total of 354 person-observations were included in the analyses.
At each visit, the diagnosis of major depressive disorder was made according to the Structured Clinical Interview for DSM-IV (Diagnostic and Statistical Manual of Mental Disorders, 4th edition)(Reference First, Spitzer and Gibbon30) by an experienced, trained clinician. We adapted the timeline technique(Reference Post, Roy-Byrne and Uhde31) to chart major depression course by month across pregnancy(Reference Wisner, Peindl and Hanusa32). Depression severity was assessed with the twenty-nine-item Structured Interview Guide for the Hamilton Rating Scale for Depression – Atypical Depression Symptoms Version(Reference Williams and Terman33), which includes all versions of the Hamilton Rating Scale for Depression(Reference Hamilton34).
Fresh maternal blood was collected in red-top and purple-top (EDTA) tubes, which were kept in the dark and submerged in ice. Within 2 h of the blood draw, samples were centrifuged and stored in amber tubes at −80°C until assay.
Fatty acids were extracted from red blood cells according to the general technique of Bligh and Dyer(Reference Bligh and Dyer35, Reference Morrison and Smith36). The CV were 5·5 % for arachidonic acid (AA, 20 : 4n-6), 4·2 % for EPA (20 : 5n-3) and 14·4 % for DHA (22 : 6n-3). Longitudinal control pools were run with each batch of assays. These showed excellent consistency.
Plasma folate was measured by a quantitative sandwich enzyme immunoassay technique on a 2010 Elecsys auto-immunoanalyser (Roche Diagnostics, Indianapolis, IN, USA). The CV was 2·0 % to 3·9 %. The lowest detection limit of this assay is 0·6 ng/ml. Total plasma Hcy was determined by an enzymatic assay on a Hitachi 917 analyser (Roche Diagnostics), using reagents and calibrators from Catch Inc. (Seattle, WA, USA). The CV was 2·1 % to 5·3 %.
Maternal plasma ascorbic acid concentrations were determined by HPLC with metaphosphoric acid-stabilized plasma using previously described methods(Reference Rumelin, Fauth and Halmagyi37). All samples were analysed in duplicate and in a blinded fashion. The intra- and inter-assay CV was 3·5 % and 5·5 %, respectively. The quantification of serum carotenoids, retinol and α-tocopherol was by HPLC using a method based on that described by Browne and Armstrong(Reference Browne and Armstrong38). The inter-assay CV for each lipid-soluble carotenoid/vitamin was 12 % for lutein and zeaxanthin (determined as a single peak), 11 % for β-cryptoxanthin, 9 % for lycopene, 11 % for β-carotene, 8 % for retinol and 6 % for α-tocopherol. α-Tocopherol concentrations were lipid-standardized by dividing by total cholesterol concentrations, which were determined enzymatically using specific reagents from Pointe Scientific (Canton, MI, USA).
Vitamin D status was assessed using 25-hydroxyvitamin D (25(OH)D), which was quantified using a commercial ELISA from Immunodiagnostic Systems Limited (Bolden, UK) and validated against an HPLC method as described previously(Reference Bodnar, Simhan and Powers39). Serum ferritin was analysed using an immunoradiometric assay with 125I-labelled anti-ferritin antibody in a kit obtained from Diagnostic Products Corporation (Los Angeles, CA, USA). The inter-assay CV was 16·4 %. Serum soluble transferrin receptors were measured using an ELISA from R&D Systems (Minneapolis, MN, USA). The inter-assay CV ranged from 8·5 to 17 %. All samples were analysed in duplicate and in a blinded fashion.
A semi-quantitative modified Block98 FFQ was self-administered at the 30-week visit to inquire about usual dietary intake in the past 3 months; the instrument has been validated in many populations, including pregnant women(Reference Block, Thompson and Hartman40, Reference Block, Woods and Potosky41). The Block98 FFQ assesses fifty-one nutrients and seven food groups from approximately 120 food/beverage items and was modified to focus on a 3-month time period(Reference Block, Hartman and Dresser42). Completed questionnaires were sent to Block Dietary Data Systems (Berkeley, CA, USA) for optical scanning and nutrient analysis using software developed at the National Cancer Institute.
Mothers self-reported their race/ethnicity (non-Hispanic white, non-Hispanic black, other), age, parity (0, ≥1), smoking status (smoker, non-smoker), education (less than high school, high school or equivalent, some college), marital status (married, unmarried) and work status (full-time, part-time or none). Pre-pregnancy BMI (weight (kg)/[height (m)]2) was based on maternal recall of pre-pregnancy weight at enrolment and measured height. BMI categories were underweight (BMI < 18·5 kg/m2), normal weight (BMI = 18·5–24·9 kg/m2), overweight (BMI = 25·0–29·9 kg/m2) and obese (BMI ≥ 30·0 kg/m2)(43). Gestational age was determined by maternal report of the date of the last menstrual period and was confirmed with ultrasound when available. Self-reported use of selective serotonin reuptake inhibitors was verified using serum concentrations.
Statistical analysis
Many of the biomarkers exhibited skewed distributions, thus violating the assumption of normality required by factor analytic procedures. We therefore factor analysed a matrix constructed of Spearman's ρ correlation coefficients. Factors were extracted from a principal components analysis and orthogonally rotated with the varimax method. Solutions for two to eight factors were examined. The number of factors extracted was based on examination of eigenvalues, scree plots and the interpretability of the solution. The estimated factor scores were computed using a regression method(Reference Grice44) based on fourteen biomarkers. Serum ferritin was initially included in the analysis, but dropped before the final factors were extracted because it did not load highly on any of the final factors. All factor loadings ≥ |0·3| were presented. Factor scores were then categorized based on tertiles of the distribution.
We used a non-parametric test of trend to determine differences in maternal characteristics and nutritional biomarker concentrations across tertiles of each factor score. Spearman correlation coefficients were calculated between factor scores and measures of dietary intake. We used a χ 2 test to determine if the prevalence of MDD varied by study visit. To test for an association between factor scores at 20 weeks’ gestation and MDD, depression status at each time point during pregnancy was used as the dependent measure in a longitudinal logistic regression model employing generalized estimating equations, which account for intra-individual correlation of depression measurements. Gestational age at the study visit was included in all models. Other potential confounding variables (race/ethnicity, pre-pregnancy BMI, maternal age, education, marital status, work status, parity, antidepressant use and season) were included in the final model if their inclusion resulted in a change in the main-effect odds ratio of ≥10 %(Reference Weng, Hsueh and Messam45). Pre-pregnancy BMI, education and work status met this definition. We tested for interaction between factor scores and study visit using a Wald P value (P < 0·05), but because no interaction was observed, models were not stratified by study visit. Our sample size gave us 80 % power to find a medium effect size (f = 0·31). Analyses were conducted using the SATA statistical software package release 10 (StataCorp LP, College Station, TX, USA).
Results
Most women in the cohort were white, 25–34 years old, college-educated, married, had one or more previous live births and had a pre-pregnancy BMI ≥ 25·0 kg/m2 (Table 1). Mean concentrations of each nutritional biomarker at ≤20 weeks’ gestation included in the factor analysis indicate that this population was well-nourished. We derived three patterns using the biomarker data (Table 2). Factor 1 (Essential Fatty Acids) had high factor loadings on red cell DHA, AA and EPA. Plasma folate, plasma ascorbic acid, serum retinol, serum 25(OH)D, serum α-tocopherol and serum β-carotene loaded positively, and plasma Hcy and serum soluble transferrin receptors loaded negatively on Factor 2 (Micronutrients). Factor 3 (Carotenoids) had high factor loadings for serum carotenoids. Before rotation, these factors explained 46 % of the variance in biomarker concentrations.
Table 1 Characteristics of women in the cohort (n 135), Antidepressant Use During Pregnancy Study, Pittsburgh, Pennsylvania, USA

Table 2 Rotated factor loadings for maternal dietary biomarker concentrations (n 135)Footnote †, Antidepressant Use During Pregnancy Study, Pittsburgh, Pennsylvania, USA

† Factor analysis on fourteen biomarkers. Only factor loadings ≥|0·3| are presented.
Women in the highest tertile of all three biomarker patterns (Essential Fatty Acids, Micronutrients and Carotenoids) were more likely than women in the lower tertiles to be primiparous and lean (Table 3). Well-educated women were more often in the upper tertiles of the Micronutrients and Carotenoids patterns. As Micronutrients factor tertiles increased, a greater proportion of women were white, older and married.
Table 3 Maternal characteristics in the lowest (T1) and highest (T3) tertile of biomarker factor scores (n 135)Footnote †, Antidepressant Use During Pregnancy Study, Pittsburgh, Pennsylvania, USA
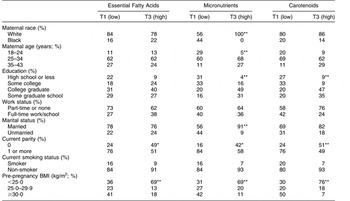
Distribution of characteristics was significantly different across tertiles: *P < 0·05, **P < 0·01.
† Tertile 2 was omitted for simplicity.
In the subset of the sample with dietary data (n 107), Essential Fatty Acids scores had weak, negative correlations with intakes of energy, red meat, poultry, processed meats and fried foods and a weak positive correlation with soya-based food intakes. However, scores were not correlated with fish and seafood intakes (Table 4). Micronutrients factor scores had weak, positive correlations with intakes of fruits, vegetables, whole grains, reduced-fat dairy products, nuts and soya-based foods, and weak negative correlations with intakes of energy, high-fat dairy products, processed meat, fried foods and sugar-sweetened beverages. Intakes of fruits, vegetables, legumes, nuts and soya-based foods had weak positive correlations, and intakes of energy, high-fat dairy products, processed meat, fried foods and sugar-sweetened beverages had weak negative correlations with Carotenoids factor scores.
Table 4 Correlation between factor scores and selected measures of dietary intake (n 107)Footnote †, Antidepressant Use During Pregnancy Study, Pittsburgh, Pennsylvania, USA
Correlation was statistically significant: *P < 0·05, **P < 0·01.
† Values in the table are correlation coefficients.
MDD occurred in 21·5 % of women overall and did not vary by study visit (P = 0·8). The prevalence of MDD was not significantly different across tertiles of any factor scores at ≤20 weeks’ gestation (Table 5). In longitudinal models, there was no association between Essential Fatty Acids scores or Micronutrients scores and MDD either before or after confounder adjustment. Women with Carotenoids factor scores in the middle and upper tertiles were 60 % less likely than women in the bottom tertile to have MDD during pregnancy, but after adjustment for pre-pregnancy BMI, employment and education status, associations were no longer statistically significant. Alternative specifications of the factor scores (e.g. as a continuous variable, spline variables or as different categories) did not change these conclusions.
Table 5 Association between dietary biomarker factor scores at <20 weeks’ gestation and major depressive disorder during pregnancy (n 135 women contributing 352 person-observations), Antidepressant Use During Pregnancy Study, Pittsburgh, Pennsylvania, USA
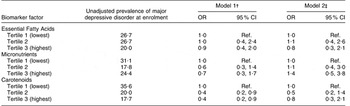
Ref., referent category.
†Adjusted for study visit number.
‡Adjusted for study visit number, employment, education and pre-pregnancy BMI. Additional adjustment for other covariates had no meaningful impact on the findings.
Discussion
In this cohort of pregnant women we used factor analysis to derive three patterns in nutritional biomarkers that we labelled Essential Fatty Acids, Micronutrients and Carotenoids. We used factor analysis rather than other data reduction techniques because we believe that maternal nutritional biomarker concentrations are a manifestation of latent underlying constructs (factors) that may be reflective of meaningful dietary patterns in pregnancy. The study of patterns using dietary intake data is widespread in nutritional epidemiology(Reference Newby and Tucker46–Reference Kant50), and in other fields, biochemical markers of metabolism, inflammation and antioxidant status have commonly been studied using pattern analysis(Reference Dewailly, Pigny and Soudan51–Reference Botelho, Fioratti and Abdalla55). Nevertheless, we are aware of only one other study that identified patterns using nutritional biomarker concentrations. In a sample of 310 lactating women from The Netherlands, Mueller et al.(Reference Mueller, Thijs and Rist56) derived two major patterns of fatty acid concentrations in maternal breast milk samples using principal component analysis: (i) 18:1 trans-isomers; and (ii) markers of dairy fat including 15:0, 17:0, trans 11-18:1 and cis 9, trans 11-18:2. Like foods and nutrients measured from self-reported dietary instruments, nutritional biomarkers can also be highly correlated. Thus, creating dietary patterns using biomarker data seems a reasonable approach to examining dietary intakes, and has the distinct advantage of employing objective measures of intake. Biomarker patterns may also be more meaningful than a single nutritional biomarker since resultant patterns capture synergistic interactions among nutrients.
Our study is unique in that we identified patterns using nutritional biomarkers of a wide range of nutrients that are important during pregnancy. Notably, the three factors we identified using maternal biomarkers represented patterns reflective of expected food intakes while also capturing additional differences in food intakes across patterns. For instance, Micronutrients scores were positively correlated with many foods that contribute to folate, β-carotene and vitamins C, A, E and D (nutrients that loaded highly on this factor), including fruits, vegetables, whole grains, reduced-fat dairy products, nuts and soya products. However, scores were also associated with foods and nutrients not specifically represented in the biomarkers, such as reduced intakes of sugar-sweetened beverages, fried foods and processed meat. Likewise, Carotenoids scores were correlated with fruits and vegetables (the primary sources of carotenoids), but also with intake of other healthy foods. Surprisingly, Essential Fatty Acids scores were not associated with fish and seafood intakes, but were associated with intakes of soya-based foods (positively) and energy, red meat, poultry, processed meats and fried foods (negatively). It is possible that the Block98 FFQ used in the present study may not have adequately captured adequate variation in fish and seafood intakes based on its five line items. Moreover, it is likely that in this well-educated cohort of women interested in participating in a study on depression, fish oil use was more common than in other populations thus leading to this major pattern we observed. Unfortunately, we lacked data on dietary supplement use (such as fish oil) to better understand how dietary supplement use impacted our biomarker patterns.
In our cohort, we found no independent association between Essential Fatty Acids, Micronutrients or Carotenoids scores in mid-pregnancy and the prevalence of MDD at 20, 30 and 36 weeks. It is difficult to compare our results with others because of differences in study design, nutrition assessment methods, definitions of depression, confounders considered and characteristics of the population. Importantly, little work has explored nutrition and depression in the context of pregnancy(Reference Bodnar and Wisner20–Reference Otto, de Groot and Hornstra25), when unique stresses and physiological adaptation to gestation may alter associations with mental health outcomes.
Nutrients that we included in our biomarker patterns have been implicated in MDD(Reference Benton and Donohoe17, Reference Bodnar and Wisner20, Reference Prasad27). Each nutrient we studied has a recognized role in brain functioning, and some degree of research supporting an association with mood(Reference Benton and Donohoe17–Reference Bodnar and Wisner20, Reference Prasad27). Nevertheless, evidence is not conclusive. For instance, n-3 (omega-3) fatty acid supplements may help to improve depressive symptoms, but only among individuals diagnosed with depressive illness(Reference Appleton, Rogers and Ness13). Poor folate status has been related to depression in predominantly cross-sectional and case–control studies(Reference Gilbody, Lightfoot and Sheldon15), but few randomized trials and rigorous prospective studies have explored the causal and temporal natures of this relationship(Reference Walker, Mackinnon and Batterham57). Similarly, research into the role of vitamin D in depression is mixed, with most studies suffering from important methodological limitations(Reference Bertone-Johnson9).
While we observed meaningful dietary patterns in our study using objective data based on nutritional biomarkers, our lack of an association between the patterns and depression at 20, 30 and 36 weeks may be due to several factors. First, given the high socio-economic status of the sample, use of prenatal vitamins and other dietary supplements may have been widespread, and our lack of supplement use data prevents us from quantifying use directly and observing its impact on the association. Likewise, it is possible that with a predominance of well-nourished women, associations between poor nutrition and antenatal MDD could not be observed. Our relatively small sample of mostly well-educated, white women with a high prevalence of depression may not generalize to the majority of pregnant women in the USA. Indeed the depressed women in our sample, who were functional enough to participate in this research study while pregnant, may be less likely to have nutritional deficiencies as a significant contributor to MDD, compared with less functional women. Our results may also have been different if we had included women with other psychiatric illnesses that have a greater impact than depression on appetite and metabolism, such as bipolar disorder and schizophrenia. Exploring these disorders in pregnant women may reveal different relationships between nutritional status, dietary intake and psychiatric symptoms. Finally, we were powered to detect a medium-sized effect. If the effect size between nutritional patterns and depression is small, we could not detect this difference.
Strengths of our study included the longitudinal nature of the data and use of the gold-standard assessment of MDD based on clinical diagnosis. Our use of a full panel of nutritional biomarkers (objective measures of dietary intakes) allowed us to overcome the limitations of self-reported diet. As well, factor analysis has not been often used to characterize dietary patterns using biomarker data, and we observed three interesting patterns using this approach. Further, factor analysis allowed us to account for the correlated nature of dietary biomarkers and provided a novel assessment of maternal nutritional status mid-pregnancy.
In conclusion, dietary patterns using nutritional biomarkers among women in mid-pregnancy were not independently associated with antenatal MDD in the present study. Future studies in diverse cohorts of pregnant women with rigorous measures are needed to clarify the temporality, direction and magnitude of the association between nutrition and depression in pregnancy. Because nutritional status is a modifiable exposure, determining its contribution to depression during pregnancy is of major public health significance.
Acknowledgements
This work was supported by the National Institutes of Health grants K01 MH074092 (Principal Investigator: L.M.B.) and R01 MH060335 (Principal Investigator: K.L.W.). None of the authors had personal or financial conflict of interests. L.M.B, K.L.W. and P.K.N. designed the research; K.L.W. provided the data; R.W.P., R.W.E. and M.J.G. generated biomarker assay data for the study; L.M.B. and J.F.L. analysed data; L.M.B., K.L.W. and P.K.N. wrote the manuscript; J.F.L., R.W.P. and R.W.E. provided significant advice and critically edited the manuscript; all authors read and approved the final manuscript.


