


Heightened depression symptoms are commonly observed in the general population annually and across the lifetime (Jeuring et al., Reference Jeuring, Comijs, Deeg, Stek, Huisman and Beekman2018). Reliable evidence has linked subthreshold depression to many physical ailments involving the cardiometabolic, gastrointestinal, and autoimmune systems (Simpson et al., Reference Simpson, Diaz-Arteche, Eliby, Schwartz, Simmons and Cowan2021). Elevated depression also adversely affects romantic and professional relationships, career development, and other life satisfaction domains (Sivertsen, Bjorklof, Engedal, Selbaek, & Helvik, Reference Sivertsen, Bjorklof, Engedal, Selbaek and Helvik2015). Economically, heightened depression consumes significant annual government expenditure (Revicki et al., Reference Revicki, Travers, Wyrwich, Svedsater, Locklear, Mattera and Montgomery2012). Thus, a better understanding of the risk factors and consequences of elevated depression components is essential.
Our immune and endocrine systems dynamically interact with depressed mood and related symptoms by regulating the sympathetic nervous system, vagus nerve, hypothalamic–pituitary axis (HPA), and associated systems (Peirce & Alvina, Reference Peirce and Alvina2019; Thayer & Fischer, Reference Thayer and Fischer2009). These regulatory systems optimize inflammation levels to fend off infections, injuries, and toxins (Ellins, Rees, Deanfield, Steptoe, & Halcox, Reference Ellins, Rees, Deanfield, Steptoe and Halcox2017). Two types of inflammation exist. Short-term (acute) inflammation is triggered by sugary and fatty substances, viruses, and bacteria that may result from sickness recovery, wound reparation, and brief stress episodes and is, on balance, adaptive (Cecconello, Clària Ribas, & Norling, Reference Cecconello, Clària Ribas and Norling2022). Conversely, long-term (chronic) inflammation can build up plaques, clot the bloodstream, and impair the brain, heart, and other organs (Michels, van Aart, Morisse, Mullee, & Huybrechts, Reference Michels, van Aart, Morisse, Mullee and Huybrechts2021). Likewise, our endocrine system, which comprises glands that secrete and absorb hormones, lipids, and related markers, needs optimal balance to modulate mood states effectively (Chen et al., Reference Chen, Zhang, Dai, Hu, Zhu, Su and Wu2016). Prolonged inflammation and suboptimal lipid marker levels can thus contribute to autoimmune disorders, depressed mood, and associated symptoms by lowering resilience to stress and corresponding processes (Dedoncker, Vanderhasselt, Ottaviani, & Slavich, Reference Dedoncker, Vanderhasselt, Ottaviani and Slavich2021; Suvarna et al., Reference Suvarna, Suvarna, Phillips, Juster, McDermott and Sarnyai2020).
Potential risk factors or consequences of elevated depression components have been theorized to include suboptimal levels of chronic peripheral proinflammatory proteins and lipid markers (e.g. Penninx, Reference Penninx2017). Proxy lipid markers might comprise unique hormones (e.g. insulin, fasting glucose), fats (e.g. triglycerides), and a combination of proteins and fats [e.g. low-density lipoprotein cholesterol (LDL), high-density lipoprotein cholesterol (HDL)] (Marz et al., Reference Marz, Kleber, Scharnagl, Speer, Zewinger, Ritsch and Laufs2017). C-reactive protein (CRP) and fibrinogen are acute-phase proinflammatory proteins the liver secretes in response to increased interleukin-6 (IL-6) and tend to be embedded in plasma and other bodily fluids (Johansson-Persson et al., Reference Johansson-Persson, Ulmius, Cloetens, Karhu, Herzig and Onning2014). CRP, in conjunction with damaged cells or sets of disease-producing microorganisms, primarily serve to activate adjunct systems (Macleod & Avery, Reference Macleod and Avery1941). Fibrinogen is a clotting agent precursor of the enzyme fibrin and is instrumental in platelet aggregation when fixing tissue and vascular injuries but contributes to heart problems in excessive amounts (Duivis et al., Reference Duivis, de Jonge, Penninx, Na, Cohen and Whooley2011). Depression components include somatic symptoms (e.g. appetite changes, sleep disturbances), depressed mood, and interpersonal problems (e.g. perceived unfriendliness) (Cosco, Prina, Stubbs, & Wu, Reference Cosco, Prina, Stubbs and Wu2017). These variables have been incorporated into vulnerability and scar theories of depression.
In particular, vulnerability models propose that suboptimal levels of insulin, fasting glucose, triglycerides, LDL, and HDL might influence future somatic (v. mood and interpersonal) aspects of depression (Lamers et al., Reference Lamers, Milaneschi, Vinkers, Schoevers, Giltay and Penninx2020; Penninx, Reference Penninx2017). Surrogate lipid markers have been theorized to predict future depressed mood and somatic symptoms through reduced neurogenesis, suboptimal cell metabolism function, and heightened inflammation (Dantzer, O'Connor, Freund, Johnson, & Kelley, Reference Dantzer, O'Connor, Freund, Johnson and Kelley2008). These processes could decrease motivation to engage regularly in healthy behaviors and physical activity (Ignacio, da Silva, Plissari, Quevedo, & Reus, Reference Ignacio, da Silva, Plissari, Quevedo and Reus2019), leading to subsequent depressed mood. Proinflammatory proteins that likely predict multiple aspects of depression include CRP and fibrinogen (Konsman, Reference Konsman2019; Lafitte et al., Reference Lafitte, Tastet, Perez, Serise, Grandoulier, Aouizerate and Couffinhal2015). As they deplete dopaminergic neurons and disrupt mitochondrial function (e.g. glucose production) (Dantzer, Casaril, & Vichaya, Reference Dantzer, Casaril, Vichaya, Berk, Leboyer and Sommer2021), increased proinflammatory proteins (v. proxy lipid markers) would likely more strongly impact somatic (v. mood and interpersonal) depression components (Majd, Saunders, & Engeland, Reference Majd, Saunders and Engeland2020). Proinflammatory proteins (v. proxy lipid markers) could to a larger degree, perpetuate ‘sickness behaviors’ (i.e. fatigue, reduced activities) and negatively impact emotion regulation-related brain areas (e.g. dorsal anterior cingulate cortex, ventromedial prefrontal cortex) (Felger et al., Reference Felger, Li, Haroon, Woolwine, Jung, Hu and Miller2016; Torres-Platas, Cruceanu, Chen, Turecki, & Mechawar, Reference Torres-Platas, Cruceanu, Chen, Turecki and Mechawar2014), leading to future-elevated somatic symptoms.
Scar theories posit that somatic symptoms, compared to depressed mood and interpersonal issues, are depression components with the most extensive relations to future increased proinflammatory proteins (Felger et al., Reference Felger, Haroon, Patel, Goldsmith, Wommack, Woolwine and Miller2020; Lamers et al., Reference Lamers, Vogelzangs, Merikangas, de Jonge, Beekman and Penninx2013) v. surrogate lipid markers (Rotella & Mannucci, Reference Rotella and Mannucci2013). These processes could occur via the buildup of stress hormones and chronic dysregulation of the HPA over long periods (Dias et al., Reference Dias, Joseph, Kluwe, Zhao, Shardell, Seeman and Golden2020; Vingeliene, Hiyoshi, Lentjes, Fall, & Montgomery, Reference Vingeliene, Hiyoshi, Lentjes, Fall and Montgomery2019). Suboptimal habits (e.g. decreased exercise, excessive caloric intake, or carbohydrate-dense foods) and social withdrawal patterns (Feng & Astell-Burt, Reference Feng and Astell-Burt2017) could mediate elevated depression components predicting worse immunometabolism. Also, depression components might adversely affect immunometabolism via decreased attempts to tap into social support resources during stress (Gouin, Wrosch, McGrath, & Booij, Reference Gouin, Wrosch, McGrath and Booij2020). Increased social isolation could negatively alter the body's reactivity toward biological or interpersonal stressors (e.g. worsening social cohesion) (Smith, Gavey, NE, Kontari, & Victor, Reference Smith, Gavey, NE, Kontari and Victor2020). These challenges could prompt more robust long-term increased proinflammatory (v. proxy lipid markers) responses, resulting in more somatic symptoms relative to depressed mood and interpersonal issues (Smith et al., Reference Smith, Gavey, NE, Kontari and Victor2020).
Prospective data to date reliably support the theories above. Consistent with vulnerability and scar models, data across 15 studies showed that excessive surrogate lipid markers (e.g. insulin, fasting glucose) bidirectionally predicted future major depression severity and diagnosis in clinical and community samples (cf. meta-analyses and empirical study by Hiles, Revesz, Lamers, Giltay, and Penninx, Reference Hiles, Revesz, Lamers, Giltay and Penninx2016; Pan et al., Reference Pan, Keum, Okereke, Sun, Kivimaki, Rubin and Hu2012). Likewise, concordant with vulnerability models and scar theories, more than 85 studies that recruited diverse youth and adult populations showed that depressive symptoms bidirectionally predicted heightened surrogate lipid markers and non-specific proinflammatory proteins (e.g. IL-6, CRP, fibrinogen) across 2 months to 18 years (cf. reviews and empirical studies by Colasanto, Madigan, and Korczak, Reference Colasanto, Madigan and Korczak2020; Lamers et al., Reference Lamers, Milaneschi, Smit, Schoevers, Wittenberg and Penninx2019; Mac Giollabhui, Ng, Ellman, and Alloy, Reference Mac Giollabhui, Ng, Ellman and Alloy2021; Valkanova, Ebmeier, and Allan, Reference Valkanova, Ebmeier and Allan2013; Zainal and Newman, Reference Zainal and Newman2021c, Reference Zainal and Newman2022). Collectively, suboptimal proinflammatory proteins and surrogate lipid marker levels could be bidirectionally related to somatic symptoms, depressed mood, and interpersonal problems. Moreover, the literature offers more evidence for vulnerability models than for scar theories (e.g. Mac Giollabhui et al., Reference Mac Giollabhui, Ng, Ellman and Alloy2021).
However, most prior longitudinal studies thus far have not tested how components of proinflammatory proteins, surrogate lipid markers, and depression related to one another. Examining these relationships is essential because depression may arise from the interactions among these mutually influencing components, and unique depression components could relate differently in magnitude and direction to distinct surrogate immunometabolism markers (Zhang et al., Reference Zhang, Chen, Xiong, Liu, Xiong, Xie and Qu2022). In addition, the literature is replete with studies on this topic using ordinary least squares (OLS) regression and structural equation modeling (SEM) approaches. Although informative, OLS, SEM, and other traditional statistical approaches tend to yield parameters that enable understanding of the relations among the mean-overall score or latent constructs rather than relations among the components of these constructs. The latent variable modeling approach precludes determining unique immunometabolism trajectories for persons with the same mean-overall score but elevated on different components (e.g. high somatic symptoms and low depressed mood v. low somatic symptoms and high depressed mood). Cross-lagged prospective network analysis (CLPN) (Epskamp, Reference Epskamp2020) is thus a means to understand how components (or nodes) rather than latent constructs relate to one another in a network of mutually influencing nodes across multiple time-points within and between persons. Relations between nodes are called edges, typically expressed as partial correlations that have adjusted for the effects of all other nodes. Moreover, CLPN permits identifying nodes with the biggest impact and the highest number of associations with all future nodes (Borsboom et al., Reference Borsboom, Deserno, Rhemtulla, Epskamp, Fried, McNally and Waldorp2021). These most impactful nodes in temporal networks are key therapy targets, as altering those influential nodes might change future depression nodes (Roefs et al., Reference Roefs, Fried, Kindt, Martijn, Elzinga, Evers and Jansen2022).
To date, only six studies have used network analyses with cross-sectional data to investigate this topic. Recently, Jia et al. (Reference Jia, Yang, Zhuang, Yin, Zhu, Yuan and Hui2020) observed that although higher HDL levels coincided with stronger concurrent depressive symptoms, other lipid markers (e.g. triglycerides, LDL) had null relations. Furthermore, depressive symptoms were nodes with the most robust connections with other nodes in the network (Jia et al., Reference Jia, Yang, Zhuang, Yin, Zhu, Yuan and Hui2020). A separate network analysis showed that higher IL-6 and CRP more strongly coincided with increased somatic symptoms (i.e. aches, pains, sleep issues) v. other depression nodes in Dutch adults with and without elevated depression (Fried et al., Reference Fried, von Stockert, Haslbeck, Lamers, Schoevers and Penninx2020). Another network analysis found that persons with (v. without) heightened CRP had more notable edges in a depression network, with thicker networks indicating more significant psychopathology (Moriarity, van Borkulo, & Alloy, Reference Moriarity, van Borkulo and Alloy2021b). Concentration deficits and psychomotor problems (v. other depression nodes) were the most influential in this study (Moriarity et al., Reference Moriarity, van Borkulo and Alloy2021b). Moreover, higher CRP showed the largest associations with appetite changes and fatigue than other depression nodes in another large community sample (Moriarity, Horn, Kautz, Haslbeck, & Alloy, Reference Moriarity, Horn, Kautz, Haslbeck and Alloy2021a). Likewise, the polygenic risk score of CRP (but not IL-6 and other proinflammatory proteins) was most potently linked to fatigue and decreased anhedonia (Kappelmann et al., Reference Kappelmann, Czamara, Rost, Moser, Schmoll, Trastulla and Arloth2021). In addition, levels of triglyceride, total cholesterol, and insulin resistance, but not HDL, displayed the most substantial concurrent relations with higher depression severity in Korean adults (Nam, Peterson, Seo, Han, & Kang, Reference Nam, Peterson, Seo, Han and Kang2021).
Therefore, the current study used CLPN to better understand the relations among surrogate lipid markers, proinflammatory proteins, and depression nodes across five time-points spanning 9 years. This research aim is essential for multiple reasons. Globally, metabolic syndrome-linked disorders (e.g. diabetes) and depressive disorders have increased (Jeuring et al., Reference Jeuring, Comijs, Deeg, Stek, Huisman and Beekman2018; Leon & Maddox, Reference Leon and Maddox2015). Enhancing knowledge of the modifiable risk factors and outcomes for depression and related immunometabolism problems can facilitate fine-tuning current evidence-based treatments (e.g. physical exercise-focused behavioral therapies; Li et al., Reference Li, Xu, Hu, Tan, Zhang, Li and Chen2017). Also, most studies examining the links among depression components, proinflammatory proteins, and surrogate lipid markers have been cross sectional (e.g. Persons and Fiedorowicz, Reference Persons and Fiedorowicz2016), hindering weak causal inferences (Blanchard, Contreras, Kalkan, & Heeren, Reference Blanchard, Contreras, Kalkan and Heerenin press). Thus, based on theory and evidence, we tested two hypotheses. First, we hypothesized that the within-person temporal (lag-1) network would show evidence more consistent with vulnerability models than scar theories (hypothesis 1). Second, we expected that within and between persons, somatic symptoms (v. depressed mood and interpersonal problems) would have stronger associations with levels of proinflammatory proteins (v. surrogate lipid markers) (hypothesis 2).
Method
Participants
The present study was a secondary analysis of merged open-access datasets from the Study of Women's Health Across the Nation (SWAN) project (Greendale et al., Reference Greendale, Wight, Huang, Avis, Gold, Joffe and Karlamangla2010). At wave 1 (W1), the all-female participants (n = 2224) had a mean age of 45.96 years (s.d. = 2.67, range = 42–53) (refer to Table 1). Table S1(a) in the online Supplementary material details the descriptive statistics of demographic and study variables with the non-imputed dataset. Online Supplementary Table S1(b) offers descriptive statistics on related variables not included in the final analyses.
Table 1. Descriptive statistics of network nodes across all waves for multiply imputed dataset

Note: M, mean; s.d., standard deviation; Min, minimum; Max, maximum.; LDL, low density lipoprotein; HDL, high density lipoprotein; CRP, C-reactive protein; FSH, follicle-stimulating hormone; Pre, pre-menopausal; Peri, peri-menopausal; Post, post-menopausal. All scores have been rescaled to range from 1 to 4.
Procedures
Participants completed a depression self-report and biomarker data collection protocols at W1 (1997–1998), wave 2 (W2; 1998–2000), wave 3 (W3; 2000–2002), wave 4 (W4; 2002–2004), and wave 5 (W5; 2004–2006). These five time-points were selected as they contained data relevant to our research question. Both self-reports and biomarker assays were collected on the same day of the study visit (El Khoudary et al., Reference El Khoudary, Hutchins, Matthews, Brooks, Orchard, Ronsein and Heinecke2016; McClure et al., Reference McClure, El Khoudary, Karvonen-Gutierrez, Ylitalo, Tomey, VoPham and Harlow2014).
Measures
Surrogate lipid markers
Ethylenediaminetetraacetic (EDTA)-treated plasma and enzymatic approaches determined the levels of triglycerides and LDL (Myers, Cooper, Winn, & Smith, Reference Myers, Cooper, Winn and Smith1989). Heparin-2M manganese chloride facilitated the extraction of HDL levels (Warnick & Albers, Reference Warnick and Albers1978). The radioimmunoassay (DPC Coat-a-count, Los Angeles, CA) method assessed serum insulin levels with monthly quality assurance checks (Diabetes Diagnostic Laboratory, University of Missouri, Columbia, MO). Also, the Hitachi 747-200 (Boehringer Mannheim Diagnostics, Indianapolis, Indiana) with the hexokinase-coupled reaction feature enabled the measurement of fasting glucose levels (Kelley-Hedgepeth et al., Reference Kelley-Hedgepeth, Lloyd-Jones, Colvin, Matthews, Johnston and Sowers2008).
Proinflammatory proteins
A clot-based turbidimetric identification system assessed the fibrinogen level in frozen plasma preserved with citric acid (Medical Laboratory Automation Inc., Mt. Vernon, NY) (Falconi, Gold, & Janssen, Reference Falconi, Gold and Janssen2016). The CRP level was determined by using an ultrasensitive rate immunonephelometry approach with a lower identification limit (0.3 mg/L) (BN100; Dade-Behring, Marburg, Germany).
Depression components
Past-week depression components were measured with the Center for Epidemiologic Studies Depression (CES-D) scale (Radloff, Reference Radloff1977). Participants rated items on a 4-point Likert scale (0 = rarely to 3 = most or all of the time). We focused on three theory-based components derived from a recent factor analytic study in community adults: depressed mood; interpersonal problems; and somatic symptoms (Cosco et al., Reference Cosco, Prina, Stubbs and Wu2017).
Statistical analysis
All data analyses were conducted using R version 4.1.0 and RStudio version 1.4.1717 (R Core Team, 2021). Nodes represented components of depression (interpersonal problems, depressed mood, somatic symptoms), proinflammatory proteins and surrogate lipid markers (CRP, fibrinogen, HDL, fasting glucose, insulin, LDL, triglycerides), and covariates [age, estradiol (pg/mL), follicle-stimulating hormone (FSH) (mIU/mL), menopausal status (coded as 1 = premenopausal, 2 = early perimenopausal, 3 = late perimenopausal, 4 = post-menopausal)] (El Khoudary et al., Reference El Khoudary, Hutchins, Matthews, Brooks, Orchard, Ronsein and Heinecke2016; Persons & Fiedorowicz, Reference Persons and Fiedorowicz2016). Table 1 shows the descriptive statistics of each node at distinct time-points with the multiply imputed dataset (cf. online Supplementary Table S1 for descriptive statistics with original dataset). Before network estimation, scores for all nodes were rescaled to range from 1 to 4 (matching the CES-D) to minimize biases due to variability differences (Fried et al., Reference Fried, Eidhof, Palic, Costantini, Huisman-van Dijk, Bockting and Karstoft2018). No outliers were identified (i.e. all skewness and kurtosis values were within normal limits).
Next, we used the panel data-graphical vector autoregressive (panelgvar) model (Epskamp, Reference Epskamp2020) to determine three networks: (a) within-person temporal (lag-1) network (directed partial associations for the mean within-person effects across time); (b) within-person contemporaneous network (partial associations for the mean within-person effects within a time-point over and above temporal effects); and (c) between-person network (partial associations for stable trait-level differences across time). We fit a non-regularized (unpruned) panelgvar model (Speyer et al., Reference Speyer, Ushakova, Hall, Luciano, Auyeung and Murray2022). Model fit was evaluated with these fit statistics: confirmatory fit index (CFI; CFI ⩾ 0.90), Tucker–Lewis index (TLI; TLI ⩾ 0.90), and root mean square error of approximation (RMSEA; RMSEA ⩽ 0.060) (Hu & Bentler, Reference Hu and Bentler1999).
As our sample size was large (n = 2224), we used an unpruned or non-regularized (v. regularized) Gaussian graphical model to interpret network structures because it raises the chances of selecting the true model (Isvoranu & Epskamp, Reference Isvoranu and Epskampin press). Non-regularized networks were fit using the qgraph (Epskamp, Borsboom, & Fried, Reference Epskamp, Borsboom and Fried2018; Epskamp, Cramer, Waldorp, Schmittmann, & Borsboom, Reference Epskamp, Cramer, Waldorp, Schmittmann and Borsboom2012) and psychonetrics (Epskamp, Reference Epskamp2020) R packages. We uploaded analytic data syntax to OSF (https://osf.io/upkyr/). The non-regularized graphical least absolute shrinkage and selection operator (graphical LASSO) was used to estimate the structure of 100 regularized network models from sparse to dense (Epskamp, Kruis, & Marsman, Reference Epskamp, Kruis and Marsman2017; Moriarity et al., Reference Moriarity, Horn, Kautz, Haslbeck and Alloy2021a; Williams & Rast, Reference Williams and Rast2020).
To determine the accuracy of network edges, we computed the 95% confidence intervals (CIs) of the edge weights with 1000 bootstrap samples (Costenbader & Valente, Reference Costenbader and Valente2003). Furthermore, only statistically significant edges (p < 0.001) and edges included ⩾50% of the time across 1000 bootstrap samples were regarded as stable (Betz et al., Reference Betz, Penzel, Kambeitz-Ilankovic, Rosen, Chisholm and Stainton2020; Epskamp, Reference Epskamp2020). Cohen's d effect sizes were calculated to ease interpretation (Dunlap, Cortina, Vaslow, & Burke, Reference Dunlap, Cortina, Vaslow and Burke1996; Rosenthal, Reference Rosenthal, Cooper and Hedges1994). Based on the literature (Mac Giollabhui et al., Reference Mac Giollabhui, Ng, Ellman and Alloy2021), d ⩾ 0.100 was interpreted as meaningful. We rendered edges that were accurate, stable, and with d ⩾ 0.100 as significant. In addition, the Fruchterman–Reingold algorithm was used to organize the networks by locating the largest associations in the center and weaker associations toward the boundary and placing nodes with stronger relations closer to each other (Fruchterman & Reingold, Reference Fruchterman and Reingold1991). Line thickness indicates the strength of association. Although bold blue lines signal positive relations, red dotted lines reflect negative ones. To test H1 formally, we used robust variance estimation (RVE) (Tanner-Smith, Tipton, & Polanin, Reference Tanner-Smith, Tipton and Polanin2016) to determine if substantial effect sizes consistent with vulnerability (v. scar) theories were statistically significantly different. To evaluate H2, we utilized RVE to test the existence of significant effect size differences between substantial edges that included somatic symptoms, proinflammatory proteins, and their interaction.Footnote *Footnote 1
Results
CLPN model fit evaluation
The non-regularized CLPN model had good fit (CFI = 1.00, TLI = 0.95, RMSEA = 0.000, 90% [CI] [0.000–0.000]).
Accuracy and stability of networks
Online Supplementary Figs S2(a)–S2(c) present the 95% CI plot that indicates the accuracy of all edges for the within-person temporal network, within-person contemporaneous network, and between-person network, respectively. The percentages of 95% CI for edges that did not cross the 0 value were 95.8% (182/190) for the temporal network, 98.9% (90/91) for the contemporaneous network, and 96.7% (88/91) for the between-person network. Online Supplementary Tables S2(a)–S2(c) show the partial correlation statistics of each network, and online Supplementary Tables S3(a)–S3(c) show the frequency that each edge was included across all 1000 bootstrap samples. The frequency of edges included in ⩾50% of all bootstrap samples was 129 out of 196 edges (65.8%) for the temporal network, 54 out of 91 edges (59.3%) for the contemporaneous network, and 60 out of 91 edges (65.9%) for the between-person network. Thus, all networks showed a good degree of accuracy and stability.
Within-person temporal (lag-1) network
Table 2 shows the parameter estimates for the within-person temporal (lag-1) network edges across distinct depression and surrogate immunometabolism constructs. Figure 1 displays all estimated fixed-effect within-person network standardized partial correlations. Online Supplementary Table S4 displays parameter estimates of all lag-1 directed network edges within and across constructs.
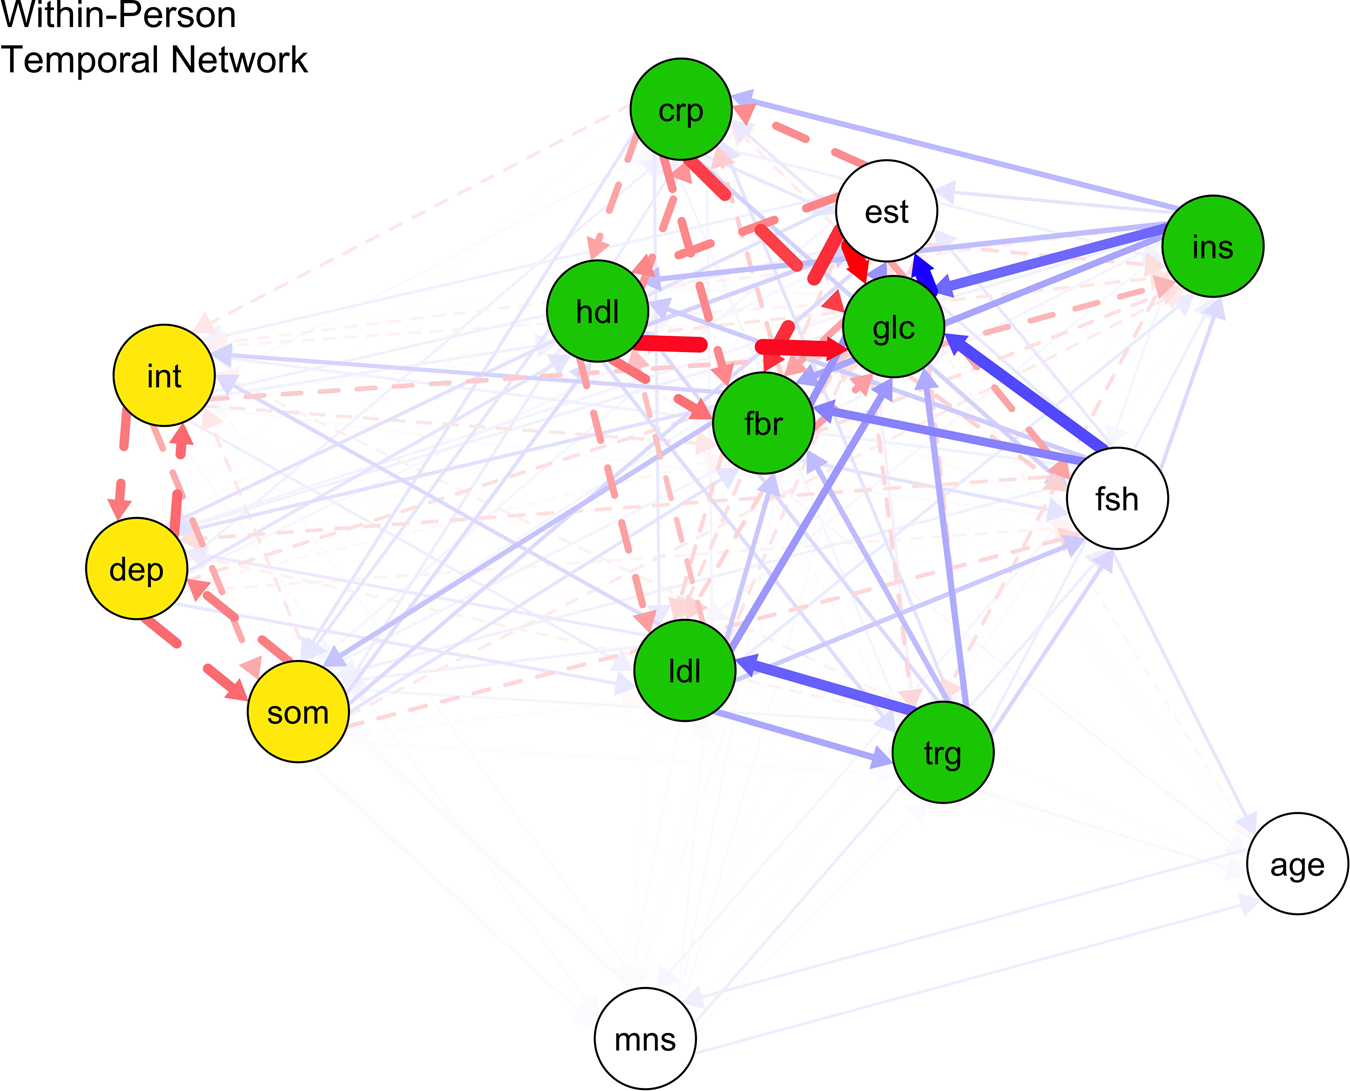
Fig. 1. Within-person temporal network of proinflammatory proteins, lipid markers, and depression nodes.
Note: crp, C-reactive protein; dep, depressed mood; fbr, fibrinogen; glc, fasting glucose; hdl, high density lipoprotein; ins, insulin; int, interpersonal problems; lip, lipid marker composite; ldl, low density lipoprotein; som, somatic symptoms; trg, triglycerides. Blue bold lines indicate statistically significant positive relations, whereas red dotted lines signal statistically significant negative relations and line boldness and thickness reflect strength of associations.
Table 2. Cross-construct cross-lagged directed edges of within-person temporal (lag-1) network

Note: crp, C-reactive protein; dep, depressed mood; fbr, fibrinogen; glc, fasting glucose; hdl, high density lipoprotein; ins, insulin; int, interpersonal problems; lip, lipid marker composite; ldl, low density lipoprotein; som, somatic symptoms; trg, triglycerides. Bold values reflect statistically significant cross-construct edges (i.e., p < 0.001, edges were included ⩾50% of the time across 1000 bootstrap samples and d ⩾ 0.100).
Scar theories
Within persons, depressed mood did not stably predict other immunometabolism markers at the next time-point. However, within-person increased somatic symptoms significantly predicted future increased fibrinogen (d = 0.188) (p < 0.001) rather than other lipid markers and proinflammatory proteins. Also, heightened interpersonal problems significantly predicted future higher fibrinogen (d = 0.129) and LDL (d = 0.331) (all ps < 0.001) instead of other lipid markers and proinflammatory proteins.
Vulnerability models
These two surrogate immunometabolism markers significantly predicted all future depression nodes: (a) CRP (higher CRP → greater depressed mood: d = 1.072; higher CRP → greater somatic symptoms: d = 1.812; higher CRP → greater interpersonal problems: d = 2.112) (all ps < 0.001); and (b) HDL (higher HDL → stronger depressed mood: d = 0.196; higher HDL → stronger somatic symptoms: d = 0.162; higher HDL → stronger interpersonal problems: d = 0.134) (all ps < 0.001). Also, higher depressed mood was significantly predicted by previous higher LDL levels (d = 0.251, p < 0.001) instead of fibrinogen, glucose, insulin, and triglycerides. Greater somatic symptoms were significantly predicted by prior higher levels of fibrinogen (d = 0.156) and triglycerides (d = 0.174) (all ps < 0.001), but not fasting glucose, insulin, and LDL. More interpersonal problems were significantly predicted by prior higher LDL (d = 0.436, p < 0.001), but not fibrinogen, insulin, fasting glucose, and triglycerides.
The effect sizes from scar and vulnerability models did not significantly differ from one another (β = 0.081, 95% CI −0.207 to 0.368). Thus, the findings did not support H1.
Within-person contemporaneous network
Figure 2 and online Supplementary Table S5 show all contemporaneous network edges parameter estimates and statistics after adjusting for within-person temporal relations and between-person differences. Within persons, greater depressed mood was significantly related to higher fasting glucose (d = 0.298, p < 0.001), but not CRP, fibrinogen, insulin, triglycerides, HDL, and LDL. Also, greater somatic symptoms were significantly associated with higher fasting glucose (d = 3.586, p < 0.001), but not fibrinogen, CRP, insulin, triglycerides, LDL, and HDL. Additionally, within-person greater interpersonal problems were significantly correlated with higher fibrinogen (d = 1.029), fasting glucose (d = 1.055), and HDL (d = 0.181) (all ps < 0.001), but not CRP, insulin, triglycerides, and LDL levels.

Fig. 2. Within-person contemporaneous network of proinflammatory proteins, lipid markers, and depression nodes.
Note: crp, C-reactive protein; dep, depressed mood; fbr, fibrinogen; glc, fasting glucose; hdl, high density lipoprotein; ins, insulin; int, interpersonal problems; lip, lipid marker composite; ldl, low density lipoprotein; som, somatic symptoms; trg, triglycerides. Blue bold lines indicate statistically significant positive relations, whereas red dotted lines signal statistically significant negative relations and line boldness and thickness reflect strength of associations.
Between-person network
Figure 3 and online Supplementary Table S6 show that between persons, stronger depressed mood was significantly related to higher CRP (d = 0.205) and fasting glucose (d = 0.138) (all ps < 0.001), but not fibrinogen, triglycerides, insulin, LDL, and HDL levels. Between persons, stronger somatic symptoms were significantly associated with higher CRP (d = 0.240), fasting glucose (d = 0.447), insulin (d = 0.231) (all ps < 0.001), but not fibrinogen, triglycerides, HDL, and LDL. Also, interpersonal problems were not stably related to any immunometabolism markers between persons. Inconsistent with H2, the strength of associations did not differ between significant edges with somatic symptoms (v. depressed mood and interpersonal problems) (β = −0.003, 95% CI −0.130 to 0.125), proinflammatory proteins (v. proxy lipids) (β = 0.0144, 95% CI −0.128 to 0.157), and their interaction (β = 0.007, 95% CI −0.261 to 0.274).

Fig. 3. Between-person network of proinflammatory proteins, lipid markers, and depression nodes.
Note: crp, C-reactive protein; dep, depressed mood; fbr, fibrinogen; glc, fasting glucose; hdl, high density lipoprotein; ins, insulin; int, interpersonal problems; lip, lipid marker composite; ldl, low density lipoprotein; som, somatic symptoms; trg, triglycerides. Blue bold lines indicate statistically significant positive relations, whereas red dotted lines signal statistically significant negative relations and line boldness and thickness reflect strength of associations.
Discussion
Contrary to our hypotheses, findings provided consistent evidence for vulnerability models and scar theories, with small-to-large effect sizes. Furthermore, somatic symptoms, depressed mood, and interpersonal problems had similarly strong positive relations with proinflammatory proteins and proxy lipid markers. We offer potential theoretical accounts on this topic based on outcomes produced by the current study's largely data-driven, cutting-edge CLPN. The within-person temporal network, rather than within-person contemporaneous and between-person networks, takes precedence when interpreting results because it provides directionality information.
Some notable temporal network relations emerged between components of depression and proinflammatory proteins. First, replicating and extending a recent meta-analysis with similar findings (Mac Giollabhui et al., Reference Mac Giollabhui, Ng, Ellman and Alloy2021), higher CRP unidirectionally predicted later increased depressed mood, somatic symptoms, and interpersonal problems, but not vice versa. We observed large effect sizes of CRP (v. other proxy immunometabolism markers) predicting depression components in the within-person temporal networks (d = 1.072–2.112). The unique biological properties of CRP (e.g. cardiovascular risk-enhancing attributes, increased fat storage) might contribute to those large effects, as evidenced by Mendelian randomization genetic (e.g. Khandaker et al., Reference Khandaker, Zuber, Rees, Carvalho, Mason, Foley and Burgess2020) and related studies (Castanon, Lasselin, & Capuron, Reference Castanon, Lasselin and Capuron2014) with hundreds of thousands of participants. Prognostically, suboptimal CRP and associated markers (e.g. fibrinogen, HDL, triglycerides, LDL levels) are probably proinflammatory proteins and surrogate lipid markers driving the etiology of depression. Thus, it is possible that modifying these proxy immunometabolism markers might efficiently treat depression and improve immunometabolism profiles. Also, within persons, contemporaneous networks revealed large positive cross-sectional effect sizes between somatic symptoms and glucose as well as interpersonal problems and glucose and fibrinogen (d = 1.029–3.589) above and beyond temporal effects. Such outliers suggest that the distinctive depression-associated mechanisms of excessive fibrinogen (e.g. increased arterial plaques and clots) and glucose (e.g. metabolism-altering characteristics) merit attention (Kucukgoncu et al., Reference Kucukgoncu, Kosir, Zhou, Sullivan, Srihari and Tek2019; Von Känel, Bellingrath, & Kudielka, Reference Von Känel, Bellingrath and Kudielka2009).
Another notable observation was that there were larger effect sizes at the within- (v. between-) person level (i.e. average significant d = 0.731 v. 0.252). Such findings suggest that biological psychiatry can profit from conducting more studies with within-subject designs that capture person-specific fluctuations since effect size magnitudes can vary at the individual difference and within-person levels (Renna et al., Reference Renna, Shrout, Madison, Alfano, Povoski, Lipari and Kiecolt-Glaser2020). Although longitudinal between-person analyses allow an inference that immunometabolism at a time-point predicts later depression across a sample, such group-level patterns might not extend to individuals across time (Wright & Woods, Reference Wright and Woods2020).
Additionally, fibrinogen had a positive and small reciprocal effect on somatic symptoms over time. Such a result extends evidence for fibrinogen levels positively predicting depression indices (e.g. major depressive disorder) (Zainal & Newman, Reference Zainal and Newman2021b). Our findings support the idea that inflammatory processes are more pronounced in atypical (v. melancholic/mood-focused) depression characterized by bodily symptoms (Penninx, Reference Penninx2017). They also buttress the ‘sickness behavior’ hypothesis that somatic symptoms (e.g. psychomotor slowing, restless sleep) substantially predict increased proinflammatory proteins (Iob, Kirschbaum, & Steptoe, Reference Iob, Kirschbaum and Steptoe2020).
Overall, our results highlight the importance of clarifying unique depression components that specific proinflammatory proteins positively impact. Plausibly, increased CRP and fibrinogen predicted heightened depression components, particularly somatic symptoms, by producing more proinflammatory cytokines from peripheral blood mononuclear cells (e.g. IL-6, tumor necrosis factor-α) (Haroon, Raison, & Miller, Reference Haroon, Raison and Miller2012). Proinflammatory cytokines might trigger and increase the enzyme indoleamine-2,3-dioxygenase, which depletes monoamine precursors (i.e. antecedents of serotonin and dopamine such as tryptophan) by breaking it down into kynurenine (Felger, Reference Felger2018). Eventually, reduced serotonin, dopamine, and norepinephrine synthesis and modified apoptosis and oxidative stress (Lamers et al., Reference Lamers, Milaneschi, Vinkers, Schoevers, Giltay and Penninx2020) could contribute to elevated depression. Future basic science research should evaluate these notions.
Notably, temporal networks showed that excessive HDL predicted all depression components measured herein but not conversely. Furthermore, temporal networks revealed positive feedback loops between LDL and depressed mood and LDL and interpersonal problems, but not LDL and somatic symptoms. Also, elevated triglycerides preceded more somatic symptoms (v. other depression nodes) than vice versa, suggesting that this is an event that could occur in both community-dwelling adult women and men (Xu et al., Reference Xu, Wang, Wang, Liu, Lv and Song2021). Such observations agree that reducing hypertriglyceridemia is essential to treat and prevent the onset or recurrence of physical aspects of depression (Hamer, Batty, & Kivimaki, Reference Hamer, Batty and Kivimaki2012). The state-of-the-art network analysis thus offers much information on the direction, magnitude, and possible reciprocal influence(s) among components of depression and surrogate lipid markers. Our results expand on cross-sectional meta-analytic evidence that HDL positively correlated with depression only among women (Shin, Suls, & Martin, Reference Shin, Suls and Martin2008) and network analytic evidence that heightened HDL (v. LDL and total cholesterol) coincided with more depressed mood (Jia et al., Reference Jia, Yang, Zhuang, Yin, Zhu, Yuan and Hui2020). They also add to accruing evidence for the role of proxy markers of metabolic syndrome and poor glycemic control serving as risk factors for elevated depression in community adults (Mezuk, Eaton, Albrecht, & Golden, Reference Mezuk, Eaton, Albrecht and Golden2008; Watson et al., Reference Watson, Simard, Henderson, Nutkiewicz, Lamers, Nasca and Penninx2021).
Suboptimal levels of unique lipid markers heightened the risk of experiencing more distinct aspects of depression later, likely by dysregulating the HPA via excessive or blunted (v. optimal) cortisol production (Mansur, Brietzke, & McIntyre, Reference Mansur, Brietzke and McIntyre2015). Other tenable mechanisms include decreased neurogenesis in reward- and executive functioning-related brain regions and connectivity between physiological states and synaptic plasticity (Goldsmith et al., Reference Goldsmith, Bekhbat, Le, Chen, Woolwine, Li and Felger2020; Hamer et al., Reference Hamer, Testani, Mansur, Lee, Subramaniapillai and McIntyre2019; Zainal & Newman, Reference Zainal and Newmanin press). Plausibly, these processes can unfold with and without chronic social stressors and relate to somatic aspects (e.g. appetite changes, fatigue) of depression that often co-occur with motivational deficits and social withdrawal (Coccurello, Reference Coccurello2019). Future prospective network analyses should examine these ideas.
Partially consistent with scar theories, somatic symptoms and interpersonal issues, but not depressed mood, preceded higher fibrinogen levels. More interpersonal problems, but not depressed mood and somatic symptoms, also forecasted increased LDL. Results extend evidence that more daily positive interpersonal events dovetailed with future reduced CRP and fibrinogen among women but not men (Sin, Graham-Engeland, & Almeida, Reference Sin, Graham-Engeland and Almeida2015). They also build on evidence that rises in HDL or LDL levels (indicators of the buildup of fatty plaques in heart arteries) predicted depression in community adult women instead of men (Beydoun et al., Reference Beydoun, Beydoun, Dore, Fanelli-Kuczmarski, Evans and Zonderman2015) and more cardiovascular events and rapid cognitive decline (Hua, Ma, Li, Zhong, & Xie, Reference Hua, Ma, Li, Zhong and Xie2021). Most importantly, findings suggest improving lifestyle patterns to lessen depression and prevent dyslipidemia and heightened inflammation.
Study limitations merit attention. First, the all-female sample precluded the generalization of findings to the general population. Future studies should examine how sex assigned at birth might influence our CLPN-derived results due to documented sex differences in proinflammatory proteins, lipid markers, problem- v. emotion-focused coping approaches, and their interactions (Shimanoe et al., Reference Shimanoe, Hara, Nishida, Nanri, Otsuka, Horita and Tanaka2018). For example, sex could moderate within-person CRP-depression associations (Das, Reference Das2020) and relate to the hypothalamic–pituitary–gonadal axis, corticotropic-releasing hormone, cell death programming, and mitochondrial differences (Dantzer et al., Reference Dantzer, Casaril, Vichaya, Berk, Leboyer and Sommer2021). Although women usually consume fatty acids in most cell metabolism processes, men mainly use amino acids and proteins (Demarest & McCarthy, Reference Demarest and McCarthy2015). For these and related biopsychosocial reasons, heightened depression occurs in more women than men (Shimamoto & Rappeneau, Reference Shimamoto and Rappeneau2017), necessitating the recruitment of both genders in future studies. Second, as the current study was a secondary analysis, we were limited to available data. Other related chronic low-grade systemic proinflammatory proteins (e.g. IL-6), endocrine markers, and psychopathology components might have contributed to the current pattern of results. For example, IL-6 is instrumental in CRP and fibrinogen production, and inhibiting IL-6 with monoclonal antibodies affects lipid markers (Raison, Knight, & Pariante, Reference Raison, Knight and Pariante2018). Also, although controlling for age did not affect the results in this middle-aged sample, network associations might be more potent in middle-aged compared to younger adult women (Walker et al., Reference Walker, Slavish, Dolan, Dietch, Wardle-Pinkston, Messman and Taylor2021). Nonetheless, study strengths include the large sample size and the cutting-edge CLPN that separated within- and between-person relations and offered more information than traditional statistics. Moreover, our analyses adjusted for age, estradiol, FSH, and menopausal status.
Cognitive-behavioral therapies (CBTs) that raise the consumption of foods with high soluble dietary fiber (e.g. oat bran, rye bran), reduce intake of sugary or low-fiber foods, and promote regular physical activity may facilitate those aims (Johansson-Persson et al., Reference Johansson-Persson, Ulmius, Cloetens, Karhu, Herzig and Onning2014; Li et al., Reference Li, Xu, Hu, Tan, Zhang, Li and Chen2017). Also, clinical science can profit from testing the efficacy of encouraging the consumption of a Mediterranean diet (e.g. olive oil, fish, fruits, vegetable) (Abenavoli et al., Reference Abenavoli, Di Renzo, Boccuto, Alwardat, Gratteri and De Lorenzo2018) and improving sleep using evidence-based CBT strategies (Irwin et al., Reference Irwin, Olmstead, Carrillo, Sadeghi, Breen, Witarama and Nicassio2014). Furthermore, findings highlight how optimizing immunometabolism profiles require enhancing social support (e.g. reducing loneliness), social engagement, and related contextual variables (cf. interpersonal theories; Walker, Ploubidis, and Fancourt, Reference Walker, Ploubidis and Fancourt2019; Wiebe, Helgeson, and Berg, Reference Wiebe, Helgeson and Berg2016). Mounting evidence indicates that these CBT approaches could alleviate depression and enhance immunometabolism profiles long-term (Shomaker et al., Reference Shomaker, Kelly, Radin, Cassidy, Shank, Brady and Yanovski2017), which merit more attention.
Supplementary material
The supplementary material for this article can be found at https://doi.org/10.1017/S003329172200232X.


 Open access