


Introduction
Social anxiety disorder (SAD) is characterized by disproportionate fear, anxiety and avoidance behaviour in social/performance situations (Stein & Stein, Reference Stein and Stein2008), resulting in various emotional, cognitive and behavioural disabilities (Ruscio et al., Reference Ruscio, Brown, Chiu, Sareen, Stein and Kessler2008). Lifetime prevalence is 7–12% (Stein & Stein, Reference Stein and Stein2008), often with comorbid psychopathology such as other anxiety disorders, major depressive disorder and substance abuse (Meier et al., Reference Meier, Petersen, Mattheisen, Mors, Mortensen and Laursen2015). SAD is typically chronic, and therapeutic options are limited (Penninx, Pine, Holmes, & Reif, Reference Penninx, Pine, Holmes and Reif2021). This has prompted research into its neurobiological underpinnings, where the non-invasive methods of magnetic resonance imaging (MRI), especially functional MRI (fMRI), are particularly useful (Bas-Hoogendam et al., Reference Bas-Hoogendam, Groenewold, Aghajani, Freitag, Harrewijn, Hilbert and Group2022; Zugman et al., Reference Zugman, Harrewijn, Cardinale, Zwiebel, Freitag, Werwath and Winkler2022). This approach has demonstrated hyper-activation of the fronto-limbic circuitry (‘fear circuitry’) of prefrontal cortex (PFC), anterior cingulate cortex (ACC), insula and amygdala (Etkin & Wager, Reference Etkin and Wager2007), and more recently hyper-activation also of medial parietal and occipital regions (posterior cingulate, precuneus and cuneus) and hypoconnectivity of parietal, limbic and executive network regions (Bruhl, Delsignore, Komossa, & Weidt, Reference Bruhl, Delsignore, Komossa and Weidt2014). This work supports a model in which dysfunctional bottom-up response and top-down regulation underlie the emotional hyper-arousal and impaired cognitive processing characteristic of SAD (Bas-Hoogendam & Westenberg, Reference Bas-Hoogendam and Westenberg2020; Bruhl et al., Reference Bruhl, Delsignore, Komossa and Weidt2014; Etkin, Reference Etkin2012; Gentili et al., Reference Gentili, Cristea, Angstadt, Klumpp, Tozzi, Phan and Pietrini2016).
Nevertheless, most of this evidence has come from task-fMRI, while it remains to be elucidated whether a similar pattern of functional alterations occurs in resting-state brain physiology as probed by resting-state fMRI (rs-fMRI), which offers a distinct perspective on the intrinsic neurobiology of SAD free from potential confounding effects of task performance (Smitha et al., Reference Smitha, Akhil Raja, Arun, Rajesh, Thomas, Kapilamoorthy and Kesavadas2017; Zhang et al., Reference Zhang, Cheng, Yang, Suo, Pan, Chen and Gong2022a). In a recent systematic review of rs-fMRI studies of SAD (Mizzi, Pedersen, Lorenzetti, Heinrichs, & Labuschagne, Reference Mizzi, Pedersen, Lorenzetti, Heinrichs and Labuschagne2022), the most consistent findings were aberrant activity in frontal regions and abnormal connectivity between frontal lobe and amygdala/parietal regions, suggesting that the classic model (Bruhl et al., Reference Bruhl, Delsignore, Komossa and Weidt2014; Etkin & Wager, Reference Etkin and Wager2007) based on task-fMRI does not completely explain the resting-state neurobiology of SAD, and highlighting the need for more rs-fMRI studies with larger, homogenous samples and consistent analytic approaches (Mizzi et al., Reference Mizzi, Pedersen, Lorenzetti, Heinrichs and Labuschagne2022).
Besides, it is increasingly recognized that the brain works as a system of interacting information-sharing networks (Damoiseaux et al., Reference Damoiseaux, Rombouts, Barkhof, Scheltens, Stam, Smith and Beckmann2006; Lai et al., Reference Lai, Kong, Zhao, Pan, Zhang, He and Gong2022). Functional connectivity (FC), indexing the temporal coherence of the haemodynamic activity of spatially remote brain areas (Biswal, Yetkin, Haughton, & Hyde, Reference Biswal, Yetkin, Haughton and Hyde1995), is widely used to characterize functional interactions among brain networks (Suo et al., Reference Suo, Zuo, Lan, Pan, Zhang, Kemp and Gong2022; Van Dijk et al., Reference Van Dijk, Hedden, Venkataraman, Evans, Lazar and Buckner2010), with two main technical approaches: seed/region of interest (ROI)-based calculation and independent component analysis (ICA). The first approach is vulnerable to the variability of ROI location, size and shape, as well as inter-subject anatomical variation (He et al., Reference He, Yu, Du, Vergara, Victor, Drevets and Calhoun2016), to which the multivariate data-driven method of ICA, which can identify a battery of maximally spatially-independent but temporally-coherent components (i.e. intrinsic functional networks), is largely immune (Calhoun, Adali, Pearlson, & Pekar, Reference Calhoun, Adali, Pearlson and Pekar2001). Hence, characterizing intra- and inter-network functional network connectivity (FNC) using ICA is a powerful tool to probe macroscale functional integration/dissociation in the normal and abnormal brain (Cai et al., Reference Cai, Wang, Qian, Zhang, Zhang, Zhao and Yu2021; Fox & Raichle, Reference Fox and Raichle2007; Houck et al., Reference Houck, Çetin, Mayer, Bustillo, Stephen, Aine and Calhoun2017; Huang et al., Reference Huang, Wang, Seger, Lu, Deng, Wu and Huang2018). However, to the best of our knowledge, only three studies have used ICA and rs-fMRI in SAD; one investigated the intrinsic FNC as candidate endophenotype in families genetically enriched for SAD, in which most (22/39) subjects were diagnosed with subclinical SAD, and had psychiatric comorbidity (Bas-Hoogendam, van Steenbergen, Cohen Kadosh, Westenberg, & van der Wee, Reference Bas-Hoogendam, van Steenbergen, Cohen Kadosh, Westenberg and van der Wee2021); the other two studies had relatively small sample size (18 and 20 SAD patients) (Geiger et al., Reference Geiger, Domschke, Ipser, Hattingh, Baldwin, Lochner and Stein2016; Liao et al., Reference Liao, Chen, Feng, Mantini, Gentili, Pan and Zhang2010).
In this study, we acquired rs-fMRI data and used ICA to characterize intrinsic intra-/inter-network FNC abnormalities in a relatively large and homogenous sample of adult subjects with SAD (n = 46). We also explored the associations of FNC abnormalities with clinical characteristics. Lastly, we used machine learning to investigate the potential diagnostic efficacy of those FNC signatures. We hypothesized that: (i) SAD patients, compared with healthy controls (HC), would show FNC impairments mainly in default mode network (DMN), frontal parietal network (FPN), salience network (SN) and subcortical network (SCN), previously shown to be abnormal in SAD (Bas-Hoogendam et al., Reference Bas-Hoogendam, van Steenbergen, Cohen Kadosh, Westenberg and van der Wee2021; Geiger et al., Reference Geiger, Domschke, Ipser, Hattingh, Baldwin, Lochner and Stein2016; Liao et al., Reference Liao, Chen, Feng, Mantini, Gentili, Pan and Zhang2010; Mizzi et al., Reference Mizzi, Pedersen, Lorenzetti, Heinrichs and Labuschagne2022; Xu et al., Reference Xu, Van Dam, Feng, Luo, Ai, Gu and Xu2019; Yang et al., Reference Yang, Liu, Meng, Xia, Cui, Wu and He2019); (ii) altered FNC would be related to clinical features (e.g. symptom severity); and (iii) intrinsic FNC markers would have good sensitivity and specificity for SAD diagnosis.
This study is a follow-up analysis of data from a previously-reported cohort (Zhang et al., Reference Zhang, Suo, Yang, Lai, Pan, He and Gong2022b), with different aims and methods. The present study used data-driven methods (ICA) to characterize whole-brain resting-state networks (RSNs) and explore intra-/inter-network FNC abnormalities at the level of large-scale networks; by contrast the previous study aimed to determine whole-brain voxel-wise FC abnormalities based on predefined ROIs which were brain regions with grey matter volume deficits, driven by the hypothesis that brain structural abnormalities may give rise to clinical syndromes via disruption of FC (Gong, Reference Gong2020; Lui, Zhou, Sweeney, & Gong, Reference Lui, Zhou, Sweeney and Gong2016).
Methods
Participants
We recruited 49 right-handed adult SAD patients without any comorbid psychiatric disorders from the Mental Health Center of the West China Hospital at Sichuan University. In accordance with the criteria of Diagnostic and Statistical Manual of Mental Disorders, Fourth Edition (DSM-IV), the diagnosis of SAD was established by two experienced clinical psychiatrists through the Structured Clinical Interview for DSM Disorders (SCID). According to the power analysis using G Power software (Faul, Erdfelder, Lang, & Buchner, Reference Faul, Erdfelder, Lang and Buchner2007), a medium-sized effect with adequate statistical power (Cohen's d = 0.5, α = 0.05, 1–β = 0.8) using an independent-sample t test required at least 102 subjects. Considering this, we recruited 53 demographically-matched (i.e. sex, age and handedness) HC from the local community for comparison analysis, using the SCID-Non-Patient Version to confirm the lifetime absence of psychiatric and neurological diseases. The exclusion criteria for all participants were: (1) comorbidity with other axis I psychiatric disorders, axis II antisocial or borderline personality disorders (verified by SCID); (2) currently receiving psychopharmacological/psychological therapy; (3) history of substance dependence or abuse; (4) learning or developmental disorders; (5) history of head injury; (6) current major neurological or physical diseases; (7) family history of mental disorders; and (8) current pregnancy, claustrophobia or other contraindications to MRI examination. Individuals were also excluded if they were aged under 18 or over 60 years, to minimize age-related effects. Notably, several other analyses of MRI data from these participants have been reported: resting-state functional network-based statistic and graph-theory analyses (Yang et al., Reference Yang, Liu, Meng, Xia, Cui, Wu and He2019), analyses of cortical thickness and surface area (Zhang et al., Reference Zhang, Luo, Wang, Qiu, Pan, Kuang and Gong2020) and grey matter volume and seed-based FC analyses (Zhang et al., Reference Zhang, Suo, Yang, Lai, Pan, He and Gong2022b), with the results reported in the cited papers.
Illness duration was defined as the period between the first reported/observed alterations in psychological/behaviour state to the development of disease when the patients participated in the study (Singh et al., Reference Singh, Cooper, Fisher, Tarrant, Lloyd, Banjo and Jones2005), information being provided by patients, family members and medical records. Social anxiety was evaluated with the self-reported Liebowitz Social Anxiety Scale (LSAS) (Mennin et al., Reference Mennin, Fresco, Heimberg, Schneier, Davies and Liebowitz2002), the most commonly-used clinical scale in SAD studies; the 24-item LSAS provides scores for fear factor (LSASF) and social avoidance factor (LSASA), their sum being the total score (LSAST). LSAS has shown good validity and reliability in Chinese populations (He & Zhang, Reference He and Zhang2004).
All procedures complied with the ethical standards of the relevant national and institutional committees on human experimentation and with the Helsinki Declaration of 1975, as revised in 2008. This study was approved by the Medical Research Ethics Committee of West China Hospital at Sichuan University. After a full explanation of all procedures, all subjects provided written informed consent to participate.
Image acquisition and pre-processing
Image acquisition
This study used an SAD dataset in which we acquired high-resolution three-dimensional T1-weighted images, rs-fMRI data and diffusion tensor imaging sequentially on a 3.0 T MR scanner (Siemens Trio, Erlangen, Germany) with a 12-channel head coil. Before the scans, the subjects were instructed to lie still, keep their eyes closed and to stay relaxed but awake. Earplugs were used to reduce scanner noise, and foam pads to minimize head motion. High-resolution three-dimensional T1-weighted images were acquired with a spoiled gradient-recalled sequence with the following parameters: repetition time (TR)/echo time (TE) 1900 ms/2.26 ms, flip angle 9°, 176 sagittal slices, slice thickness 1 mm, field of view (FOV) 240 × 240 mm2, data matrix 256 × 256, voxel size 1 × 1 × 1 mm3, in-plane resolution 0.94 × 0.94 mm2. The rs-fMRI data were obtained with a gradient echo-planar imaging sequence: TR/TE 2000 ms/30 ms; flip angle 90°; acquisition matrix 64 × 64; FOV 240 × 240 mm2; thickness 5.0 mm, without gap; voxel size 3.75 × 3.75 × 5 mm3; 205 volumes. Each scan was inspected by an experienced neuroradiologist to rule out visible artefacts and lesions.
Image pre-processing
First, the rs-fMRI data were pre-processed using the Data Processing Assistant for Resting-State fMRI (DPARSF 4.3, http://rfmri.org/DPARSF), which is based on Statistical Parametric Mapping software (SPM12; Welcome Department of Cognitive Neurology, London, UK; http://www.fil.ion.ucl.ac.uk/spm/) (Ashburner & Friston, Reference Ashburner and Friston2005) and the toolbox for Data Processing and Analysis of Brain Imaging (DPABI, http://rfmri.org/DPABI) (Yan, Wang, Zuo, & Zang, Reference Yan, Wang, Zuo and Zang2016). Briefly, this includes (1) removal of the first 10 volumes and slice timing correction; (2) realignment and correction for head motion (three SAD patients and one HC with head motion above 2.5 mm or 2.5° in any direction were excluded), in which we also calculated the frame-wise displacement (FD) to summarize the head motion; (3) spatial normalization to Montreal Neurological Institute space including the new segmentation and Diffeomorphic Anatomical Registration Through Exponentiated Lie algebra (DARTEL) (Ashburner, Reference Ashburner2007); (4) resampling into 3 × 3 × 3 mm3 and spatial smoothing with a 8 mm full-width at half-maximum Gaussian kernel.
Independent component analysis
Spatial group ICA (GICA) was performed to parcellate the rs-fMRI data using GIFT software (http://mialab.mrn.org/software/gift/), and the number of independent components (ICs) was estimated automatically by the software, in which spatial GICA decompose the individual data into spatial ICs with a unique time course profile (Kiviniemi et al., Reference Kiviniemi, Starck, Remes, Long, Nikkinen, Haapea and Tervonen2009). Briefly: (1) Individual rs-fMRI data were decomposed through principal component analysis for dimension reduction into principal components. (2) The infomax algorithm was applied to the reduced data of all participants to concatenate across time and decompose data, the concatenated subject-reduced data being decomposed into 24 ICs: this algorithm was repeated 20 times using ICASSO (http://research.ics.tkk.fi/ica/icasso/) to improve estimation reliability, selecting the most central run for further analyses (Himberg, Hyvärinen, & Esposito, Reference Himberg, Hyvärinen and Esposito2004). (3) A GICA back-reconstruction approach was used to produce subject-specific time courses and spatial ICs maps (Allen, Erhardt, Wei, Eichele, & Calhoun, Reference Allen, Erhardt, Wei, Eichele and Calhoun2012). The ICs were identified as meaningful if they had peak activations in grey matter with low spatial overlap with known vascular, ventricular, motion, susceptibility artefacts and edges, in addition to the domination of low-frequency power (Allen et al., Reference Allen, Damaraju, Plis, Erhardt, Eichele and Calhoun2014). To sort the meaningful ICs into different RSNs, RSNs templates were used as the reference for multiple regression with the ICs using the ‘sort components’ tool of the GIFT toolbox, in which greater regression coefficient indicates more similarity to the RSNs (Liao et al., Reference Liao, Chen, Feng, Mantini, Gentili, Pan and Zhang2010; Wang et al., Reference Wang, Cai, Sun, Si, Zhang, Xu and Zhu2020a). Eventually, 15 out of 24 ICs were characterized as 15 RSNs (Fig. 1), including anterior and posterior default mode network (aDMN and pDMN); left and right frontoparietal network (lFPN and rFPN); dorsal and ventral attention network (DAN and VAN); anterior and posterior salience network (aSN and pSN); SCN; auditory network (AUN); dorsal and ventral sensorimotor network (dSMN and vSMN); medial, lateral and posterior visual network (mVN, lVN and pVN). (4) Finally, before network-wise FC analyses, time courses of identified RSNs underwent additional post-processing procedures including de-trending linear, quadratic and cubic trends; de-spiking detected outliers; and low-pass filtering with a cut-off of 0.15 Hz (Wang et al., Reference Wang, Cai, Sun, Si, Zhang, Xu and Zhu2020a).

Fig. 1. Spatial maps of 15 selected independent components. In parentheses are the peak coordinates (X, Y, Z) of corresponding components. Abbreviations: aDMN, anterior default mode network; aSN, anterior salience network; AUN, auditory network; DAN, dorsal attention network; dSMN, dorsal sensorimotor network; lFPN, left frontoparietal network; lVN, lateral visual network; mVN, medial visual network; pDMN, posterior default mode network; pSN, posterior salience network; pVN, posterior visual network; rFPN, right frontoparietal network; SCN, subcortical network; VAN, ventral attention network; vSMN, ventral sensorimotor network.
Network-wise functional connectivity analyses
Intra-network FNC analyses
Intra-network connectivity, representing the contribution of the time course to each voxel comprising a corresponding component (Wang et al., Reference Wang, Chen, Yu, Yang, Cui, Fan and Li2021), was calculated using the spatial maps. Specifically, all subjects' spatial maps for each RSN were entered into a random-effect one-sample t test. Brain regions were identified within each corresponding RSN when they met a threshold of family-wise error (FWE)-corrected p < 0.001 in combination with a proper extent threshold for multiple comparisons. Then, voxel-wise comparisons of intra-network FNC between SAD patients and HC were performed using independent-sample t test with age, sex and mean FD as covariates of no interest in SPM12. The FWE approach was used to control for multiple comparisons with a significance threshold of voxel-wise p < 0.001 and FWE-corrected p < 0.05 at cluster level (Hayasaka & Nichols, Reference Hayasaka and Nichols2003; Woo, Krishnan, & Wager, Reference Woo, Krishnan and Wager2014).
Inter-network FNC analyses
Inter-network FNC was computed as the correlation coefficient between the time courses of the RSNs, thus constructing a symmetric 15 × 15 inter-network FNC matrix for each individual. The FNC matrices were z-normalized using Fisher's r-to-z transformation to improve the normality of the partial correlation coefficients. Finally, between-group differences of inter-network FNC were compared using independent-sample t test after controlling for age, sex and mean FD. The false discovery rate (FDR) approach was used to correct for multiple comparisons with a significance threshold of p < 0.05 (Benjamini & Yekutieli, Reference Benjamini and Yekutieli2001).
Clinical relevance analyses
To identify the relationships between the intrinsic FNC impairments and clinical features, the intra-/inter-network FNC values with significant between-group differences were extracted respectively, then partial correlation analyses were conducted between the aforementioned FNC values and clinical characteristics (i.e. LSAST, LSASA, LSASF and disease duration) with sex, age and mean FD as covariates in the SAD group, using IBM SPSS Statistics 22.0.
Machine learning analyses
To explore the potential diagnostic value of intrinsic FNC with significant between-group differences, support vector machine (SVM) analyses (Cortes & Vapnik, Reference Cortes and Vapnik1995) were conducted to investigate how well FNC could differentiate SAD v. HC at the individual level. In brief: (1) Each subject's average intra-network FNC of each cluster and inter-network FNC values that showed significant between-group differences were regarded as features for model training. (2) Leave-one-out cross-validation was used to separate training and testing sets. (3) Data normalization was performed on the feature matrix to guarantee that the features were at the same magnitude for subsequent analyses. (4) The SVM optimal hyperparameter (i.e. soft margin parameter C) was selected on the training sets. (5) The SVM classification algorithm with a linear kernel was used to determine the hyperplane maximizing the margin between binary classes in the feature space, and the classification strategy learned from the training sample was used to predict individual classification in testing sets. (6) The classification performance of the model was assessed using sensitivity, specificity and total accuracy based on testing sets. The receiver operating characteristic (ROC) curve was also constructed, in which the area under the ROC curve (AUC) was calculated for quantification. (7) Non-parametric permutation test (5000 times) was applied to estimate statistical significance for the machine learning model. All these procedures were conducted in LIBSVM for support vector classification (Chang & Lin, Reference Chang and Lin2011). More details are available in online Supplementary Materials.
Results
Demographic and clinical characteristics
There were no significant group differences (SAD patients v. HC) in sex composition and age; as expected, SAD patients scored significantly higher on LSAS (Table 1). There were no significant group differences in mean FD [t = 0.519, p = 0.605].
Table 1. Demographics and clinical characteristics of participants
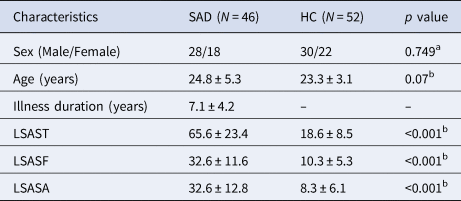
HC, healthy controls; LSAST, LSASF and LSASA, total score and fear and avoidance factor scores on the Liebowitz Social Anxiety Scale (LSAS); SAD, social anxiety disorder.
Continuous variables are presented as the means ± standard deviations.
a p value obtained using a χ2 test.
b p value obtained using an independent-sample t test.
Group differences in intra-network FNC
SAD patients, compared to HC, had significantly increased intra-network FNC in aDMN (right superior frontal gyrus, mainly in mPFC) and AUN [right superior temporal gyrus (STG)]. SAD patients had significantly decreased intra-network FNC in pDMN (left precuneus), AUN [left inferior parietal lobe (IPL)], dSMN (bilateral paracentral/right precentral gyrus and left postcentral gyrus), lVN [right inferior occipital gyrus (IOG)/fusiform gyrus (FFG)], mVN and pVN (mainly including bilateral calcarine cortex) and SCN (right caudate) (Fig. 2 and online Supplementary Table S1).

Fig. 2. Brain regions with significant differences of intrinsic intra-network functional connectivity between SAD patients and HC. All clusters survived correction for multiple comparisons with a significance threshold of a voxel-wise value of p < 0.001 and a family-wise error-corrected p < 0.05 at cluster level. Warm colours (positive values) represent increased intrinsic functional connectivity, cooler colours (negative values) decreased intrinsic functional connectivity, in SAD patients compared to HC. Abbreviations: aDMN, anterior default mode network; AUN, auditory network; dSMN, dorsal sensorimotor network; FFG, fusiform gyrus; HC, healthy controls; IOG, inferior occipital gyrus; IPL, inferior parietal lobe; lVN, lateral visual network; mVN, medial visual network; pDMN, posterior default mode network; pVN, posterior visual network; SAD, social anxiety disorder; SCN, subcortical network; SFG, superior frontal gyrus; STG, superior temporal gyrus.
Group differences in inter-network FNC
SAD patients, compared to HC, had significantly increased inter-network FNC between SCN and lFPN, DAN, VAN, mVN. SAD patients had significantly decreased inter-network FNC between aDMN and pDMN, DAN, dSMN; between pDMN and pVN; between lFPN and dSMN; between DAN and vSMN; between dSMN and vSMN, AUN, mVN, lVN; between vSMN and AUN, mVN, lVN; and between AUN and mVN, lVN, pVN (Fig. 3).
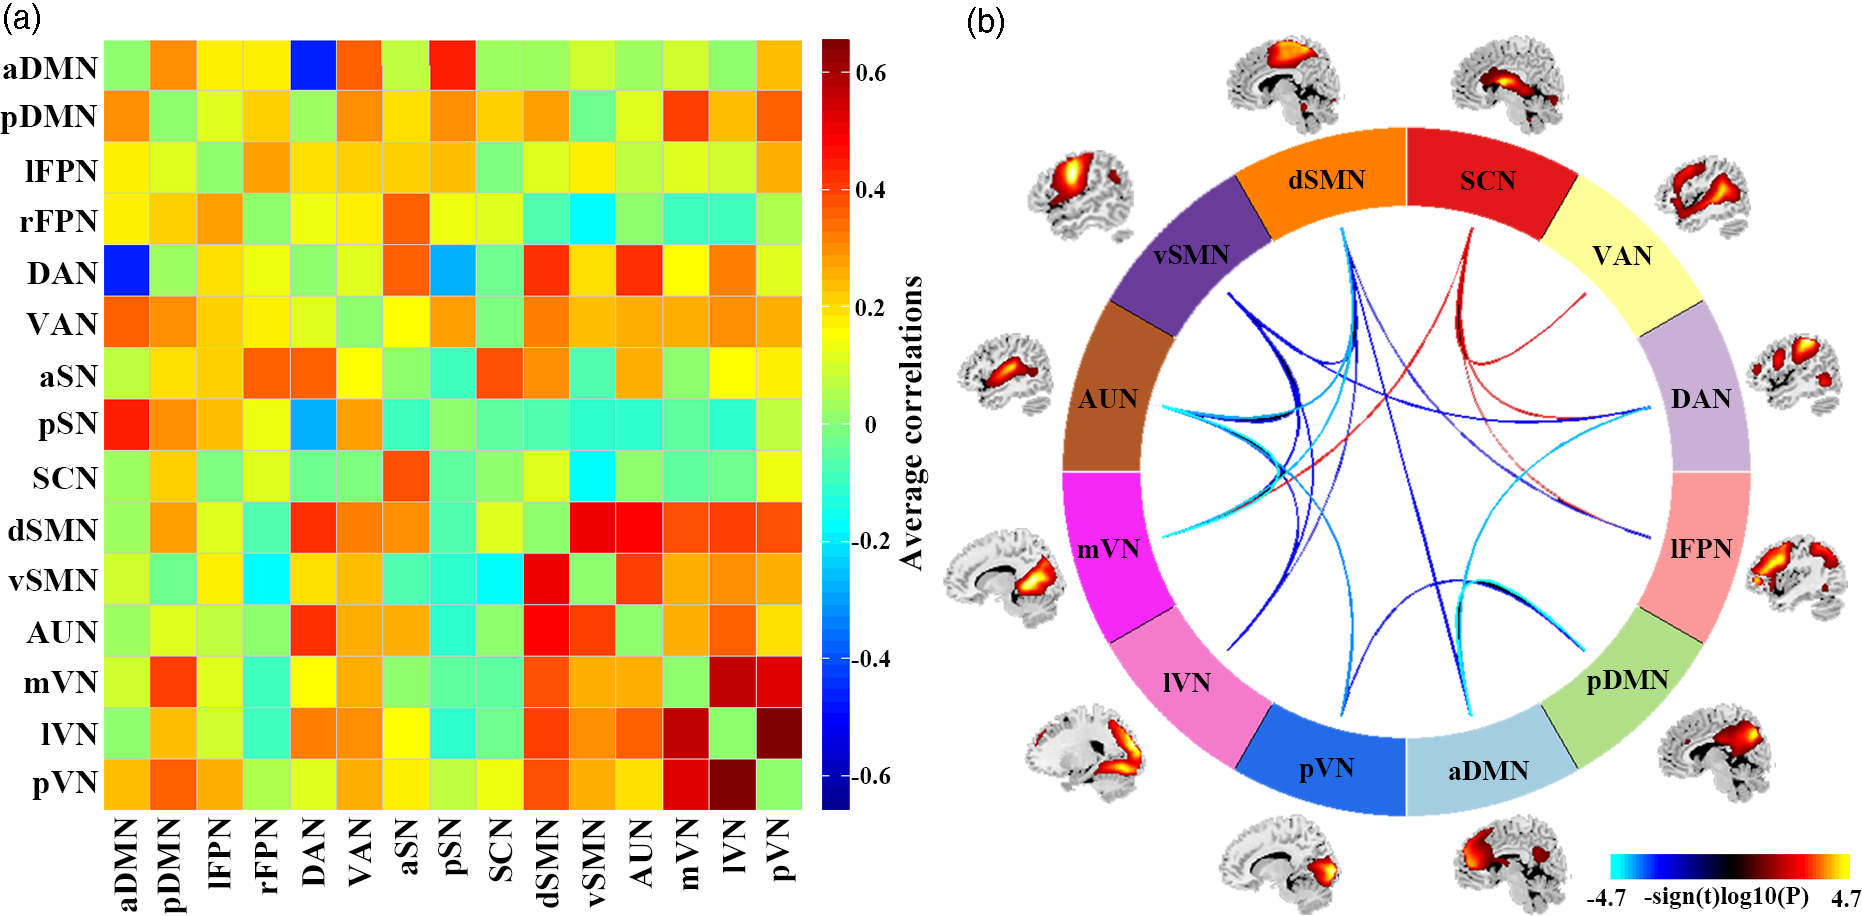
Fig. 3. Results of inter-network functional connectivity analyses. (a) Inter-network functional connectivity matrix. Pairwise correlations between resting-state functional networks were averaged across participants. (b) Between-group differences of inter-network functional connectivity between SAD patients and HC. Warmer colours represent increased inter-network FNC, cooler colours decreased inter-network FNC in social anxiety disorder compared to healthy controls. Abbreviations: aDMN, anterior default mode network; aSN, anterior salience network; AUN, auditory network; DAN, dorsal attention network; dSMN, dorsal sensorimotor network; lFPN, left frontoparietal network; lVN, lateral visual network; mVN, medial visual network; pDMN, posterior default mode network; pSN, posterior salience network; pVN, posterior visual network; rFPN, right frontoparietal network; SCN, subcortical network; VAN, ventral attention network; vSMN, ventral sensorimotor network.
Clinical correlates of intrinsic FNC
Among the 12 significant intra-network FNCs and 20 significant inter-network FNCs, after controlling for the confounders of sex, age and mean FD, the intra-network FNC of mVN (i.e. left calcarine cortex) was significantly positively correlated with illness duration (r = 0.313, p = 0.041); the inter-network FNC of vSMN-mVN was positively correlated with illness duration (r = 0.325, p = 0.034); significant positive correlations were also observed between inter-network FNC of mVN-SCN and LSAST (r = 0.317, p = 0.038) and also LSASA (r = 0.411, p = 0.006) (online Supplementary Fig. S1). None of these results survived correction for multiple tests at FDR-corrected p < 0.05.
Single-subject classification of SAD patients v. HC
The accuracy of SVM classification for SAD v. HC based on the significant intrinsic FNC was highly significantly above chance (p < 0.001); the intra-network FNC demonstrated the best performance with total accuracy 86.7%, sensitivity 91.3%, specificity 88.5% and AUC 94.4% (Fig. 4 and online Supplementary Table S2).

Fig. 4. Single-subject classification of SAD patients v. HC. Abbreviations: AUC, area under the receiver operating characteristic curve; FNC, functional network connectivity; HC, healthy controls; SAD, social anxiety disorder.
Discussion
To the best of our knowledge, this is the first study to investigate intrinsic FNC at resting-state in a relatively large and homogeneous sample of patients with SAD. SAD patients had intra-network FNC abnormalities mainly in aDMN, pDMN, SCN and the perceptual system (SMN, AUN and VN) and large-scale inter-network FNC abnormalities among DMN, FPN, AN, SCN, SMN, VN and AUN. Abnormal FNC were correlated to SAD severity and duration, suggesting pathophysiological relevance. Furthermore, intrinsic FNC anomalies allowed individual classification of SAD v. HC with significant accuracy, suggesting potential diagnostic efficacy. These findings offer some insights into the neurobiology of SAD, as we discuss briefly below.
Intra-network FNC abnormalities in SAD
At the intra-network level, we found increased intrinsic FNC in aDMN (mPFC), in combination with decreased FNC in pDMN (precuneus), which is broadly consistent with previous reports in SAD (Bas-Hoogendam, van Steenbergen, Tissier, van der Wee, & Westenberg, Reference Bas-Hoogendam, van Steenbergen, Tissier, van der Wee and Westenberg2020; Heitmann et al., Reference Heitmann, Feldker, Neumeister, Zepp, Peterburs, Zwitserlood and Straube2016; Liu et al., Reference Liu, Zhu, Wang, Guo, Li, Wang and Chen2015b; Mizzi et al., Reference Mizzi, Pedersen, Lorenzetti, Heinrichs and Labuschagne2022). The DMN plays a critical role in self/other-referential judgements, emotional processing, recollection of experiences and analysis of others' mental states (Raichle, Reference Raichle2015), and is involved in other social, affective and introspective processes (Amft et al., Reference Amft, Bzdok, Laird, Fox, Schilbach and Eickhoff2015): aDMN is mainly involved in self/other-referential judgements, while pDMN is implicated in autobiographical/episodic memory retrieval and scene construction (Xu, Yuan, & Lei, Reference Xu, Yuan and Lei2016). It is tempting to relate abnormal FNC in DMN to functional cognitive models of disturbed self-evaluative and referential processes, such as maladaptive self-focused attention, emotional hyperarousal in combination with defective top-down regulation, post-event rumination, excessive focus and unreasonable speculation on others' intentions and facial expressions (Cremers & Roelofs, Reference Cremers and Roelofs2016).
Besides, consistent with extant literature (Finlayson-Short, Harrison, & Davey, Reference Finlayson-Short, Harrison and Davey2021; Hjorth et al., Reference Hjorth, Frick, Gingnell, Hoppe, Faria, Hultberg and Furmark2021; Xu et al., Reference Xu, Van Dam, Feng, Luo, Ai, Gu and Xu2019), dysfunctional intrinsic connectivity in the caudate nucleus (ventral striatum) was observed in SAD patients. The striatum is linked to many important functions including motor and cognitive control, emotional regulation, social learning and reward-related motivation processing (Lago, Davis, Grillon, & Ernst, Reference Lago, Davis, Grillon and Ernst2017; Pan et al., Reference Pan, Wang, Zhao, Lai, Qin, Li and Gong2021; Pennartz et al., Reference Pennartz, Berke, Graybiel, Ito, Lansink, van der Meer and Voorn2009); recruitment of reward system (including ventral striatum) is also involved in self-referential processing, particularly when external stimuli are considered to be self-related (Northoff & Hayes, Reference Northoff and Hayes2011). In this sense, intrinsic FNC abnormality in caudate nucleus may underlie imbalance of the neural approach-avoidance motivation system and self-referential mental activity in SAD (Xu et al., Reference Xu, Van Dam, Feng, Luo, Ai, Gu and Xu2019).
Further, we found abnormal intrinsic FNC in the perceptual/sensory system, mainly dSMN (bilateral paracentral/right precentral gyrus and left postcentral gyrus), AUN (right STG and left IPL) and VN [lVN (right IOG/FFG), mVN and pVN (bilateral calcarine cortex)]. Abnormal activity and connectivity involving SMN, AUN and VN is reported in SAD, both in response to socially threatening stimuli and at rest (Dixon et al., Reference Dixon, Moodie, Goldin, Farb, Heimberg and Gross2020; Goldin, Manber, Hakimi, Canli, & Gross, Reference Goldin, Manber, Hakimi, Canli and Gross2009; Liao et al., Reference Liao, Chen, Feng, Mantini, Gentili, Pan and Zhang2010; Liu et al., Reference Liu, Guo, Fouche, Wang, Wang, Ding and Chen2015a; Phan, Fitzgerald, Nathan, & Tancer, Reference Phan, Fitzgerald, Nathan and Tancer2006; Zhang et al., Reference Zhang, Suo, Yang, Lai, Pan, He and Gong2022b), and in one report the response to pharmacotherapy was associated with altered neural activation of this perceptual/sensory system in a social anxiety imagery task (Kilts et al., Reference Kilts, Kelsey, Knight, Ely, Bowman, Gross and Nemeroff2006). The SMN is important in the analysis of others' communicative intentions from perceptual cues including gaze direction, body gesture and facial expression (Conty, Dezecache, Hugueville, & Grezes, Reference Conty, Dezecache, Hugueville and Grezes2012). Consequently, dysconnectivity in SMN may be related to gaze avoidance towards emotional stimuli in SAD (Weeks, Howell, & Goldin, Reference Weeks, Howell and Goldin2013). Additionally, AUN is considered to be involved not only in auditory information perception and processing but also social cognition (mnemonic and attentional) of fearful experiences (Quirk, Armony, & LeDoux, Reference Quirk, Armony and LeDoux1997): for instance, STG (the core component of AUN) demonstrated aberrant activation and dysconnectivity in anxiety patients actively listening to threat-related words (Zhao, Xi, Wang, Li, & He, Reference Zhao, Xi, Wang, Li and He2014). In this sense, our results of impaired intra-network connectivity in AUN may indicate abnormal auditory information perception and social cognitive processing in SAD. Furthermore, VN is crucial in social information processing: for example, the FFG, part of the lVN responsible for the perception of emotions in facial stimuli (Gomez et al., Reference Gomez, Barnett, Natu, Mezer, Palomero-Gallagher, Weiner and Grill-Spector2017) and facial emotion processing, is usually abnormal in SAD (Machado-de-Sousa et al., Reference Machado-de-Sousa, Arrais, Alves, Chagas, de Meneses-Gaya, Crippa and Hallak2010). Our results therefore offer further evidence for perceptual impairments and compromised social information processing in SAD.
Inter-network FNC abnormalities in SAD
An optimal balance between functional specialization (intra-network synchronization) and integration (inter-network coupling) during the dynamic interactions of multiple networks is essential to high-level affective and cognitive processes (Berman et al., Reference Berman, Gotts, McAdams, Greenstein, Lalonde, Clasen and Rapoport2016). Even for networks (e.g. FPN, AN) whose intrinsic intra-network connectivity did not alter in SAD, we found striking large-scale inter-network connectivity abnormalities.
The DMN consists of two subsystems (aDMN and pDMN) that interact with a common core system, of which the mPFC and PCC are the respective hubs (Andrews-Hanna, Reidler, Sepulcre, Poulin, & Buckner, Reference Andrews-Hanna, Reidler, Sepulcre, Poulin and Buckner2010). The former is mainly involved in self/other-referential judgements, while the latter is implicated in autobiographical/episodic memory retrieval and scene construction (Xu et al., Reference Xu, Yuan and Lei2016). Proper coupling of aDMN and pDMN is vital for normal brain functioning (D'Argembeau et al., Reference D'Argembeau, Stawarczyk, Majerus, Collette, Van der Linden and Salmon2010), and this is aberrant in several neuropsychiatric disorders (Hare et al., Reference Hare, Ford, Mathalon, Damaraju, Bustillo, Belger and Turner2019; Wang et al., Reference Wang, Wang, Huang, Jia, Zheng, Zhong and Huang2020b; Zhang et al., Reference Zhang, Liu, Chen, Li, Duan, Xie and Chen2015). Our finding of decreased FNC between aDMN and pDMN may reflect a disrupted functional coupling, underpinning dysfunctional DMN-related clinical manifestations in SAD (e.g. maladaptive self-evaluative events and referential processes).
The task-negative DMN is deactivated during goal-directed behaviour with focused attention (Raichle, Reference Raichle2015), whereas the anti-correlated task-positive DAN has a top-down role in managing rules and goals during externally directed tasks (Turner & Spreng, Reference Turner and Spreng2012). These systems work competitively, switching between internally and externally oriented cognitive processing (Fox et al., Reference Fox, Snyder, Vincent, Corbetta, Van Essen and Raichle2005), contributing to cognitive control, emotional regulation and episodic memory performance (Anticevic et al., Reference Anticevic, Cole, Murray, Corlett, Wang and Krystal2012; Kragel & Polyn, Reference Kragel and Polyn2015). Our finding of decreased FNC between aDMN and DAN may reflect disrupted switching between internally and externally oriented cognitive control and emotional regulation in SAD.
SAD patients demonstrated increased inter-network FNC between SCN and lFPN, DAN, VAN and mVN. In the latest neurocircuitry model, core characteristics of SAD are bottom-up hyper-response and top-down reduced regulation efficiency, leading to emotional hyper-arousal and diminished cognitive control (Bruhl et al., Reference Bruhl, Delsignore, Komossa and Weidt2014). In support of this, hypo-activation in the high-order cortical areas and hyper-activation in the subcortical regions, as well as decreased FC of cortical–subcortical circuitry have been widely reported in SAD (Mizzi et al., Reference Mizzi, Pedersen, Lorenzetti, Heinrichs and Labuschagne2022; Zhang et al., Reference Zhang, Suo, Yang, Lai, Pan, He and Gong2022b). Nevertheless, we found increased connectivity in the cortical–subcortical circuit (i.e. SCN-lFPN/DAN/VAN). As increased connectivity is usually taken to indicate increased coupling and integrated communication (i.e. enhanced potential for top-down control and modulation), an appealing explanation is that top-down control modulation is increased but still fails to compensate for heightened social anxiety, perhaps due to disturbed structural connectivity or insufficient strong enough control (Bruhl et al., Reference Bruhl, Delsignore, Komossa and Weidt2014; Yang et al., Reference Yang, Liu, Meng, Xia, Cui, Wu and He2019).
We also found dysconnectivity among higher-order cognitive control systems (e.g. DMN, lFPN, DAN) and the primary perceptual/sensorimotor system (e.g. mVN, lVN, pVN, dSMN, vSMN, AUN). SAD patients suffer from persistent cognitive biases regarding socially threatening cues, notably faces and voices (Morrison & Heimberg, Reference Morrison and Heimberg2013). There is substantial evidence for involvement of perceptual/sensorimotor system in emotion perception and experience (Hardee et al., Reference Hardee, Cope, Munier, Welsh, Zucker and Heitzeg2017), perception of fear expression in faces (i.e. for processing social face signals) (Pourtois et al., Reference Pourtois, Sander, Andres, Grandjean, Reveret, Olivier and Vuilleumier2004) and emotional regulation in responses to threat-related information (Kropf, Syan, Minuzzi, & Frey, Reference Kropf, Syan, Minuzzi and Frey2019). Impaired processing for sensory/perceptual integration of audio-visual signals in corresponding sensorimotor cortices and disrupted cognitive modulation in the higher integrative networks is responsible for clinical signs of hypervigilance towards social stimuli, exaggerated fear responses and consequent avoidance behaviour (Kreifelts et al., Reference Kreifelts, Eckstein, Ethofer, Wiegand, Wächter, Brück and Wildgruber2019; Kreifelts et al., Reference Kreifelts, Ethofer, Wiegand, Brück, Wächter, Erb and Wildgruber2020). In short, abnormalities within and across sensorimotor/perceptual-cognitive interactions result in inappropriate processing of external social signal, abnormal emotional arousal and cognitive bias. It may be, therefore, that the decreased FNC between the cognitive-control and sensorimotor/perceptual systems underlies hypervigilance towards threateningly social stimuli, persistent heightened attentiveness to sensory input, disrupted perceptual analysis of sensory events and dysfunctional cognitive control in SAD (Miskovic & Schmidt, Reference Miskovic and Schmidt2012).
These results make an interesting comparison with our previous seed-based rs-fMRI analysis in these patients (Zhang et al., Reference Zhang, Suo, Yang, Lai, Pan, He and Gong2022b). That demonstrated decreased FC between SCN with the components of DMN (PFC/ACC and cerebellum), with part of the SMN (supplementary motor area), and increased FC between SCN and temporal lobe (Zhang et al., Reference Zhang, Suo, Yang, Lai, Pan, He and Gong2022b); the present ICA-based study shows widespread inter-network FNC abnormalities among higher-order cognitive control systems (e.g. DMN, lFPN, DAN, VAN and SCN) and the primary perceptual/sensorimotor system (e.g. mVN, lVN, pVN, dSMN, vSMN, AUN). The likeliest reason for these seeming discrepancies is that the two analyses were conducted by different methods and at different levels of brain patterns: the seed-based approach investigates the single interaction between the predefined ROI and each whole-brain voxel, while the ICA investigates multiple simultaneous voxel-to-voxel interactions among large-scale networks (Smith et al., Reference Smith, Vidaurre, Beckmann, Glasser, Jenkinson, Miller and Van Essen2013; Smitha et al., Reference Smitha, Akhil Raja, Arun, Rajesh, Thomas, Kapilamoorthy and Kesavadas2017).
FNC as a potential diagnostic biomarker for SAD
We present the first evidence, to our knowledge, that intrinsic abnormal FNC (especially the intra-network FNC) allows individual classification of SAD v. HC with significant accuracy. Machine learning is a promising tool to help clinicians develop neuroimaging-based biomarkers for early diagnosis in clinical practice (Chen et al., Reference Chen, Zang, Braun, Schwarz, Harneit, Kremer and Schwarz2020; Frick et al., Reference Frick, Gingnell, Marquand, Howner, Fischer, Kristiansson and Furmark2014; Liu et al., Reference Liu, Guo, Fouche, Wang, Wang, Ding and Chen2015a; Zhan et al., Reference Zhan, Wei, Liang, Xu, He, Robbins and Wang2021), and could potentially guide early diagnosis and interventions to improve the quality of life of SAD patients (Bas-Hoogendam & Westenberg, Reference Bas-Hoogendam and Westenberg2020; Etkin, Reference Etkin2019). Considering the prevalent comorbidity of other neuropsychiatric disorders in SAD, future research should investigate whether our findings are selective for SAD, rather than trans-diagnostic characteristics of psychiatric disorders.
Limitations and future directions
This study has several limitations. First, the cross-sectional design precludes it from explicit causal inference. This will need longitudinal studies recruiting both SAD patients and individuals with high susceptibility to developing SAD (e.g. based on the genotypes and endophenotypes (Bas-Hoogendam et al., Reference Bas-Hoogendam, Blackford, Bruhl, Blair, van der Wee and Westenberg2016)). Second, it would have been desirable to measure (and use to match with HC) general cognitive ability (e.g. general intelligence). Nevertheless, as there is no definite evidence that SAD patients suffer from intellectual impairment (Stein & Stein, Reference Stein and Stein2008), we do not expect the general intelligence is a significant confounder. Third, although medium-sized effects were expected based on power analysis (as far as we know, the present study is the relatively large single-centre study investigating intrinsic FNC deficits using ICA in non-comorbid SAD patients), our sample size is smaller than some recent studies in other psychiatric disorders. A major reason for this is the strictness of our inclusion criteria: we studied only adult SAD patients without any comorbid disorders, in the hope of probing the specific neurofunctional underpinnings of SAD, which may also restrict the generalizability of our findings. This will require specific investigation on the potential effects of those demographic confounded factors on intrinsic functional anomaly in SAD in the future, and our results need further replication via a larger sample. Fourth, considering that SAD typically evolves during late childhood and early adolescence, it remains unknown how applicable these findings on adults are to adolescents; establishing this will require similar studies of child and adolescent SAD patients. Fifth, our rs-fMRI findings showed considerable overlap with those of previous task-fMRI studies, indicating that some aberrant intrinsic network connectivity as disturbed function for SAD can also be observed at rest, yet it remains elusive how the two aspects relate, and this merits future study to investigate the exact relationship between intrinsic network connectivity from task-fMRI and rs-fMRI. Sixth, our machine learning results are more of a preliminary exploration on the potential diagnostic value of intrinsic FNC, and will need extending with external validation samples in future classification studies. Finally, it needs to be clarified whether current results could have been confounded by examination-related anxiety during the MRI scans; future studies could usefully evaluate the psychophysiological reactions of participants before, during and after the MRI examination.
Conclusions
Using data-driven ICA and SVM analyses, this study identified in SAD patients intrinsic FNC abnormalities within and across large-scale brain functional networks involving not only the high-order cognitive networks (e.g. DMN, FPN, DAN, VAN and SCN) but also the primary perceptual networks (e.g. VN, SMN and AUN), some of which were correlated to symptom severity and disease duration. Aberrant intrinsic FNC might be useful to discriminate SAD from HC at individual level. This study offers some insights into the neurobiology of SAD, which may help to identify neurofunctional biomarkers for its clinical diagnosis.
Supplementary material
The supplementary material for this article can be found at https://doi.org/10.1017/S0033291722003439
Data
The data and code that support the findings of present study are available from the corresponding author through reasonable request. The data and code sharing adopted by the authors comply with the requirements of the funding institute and with institutional ethics approval.
Acknowledgements
The authors would like to express their sincere appreciation to supervisor and colleagues for valuable advice. We also thank all the participants in this study.
Author contributions
XZ conceptualized and designed the study. QYG and SW supervised the conduct of the study. XZ, XY, NFP and MH contributed to the data collection. BLW provided methodological advice. XZ performed the data analysis, results interpretation, and visualization, original draft writing and editing. SW and GJK provided interpretive advice and critically revised the manuscript, which all authors reviewed and approved for publication.
Financial support
This study was supported by National Key R&D Program of China (2022YFC2009900) and the National Natural Science Foundation of China (Grant Nos. 81621003, 81761128023, 81820108018, 82027808). The funding sources had no involvement in the study design, data collection and analysis, results interpretation or writing of the paper.
Conflict of interest
None.


 Open access