


Introduction
Electroconvulsive therapy (ECT) was established as an effective intervention for depression over 80 years ago, and with technical refinements to maximize safety (Kaster et al., Reference Kaster, Vigod, Gomes, Sutradhar, Wijeysundera and Blumberger2021), it is associated with response rates of 60–80% (Bauer et al., Reference Bauer, Pfennig, Severus, Whybrow, Angst and Moller2013; Espinoza & Kellner, Reference Espinoza and Kellner2022) and remission rates over 50% (Bahji, Hawken, Sepehry, Cabrera, & Vazquez, Reference Bahji, Hawken, Sepehry, Cabrera and Vazquez2019; Dierckx, Heijnen, van den Broek, & Birkenhager, Reference Dierckx, Heijnen, van den Broek and Birkenhager2012). ECT is one of the few avenues for treatment-resistant depression (Bahji et al., Reference Bahji, Hawken, Sepehry, Cabrera and Vazquez2019), which affects at least 30% of people with depression (Fava, Reference Fava2003; Rush et al., Reference Rush, Trivedi, Wisniewski, Nierenberg, Stewart, Warden and Fava2006; Zhdanava et al., Reference Zhdanava, Pilon, Ghelerter, Chow, Joshi, Lefebvre and Sheehan2021). Although the mechanism of ECT is not precisely known, it may be associated with both relatively acute changes in neural plasticity (Gbyl & Videbech, Reference Gbyl and Videbech2018; Joshi et al., Reference Joshi, Espinoza, Pirnia, Shi, Wang, Ayers and Narr2016; Mulders et al., Reference Mulders, Llera, Beckmann, Vandenbulcke, Stek, Sienaert and Tendolkar2020; Oltedal et al., Reference Oltedal, Narr, Abbott, Anand, Argyelan, Bartsch and Dale2018) and inflammation (Belge et al., Reference Belge, van Diermen, Sabbe, Parizel, Morrens, Coppens and van Eijndhoven2020; Yrondi et al., Reference Yrondi, Sporer, Peran, Schmitt, Arbus and Sauvaget2018).
Volumetric increases in the hippocampus and amygdala occur after the index ECT course (Joshi et al., Reference Joshi, Espinoza, Pirnia, Shi, Wang, Ayers and Narr2016; Qiu et al., Reference Qiu, Li, Zhao, Du, Huang, Fu and Luo2016; Sartorius et al., Reference Sartorius, Demirakca, Bohringer, Clemm von Hohenberg, Aksay, Bumb and Ende2016), yet few studies have explored the durability of structural gray matter changes afterward. One study measured structural changes in 14 subjects six months after the ECT course and found reduced orbitofrontal thickness and decreased hippocampal volume (Gbyl et al., Reference Gbyl, Rostrup, Raghava, Carlsen, Schmidt, Lindberg and Videbech2019). A second study followed 12 subjects 10–36 months after an index ECT course and reported decreased hippocampal and thalamic volume (Jehna et al., Reference Jehna, Wurm, Pinter, Vogel, Holl, Hofmann and Enzinger2021). Finally, a third study that assessed brain volume six months after an index ECT course did not report direct comparisons between volumes at the end of an index ECT course and the six-month follow-up (Brancati et al., Reference Brancati, Brekke, Bartsch, Evjenth Sorhaug, Ousdal, Hammar and Oltedal2021). However, aside from the right amygdala, none of the 97 regions of interest significantly differed from pre-treatment volumes, which suggests a widespread volumetric decrease after six months.
None of the three previous longitudinal studies reported the relationship between changes in volume/thickness and changes in mood six months after the index ECT course. The average depression scores were roughly equivalent at the end of index ECT and follow-up in all studies. However, the similarity of mean depression scores at the end of index ECT and follow-up does not mean there is no relationship between mood and brain structure. That is, depressive symptoms and brain structure may change in subgroups of subjects even though mean depression measures do not; this hypothesis is the focus of the present investigation.
The role of inflammation in depression is well-documented (Haroon et al., Reference Haroon, Daguanno, Woolwine, Goldsmith, Baer, Wommack and Miller2018; Howren, Lamkin, & Suls, Reference Howren, Lamkin and Suls2009; Leonard, Reference Leonard2018; Osimo et al., Reference Osimo, Pillinger, Rodriguez, Khandaker, Pariante and Howes2020; Petralia et al., Reference Petralia, Mazzon, Fagone, Basile, Lenzo, Quattropani and Nicoletti2020; Roman & Irwin, Reference Roman and Irwin2020) and several studies have suggested that inflammation, as measured by peripheral cytokine concentrations, may play a role in ECT mechanisms (Carlier et al., Reference Carlier, Berkhof, Rozing, Bouckaert, Sienaert, Eikelenboom and Exel2019; Stippl, Kirkgoze, Bajbouj, & Grimm, Reference Stippl, Kirkgoze, Bajbouj and Grimm2020; Yrondi et al., Reference Yrondi, Sporer, Peran, Schmitt, Arbus and Sauvaget2018). For example, higher IL-6 levels at baseline predict a more favorable response to an index ECT course (Kruse et al., Reference Kruse, Congdon, Olmstead, Njau, Breen, Narr and Irwin2018) and subsequent increases in IL-8 over the course of ECT treatment predict treatment response to ECT in females (Kruse et al., Reference Kruse, Olmstead, Hellemann, Wade, Jiang, Vasavada and Irwin2020). Generally, IL-6 and TNF-α levels appear to decrease after index treatment with ECT, though the findings are somewhat variable, possibly because of small sample sizes (Yrondi et al., Reference Yrondi, Sporer, Peran, Schmitt, Arbus and Sauvaget2018). A recent study reported an inverse association between IL-6 and TNF-α levels and hippocampal volume after an index ECT course, though neither change was related to ECT response (Belge et al., Reference Belge, van Diermen, Sabbe, Parizel, Morrens, Coppens and van Eijndhoven2020). Thus, while there is a growing body of evidence that inflammation may predict treatment response to ECT and that ECT provokes inflammatory changes, little evidence relates inflammation and brain structure to the heterogeneity of longer-term ECT response.
This six-month study sought to determine the relationship between brain volume, inflammation, and depressive symptoms after an index ECT course. We obtained structural magnetic resonance imaging (MRI) scans and measures of peripheral inflammatory markers from participants after an index ECT course and again after six months to estimate changes in gray matter volume and inflammation. Though inflammatory changes have not been explored six months after index ECT, we anticipated that inflammation would be related to changes in brain volume based on studies of index ECT. We further hypothesized that decreased gray matter volume (particularly in temporal and hippocampal regions) would be related to increased depressive symptoms six months after ECT.
Methods
Participants
Participants (n = 20; 10 males; 10 females) were recruited from individuals receiving ECT at the University of California Los Angeles (UCLA) Resnick Neuropsychiatric Hospital. Demographic characteristics are provided in Table 1. Participants were a subset of those described in previous work (Joshi et al., Reference Joshi, Espinoza, Pirnia, Shi, Wang, Ayers and Narr2016; Kruse et al., Reference Kruse, Congdon, Olmstead, Njau, Breen, Narr and Irwin2018, Reference Kruse, Olmstead, Hellemann, Wade, Jiang, Vasavada and Irwin2020; Kubicki et al., Reference Kubicki, Leaver, Vasavada, Njau, Wade, Joshi and Narr2019; Leaver et al., Reference Leaver, Vasavada, Joshi, Wade, Woods, Espinoza and Narr2019) investigating changes from pre-ECT baseline to the end of an index ECT course. The UCLA Institutional Review Board approved this study.
Table 1. Demographics and clinical characteristics

Note: Standard deviation in parentheses. n = 20.
Subjects met DSM-IV TR criteria for a major depressive episode (MDD: n = 18; bipolar disorder: n = 2), which was confirmed by psychiatric evaluation and Mini-International Neuropsychiatric Interview (MINI) (Sheehan et al., Reference Sheehan, Lecrubier, Sheehan, Amorim, Janavs, Weiller and Dunbar1998). All subjects had at least two prior major depressive episodes and had to meet the operational definition of treatment-resistant depression by failing to respond to a least two antidepressants in the current episode (Gaynes et al., Reference Gaynes, Lux, Gartlehner, Asher, Forman-Hoffman, Green and Lohr2020; Sackeim, Reference Sackeim2001; Souery et al., Reference Souery, Amsterdam, de Montigny, Lecrubier, Montgomery, Lipp and Mendlewicz1999).
Exclusion criteria included comorbid psychiatric disorders, dementia, first-episode depression, depression onset after 50 years of age, depression related to serious medical illness, or any neuro-modulation treatment (e.g. vagal nerve stimulation, repetitive transcranial magnetic stimulation) within six months of an index ECT course. Participants were excluded if they had a history of alcohol or substance abuse within the past six months and/or dependence within the past year, any neurological disorder, or contraindication to MRI. Prior treatment with ECT was not an exclusion criterion.
Procedure
Participants received an index course of ECT per the usual clinical protocol and were followed for six months. We obtained structural MRI scans at the end of the index treatment and the six-month follow-up and, for some participants, measures of peripheral inflammatory markers. Mood was assessed at both time points with the 17-item Hamilton Depression Rating Scale (HAM-D) (Hamilton, Reference Hamilton1960).
ECT treatment
The seizure threshold titration method of ECT (5000Q MECTA Corp.) was used. ECT treatments were administered beginning with right unilateral d'Elia lead placement, using an ultra-brief pulse-width (0.3 msec) and a charge at 6 × seizure threshold. If there was insufficient clinical response after 10 treatments, then placement was switch to bitemporal with a charge at 2 × seizure threshold, using a brief pulse-width (0.5 msec). For the index course, ECT was administered three times a week, for a mean total of 11.1 sessions per participant (range 6–16 sessions), using a standard protocol (methohexital and succinylcholine) for anesthesia (Kruse et al., Reference Kruse, Olmstead, Hellemann, Wade, Jiang, Vasavada and Irwin2020). Participants resumed pharmacological antidepressants per clinical guidelines. Because this study was naturalistic, some participants received maintenance ECT, some antidepressants, and some a combination as clinically determined. Response to index ECT was defined as ⩾ 50% reduction in HAM-D score from initiation to the end of index treatment. During the six-month follow-up, nine subjects received maintenance ECT.
Image acquisition
All subjects were scanned on a 3 T Allegra MRI scanner (Siemens Medical Systems, Erlangen, Germany) with a structural motion-corrected (Tisdall et al., Reference Tisdall, Hess, Reuter, Meintjes, Fischl and van der Kouwe2012) multi-echo magnetization prepared rapid acquisition gradient-echo (MPRAGE) sequence (TEs/TR = 1.74, 3.6, 5.46, 7.32/2530 ms, TI = 1260 ms, FA = 7°; field of view = 256 × 256 mm; matrix = 256 × 192; voxel size = 1.3 × 1 × 1 mm3).
MRI data analysis
MRI scans were normalized to the standardized MNI template within SPM using a 12-parameter affine registration with 1.5 mm isotropic voxels and then segmented into gray and white matter using the default ICBM tissue probability map. The segmented gray matter images were modulated to account for the previous effects of spatial normalization and smoothed with an 8 mm full-width at half-maximum Gaussian kernel. Longitudinal image preprocessing was performed within the Computational Anatomy Toolbox (CAT12 v1450; http://www.neuro.uni-jena.de/cat) using Statistical Parametric Mapping Software (SPM12 v6906; http://www.fil.ion.uclac.uk/spm/software/spm12/). CAT12 longitudinal processing is optimized for detecting brain plasticity with voxel-based morphometry (VBM) over periods ranging from weeks to months and has been applied in prior longitudinal studies of depression (Yuksel et al., Reference Yuksel, Engelen, Schuster, Dietsche, Konrad, Jansen and Krug2018). For whole-brain analyses, the resulting gray matter volumes were analyzed using a general linear model within SPM12 in which follow-up volume was predicted by the end of index treatment volume, with total intracranial volume included as a time-varying covariate. Statistical significance was set at p < 0.01, using family-wise error (FWE) correction for multiple comparisons. Mean volumes of the resulting significant clusters were computed for each subject using the mean volume tool within CAT12 for subsequent analyses. For region-of-interest analyses (ROI), we computed atlas-based volumes (Maldjian, Laurienti, Kraft, & Burdette, Reference Maldjian, Laurienti, Kraft and Burdette2003) and analyzed change as above using CAT12. Volumes were converted to Talairach space and labels assigned using the Talairach daemon with WFU PickAtlas.
Inflammatory markers
We obtained measures of peripheral inflammatory markers from a subset of participants at the end of index treatment and follow-up (n = 16 for CRP; n = 15 for all others). There were no statistically significant differences between participants from whom we obtained follow-up measures of inflammatory markers and those from whom we did not with respect to age, t(18) = –0.74, p = 0.47, HAM-D at end of index ECT course treatment, t(18) = 0.40, p = 0.70, or HAM-D at follow-up, t(18) = –0.81, p = 0.43.
All blood samples were collected within one week of the last index ECT treatment, between 8–11 a.m., to avoid diurnal variation. We used established procedures with a Bio-Plex 200 (Luminex) instrument and a high-sensitivity multiplex immunoassay (Performance High Sensitivity Human Cytokine, R&D Systems, Minneapolis, MN) to assay IL-6, IL-8, and TNF-α. CRP plasma levels were measured with the Human CRP Quantikine ELISA (R&D Systems) using the manufacturer's protocol and the following modifications: samples were diluted 500-fold, and the standard curve was extended to 0.4 ng/mL to obtain a lower limit of detection of 0.2 mg/mL, accounting for sample dilution (Boyle et al., Reference Boyle, Cho, Eisenberger, Olmstead, Piber, Sadeghi and Irwin2020). Samples were measured in duplicate, and all samples from a subject were tested in the same batch on the same assay plate. The mean of the samples was used in analyses.
Statistical analyses
Because cytokine and CRP data were not normally distributed, measures were logarithmically transformed and corrected for BMI (Haroon et al., Reference Haroon, Fleischer, Felger, Chen, Woolwine, Patel and Miller2016; Kruse et al., Reference Kruse, Congdon, Olmstead, Njau, Breen, Narr and Irwin2018, Reference Kruse, Olmstead, Hellemann, Wade, Jiang, Vasavada and Irwin2020). All follow-up measures (cytokines, CRP, HAM-D) were adjusted for corresponding values at the end of index treatment to account for initial differences. ECT maintenance administration was effect coded for analytic purposes. Univariate linear regression was used to test relations between cytokines, CRP, and adjusted follow-up HAM-D score and mean change in cluster volumes over time. For exploratory purposes, we examined whether clusters of volumetric change between end of index ECT course and six-month follow-up predicted response to index ECT (see online Supplement). All analyses were performed with Stata/BE v17 for MacOS. The statistical significance level was set at p < 0.05.
Results
Demographic characteristics of subjects are provided in Table 1.
VBM analyses
Six months after the end the index ECT course, we found widespread decreased gray matter volume relative to the end of the index ECT course (Fig. 1). Our VBM analysis revealed four statistically significant clusters of decreased gray matter volume depicted in Fig. 2, with their peak-level voxel coordinates provided in Table 2. The first cluster included Brodmann's Area (BA) 9/32 (prefrontal/anterior cingulate) and precuneus; the second included right insula and BA 22 (superior temporal gyrus); the third included the left insula and caudate; the fourth included the right middle temporal gyrus (BA 21). There were no statistically significant increases in gray matter volume between the end of index treatment and follow-up, nor were there any significant decreases in hippocampal or amygdala volumes in our whole-brain analyses.

Fig. 1. Four significant clusters of decreased gray matter volume were observed six months after the index course of ECT. Images are thresholded at p < 0.01 (FWE). There were no regions of significant volumetric increase. Cluster numbers correspond to peak voxel labels provided in Table 3. Numbers next to axial slices for Clusters 2 and 3 refer to Talairach x-coordinates. (FWE, Family-wise error).

Fig. 2. Change in HAM-D scores from the end of the index ECT course to six-month follow-up according to whether participants responded to the index ECT course. Response was defined as a decrease in the HAM-D score of at least 50% from pre-treatment to end of the index ECT course.
Table 2. Coordinates of peak-level voxels of significant clusters of gray matter changes between the end of index course and follow-up

Note: For all clusters: p < 0.01, FWE-corrected. Cluster size provided in voxels. Coordinates are in Talairach space. (FWE: Family-wise error).
Table 3. Mean inflammatory levels at the end of index course and follow-up
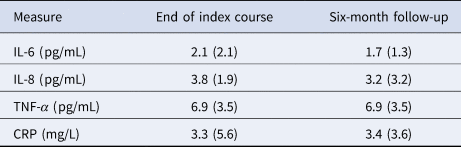
CRP (n = 16); IL-6, IL-8, & TNF-α (n = 15).
Standard deviation in parentheses.
Volumetric changes and mood
To evaluate the relation between the decreases in gray matter volume in the four clusters and change in HAM-D scores, we performed linear regression analyses controlling for age and found that decreased volume in Cluster 2 corresponded to increased HAM-D scores after the follow-up period, t(17) = 2.63, p = 0.02. The presence of maintenance ECT did not alter the relationship between Cluster 2 volume changes and HAM-D, t(16) = 2.32, p = 0.03. No other clusters were significantly related to changes in HAM-D scores.
To summarize, six months after the index ECT course, decreased Cluster 2 volume, including the right insula, parietal lobe, and inferior frontal gyrus, corresponded to worsening depressive symptoms. This relationship did not vary according to whether subjects received maintenance ECT.
Responder v. non-responder status
Twelve subjects responded to the index ECT course, defined by a decrease of at least 50% in HAM-D scores after treatment (Joshi et al., Reference Joshi, Espinoza, Pirnia, Shi, Wang, Ayers and Narr2016). Because there was a significant difference in HAM-D change over the six-month follow-up period between responders and non-responders, t(18) = 3.29, p = 0.004, we checked whether the relationship between volumetric change and mood varied as a function of the index response to ECT. To do this, we again performed linear regression analyses predicting HAM-D change scores but included responder status and the interaction between responder status and change in cluster volume. The volumetric cluster change and responder status were not significant for either cluster, with both p's > 0.50. However, the relations between HAM-D change scores and volumetric change remained significant for Cluster 2, t(16) = –2.32, p = 0.03. Thus, the relationship between volumetric change and mood after six months did not vary according to whether participants initially responded to the index ECT course.
The lack of interaction between changes in gray matter volume and responder status is likely attributable to the heterogeneity of depressive symptoms over the six-month follow-up. As shown in Fig. 2, roughly half the non-responders improved, whereas half the responders exhibited worsening depressive symptoms during follow-up. The bidirectional change in mood for both responders and non-responders explains why we could detect individual differences between structural gray matter changes and HAM-D scores in the absence of mean difference between the end of index treatment and follow-up scores.
End of index measures as predictors of follow-up HAM-D score
We also checked whether volumetric and inflammatory measures at the end of the index ECT course predicted depressive symptoms at follow-up. We performed regression analyses in which the follow-up HAM-D score was predicted by the end of index cluster volume or inflammation measures, controlling for age. HAM-D score at follow-up was significantly related only to the end of index volumes of Cluster 3, t(17) = 2.30, p = .03, and Cluster 4, t(17) = 2.52, p = .02.
Inflammatory measures, volumetric changes, and mood
Mean levels of inflammatory measures at the end of index course and follow-up are provided in Table 3. In product-moment correlations among the inflammatory measures, decreased IL-8 levels were significantly related to decreased HAM-D scores, r = 0.65, p = 0.01. Concerning relations between inflammatory measures and changes in brain volume, IL-8 levels were inversely correlated with volumetric changes in Cluster 4, r = −0.52, p = 0.05. Changes in CRP levels were negatively, though not significantly, correlated with volumetric changes in Cluster 3, r = −0.47, p = 0.07. No other correlations between cytokines and changes in cluster volumes were statistically significant, all p's > 0.05.
IL-8 as a mediator or moderator of depression and plasticity relationship
We next checked the degree to which inflammatory change mediated or moderated the relationship between changes in brain volume and depression. We restricted our analyses to Cluster 2, the only cluster significantly related to HAM-D changes. Because of the limitations in power imposed by our sample size, we consider the mediator/moderator analyses to be preliminary.
We tested the hypothesis that IL-8 may have served as a mediator with a standard mediation approach (Baron & Kenny, Reference Baron and Kenny1986). First, we found a significant relationship between volumetric change in Cluster 2 and HAM-D change, as we described above. Second, we did not find a statistically significant relationship between Cluster 2 change and IL-8 change, r = 0.17, p = 0.54, which means mediation conditions were not satisfied. Nevertheless, we performed the third step of the mediation approach by performing regression analyses in which HAM-D change was predicted by Cluster 2 change and IL-8 change. The results of the regression analyses are provided in Table 4. The inclusion of IL-8 in the regression analysis did not affect the relationship between Cluster 2 and HAM-D. Thus, because there was no significant relationship between IL-8 and Cluster 2 change and IL-8 did not explain the relationship between HAM-D and Cluster 2 change, we did not find evidence that IL-8 met mediation criteria.
Table 4. Analyses of inflammation as a meditator of the relationship change in HAM-D scores and change in regional brain volume HAM-D change as dependent variable

All variables were corrected as described in the main text. Interaction terms were not significant and removed from the final regression equation.
Next, we tested whether IL-8 moderated the relationship between HAM-D and Cluster 2 change by performing a linear regression analysis in which HAM-D change was predicted by both IL-8 change and Cluster 2 change. The moderation test in this equation is the Cluster 2 × IL-8 interaction term, which failed to achieve statistical significance, thus providing no evidence that IL-8 moderated the relationship between Cluster 2 and HAM-D score.
Discussion
This study provides evidence of mechanisms of heterogeneity of depressive symptoms six months after the index ECT course. Decreased volume in one cluster, including the insula and caudate, was related to increased depressive symptoms after six months. Additionally, IL-8 levels inversely correlated with volumetric change and correlated with decreased depressive symptoms over the same period but did not mediate the relationship between brain volume and depression. Thus, after the index ECT course, brain plasticity and inflammation were independently related to depressive symptoms.
Our results extend previous findings by providing evidence of widespread volumetric decreases six months after the index ECT course. We demonstrated that volumetric decrease in the insula, parietal cortex, and inferior frontal gyrus was related to changes in depressive symptoms. Our findings of volume decrease in the temporal cortex, insula, and caudate volume six months after the index ECT course support results from a previous study (Gbyl et al., Reference Gbyl, Rostrup, Raghava, Carlsen, Schmidt, Lindberg and Videbech2019). Although the governing factors of volumetric changes six months after index ECT are unclear, our finding of relationships to depressive symptoms suggests that the neural changes were not arbitrary.
Structural brain changes are associated with recovery from depressive episodes in both bipolar (Brooks et al., Reference Brooks, Bonner, Rosen, Wang, Hoblyn, Hill and Ketter2009; Brooks, Foland-Ross, Thompson, & Altshuler, Reference Brooks, Foland-Ross, Thompson and Altshuler2011; Wise et al., Reference Wise, Radua, Via, Cardoner, Abe, Adams and Arnone2017) and major depressive disorders (Wise et al., Reference Wise, Radua, Via, Cardoner, Abe, Adams and Arnone2017; Yuksel et al., Reference Yuksel, Engelen, Schuster, Dietsche, Konrad, Jansen and Krug2018). There are widespread increases in brain volume after index ECT (Ousdal et al., Reference Ousdal, Argyelan, Narr, Abbott, Wade, Vandenbulcke and Gemric2020) and notable increases in hippocampal and amygdala volume (Brancati et al., Reference Brancati, Brekke, Bartsch, Evjenth Sorhaug, Ousdal, Hammar and Oltedal2021; Camilleri et al., Reference Camilleri, Hoffstaedter, Zavorotny, Zollner, Wolf, Thomann and Nickl-Jockschat2020; Joshi et al., Reference Joshi, Espinoza, Pirnia, Shi, Wang, Ayers and Narr2016; Oltedal et al., Reference Oltedal, Narr, Abbott, Anand, Argyelan, Bartsch and Dale2018; Ousdal et al., Reference Ousdal, Brancati, Kessler, Erchinger, Dale, Abbott and Oltedal2021; Sartorius et al., Reference Sartorius, Demirakca, Bohringer, Clemm von Hohenberg, Aksay, Bumb and Ende2016). Hippocampal volume increases are not consistently related to clinical improvement (Oltedal et al., Reference Oltedal, Narr, Abbott, Anand, Argyelan, Bartsch and Dale2018; Sartorius et al., Reference Sartorius, Demirakca, Bohringer, Clemm von Hohenberg, Aksay, Bumb and Ende2016, Reference Sartorius, Demirakca, Bohringer, Clemm von Hohenberg, Aksay, Bumb and Ende2019) though there is evidence that structural and functional connectivity of hippocampal circuits as measured by diffusion and functional MRI is related to ECT response (Kubicki et al., Reference Kubicki, Leaver, Vasavada, Njau, Wade, Joshi and Narr2019; Leaver et al., Reference Leaver, Vasavada, Joshi, Wade, Woods, Espinoza and Narr2019; Leaver et al., Reference Leaver, Vasavada, Kubicki, Wade, Loureiro, Hellemann and Narr2021).
Unlike previous work, we did not find evidence of decreased hippocampal volume six months after the index ECT course. Two studies reported hippocampal volume decreases after 6–36 months (Jehna et al., Reference Jehna, Wurm, Pinter, Vogel, Holl, Hofmann and Enzinger2021; Nordanskog, Larsson, Larsson, & Johanson, Reference Nordanskog, Larsson, Larsson and Johanson2014) and one did not (Brancati et al., Reference Brancati, Brekke, Bartsch, Evjenth Sorhaug, Ousdal, Hammar and Oltedal2021), though none reported relationships with depression outcome. While we did not find evidence of hippocampal volume decreases, there are several potential explanations for the variable findings. Previous studies used different methodologies, though ours was designed to maximize sensitivity to detect longitudinal volumetric change (Gaser, Dahnke, Kurth, Luders, & Initiative, Reference Gaser, Dahnke, Kurth, Luders and Initiative2021). Our sample was somewhat larger those in previous studies, so our study would likely be slightly more sensitive to detect hippocampal change. Under relaxed statistical significance criteria, there was a trend toward a reduction in hippocampal volume in our sample. Regardless, the evidence of relations between depression and structural changes highlights the potential significance of structural changes.
We found that increased levels of IL-8 corresponded to increased depression six months after the end of the index ECT course. This finding contrasts with our previous work, in which increased IL-8 levels after index ECT were associated with better response in females (Kruse et al., Reference Kruse, Olmstead, Hellemann, Breen, Tye, Brooks and Irwin2021). Further, we found that higher levels of IL-8 mitigated the risk of depressed mood in response to an inflammatory challenge (Kruse et al., Reference Kruse, Boyle, Olmstead, Breen, Tye, Eisenberger and Irwin2022), and higher levels of IL-8 predicted a reduced risk of incident major depressive (Irwin, Olmstead, Kruse, Breen, & Haque, Reference Irwin, Olmstead, Kruse, Breen and Haque2022). In a subsequent comparison in this study, we observed that the relationship between IL-8 levels and depressive symptoms was stronger in males than in females, though our sample size did not allow for statistical inference.
Our study focused on IL-8 levels six months after the index ECT series, but it is interesting that immediately after the index series, others reported increased IL-8 CSF levels (Mindt, Neumaier, Hoyer, Sartorius, & Kranaster, Reference Mindt, Neumaier, Hoyer, Sartorius and Kranaster2020). We cannot determine the reason for such differences from our data, though index ECT, with frequent, repeated seizures, may stimulate IL-8 to provide neuroprotective properties. Subsequently, in the absence of repeated seizure activity, a pattern closer to that observed in animal models may prevail in which increased IL-8 levels are associated with decreased gray matter volume (Thirumangalakudi, Yin, Rao, & Grammas, Reference Thirumangalakudi, Yin, Rao and Grammas2007). In essence, index ECT may lead to inflammatory neurotrophic effects that are subsequently down-regulated (Cavaleri & Bartoli, Reference Cavaleri and Bartoli2022). A greater understanding of the relationship between inflammation and depressive symptoms after the index ECT course requires a larger sample and more detailed analyses, which we are exploring in future studies.
Although mean depression scores did not change between the end of index ECT course and follow-up, there was substantial individual variability. The individual variations in volume and inflammation were related to changes in depressive symptoms. Our sample size does not permit us to characterize subgroups of patients, but our findings of individual differences in the relationships between depressive symptoms, brain volume, and inflammation suggest that subgroups exist. The independent relationships between individual differences in depressive symptoms and brain plasticity and inflammation highlight the importance of individual differences in detecting underlying depressive mechanisms. Our longitudinal findings suggest that the perturbations of depressive mechanisms after the index ECT course may dissipate over six months.
Conclusions and limitations
Our study has several limitations that affect generalizability. The absence of a control group means we cannot conclude that the observed changes in gray matter volume were not attributable to extraneous factors. Although we cannot exclude time-related changes as a contributor to decreases in gray matter volume, previous studies did not observe changes in gray matter volume or thickness in healthy controls subjects scanned twice during a period comparable to the index ECT course (Jehna et al., Reference Jehna, Wurm, Pinter, Vogel, Holl, Hofmann and Enzinger2021; Joshi et al., Reference Joshi, Espinoza, Pirnia, Shi, Wang, Ayers and Narr2016; Pirnia et al., Reference Pirnia, Joshi, Leaver, Vasavada, Njau, Woods and Narr2016). We had sufficient power to detect effects for several inflammatory markers, but our sample size may not have allowed us to detect differences or sex-related interactions in measures. Because our study was naturalistic, some participants resumed treatment with antidepressants as clinically indicated following ECT (Espinoza & Kellner, Reference Espinoza and Kellner2022; Gill & Kellner, Reference Gill and Kellner2019), and almost half had some maintenance ECT (Espinoza & Kellner, Reference Espinoza and Kellner2022). We cannot exclude the possibility that these treatments influenced our findings, even though some findings were reasonably robust. Finally, because this study was conducted in a clinical setting, ECT subjects were not randomly assigned to treatment, which may have induced selection bias.
Our findings highlight the complex nature of the relationship between structural brain plasticity and mood changes following the index ECT course. This study is the first to report the longitudinal relationships among mood, volumetric brain changes, and inflammation after the index ECT course. Specifically, we found that six months after the index ECT course, volumetric changes in a cluster of brain regions, including the insula, were related to worsening mood and increased levels of serum IL-8. Volumetric and inflammatory measures were independently related to changes in mood, which suggests potential avenues of exploration for enhancing longer-term ECT efficacy.
Supplementary material
The supplementary material for this article can be found at https://doi.org/10.1017/S0033291722003555
Financial support
This work was funded in part by NIMH R03-MH110877 (JB); K23MH116127 (JK); R01MH092301, K24MH102743, U01-MH110008 (KN, RE); R01AG034588; R01AG026364; R01CA160245-01; R01CA119159; R01HL095799; R01DA032922 (MI).
Conflict of interest
None.
Ethical standards
The authors assert that all procedures contributing to this work comply with the ethical standards of the relevant national and institutional committees on human experimentation and with the Helsinki Declaration of 1975, as revised in 2008.


