


The movement for greater recognition of gender diversity has taken a prominent role in recent American politics but is not limited to the US political arena. Activists also have called for social surveys to be more sensitive to individuals who do not identify as male or female (Westbrook and Saperstein Reference Westbrook and Saperstein2015). In response, some important general-population surveys have adopted a non-binary form of the gender question (Haider et al. Reference Haider, Schneider and Kodadek2017).
To our knowledge, however, no research exists on the consequences of using (or not) a non-binary gender question on surveys and censuses. Does using a binary or non-binary gender question induce discomfort, increase satisfaction, or have no effect on survey respondents? To answer this question, we designed an electronic (i.e., web-based) survey experiment that was administered in three countries: the United States, Canada, and Sweden. Respondents randomly received a penultimate binary or a non-binary question about their gender, followed immediately by asking them to rate the survey from “very bad” to “very good.” We expected—based on the priming of preestablished political values—that those offended or dissatisfied with the form of the gender question to rate the survey more negatively and those who approve of the question form to give higher scores. The findings demonstrated no overall difference, in terms of survey evaluation, between the two types of gender questions—other than two exceptions that demonstrated more positive evaluations to surveys with the non-binary question: voters of non-major parties in the United States and voters of the Feminist Initiative (FI) in Sweden.
We conclude that general-population surveys could use a non-binary question without facing significant adverse reactions from respondents because we found no evidence of negative reactions to the non-binary gender question. We also argue that censuses should adopt this form of the gender question to collect important data on this small but vulnerable minority group.
DEVELOPMENT OF THE NON-BINARY DEBATE
The debate on non-binary gender entered the political arena after 2010. LGBTQ activists and academics, including legal and public-health scholars, pushed lawmakers to redefine gender in a non-binary and less-rigid manner (Westbrook and Saperstein Reference Westbrook and Saperstein2015). These efforts resulted in some success. For instance, in Canada, the federal government and a few provincial governments—notably Ontario and Quebec—made it easier to change an individual’s gender and are moving toward gender-neutral identification documents. In Sweden, activists sought to introduce a third gender-neutral pronoun to the Swedish language (Milles Reference Milles2011). This term—“hen,” an alternative to “han” (he) and “hon” (she)—has been adopted for use in Swedish government documents and the news media.
Despite the proliferation of non-binary gender categories on social media, few major surveys and censuses use non-binary gender questions outside the health and medical fields, although some social scientists have argued that it would improve the precision of sex/gender questions (Westbrook and Saperstein Reference Westbrook and Saperstein2015).
Treating gender as a non-binary category has received limited attention in survey research and quantitatively oriented social sciences (Bittner and Goodyear-Grant Reference Bittner and Goodyear-Grant2017). Changing gender-classification questions creates potential difficulties for historical comparisons. Moreover, so few respondents in general-population surveys would choose an option other than male or female that a non-binary classification is unlikely to produce enough responses for statistically meaningful analysis.Footnote 1 Hence, for quantitative scholars, the non-binary option seems to introduce potential problems while offering no tangible benefits. That assumption, however, is not necessarily true in more specialized surveys, such as those concerning health care.Footnote 2
Despite the proliferation of non-binary gender categories on social media, few major surveys or censuses use non-binary gender questions outside the health and medical fields, although some social scientists have argued that it would improve the precision of sex/gender questions (Westbrook and Saperstein Reference Westbrook and Saperstein2015).Footnote 3 The Canadian Election Study and the Swedish National Election Study retain the binary (i.e., male, female) question form. Similarly, the most recent Swedish, US, and Canadian censuses used a binary (i.e., male, female) question.
However, we found three important exceptions to this pattern. Most recently, the 2018 General Social Survey in the United States (administered by the National Opinion Research Center) replaced its binary gender question (used since 1972) with a two-step non-binary sex/gender question.Footnote 4 The major exception for political scientists is the American National Election Survey (ANES), which included a non-binary option (i.e., male, female, other) for self-identified gender for the first time in its 2016 Time Series Study. Yet, it retained the binary option for observer-reported gender in its face-to-face interviews (i.e., male, female, don’t know); this may have been to avoid interviewers asking an awkward question if a respondent’s gender was not apparent to them. The non-binary question form was not part of the ANES 2016 pilot study administered in January of that year and, according to ANES staff members, the use of a non-binary question was implemented to better reflect “evolving community standards,” to enable statistical analysis of the “other” category, and to avoid alienating potential respondents.Footnote 5
This situation is similar to surveys administered by the Society Opinion Media (SOM) Institute, a research organization at the University of Gothenburg. In 2013, it implemented a non-binary category in its questionnaires. This decision was made due to students protesting the binary gender question (after being asked to participate in a student survey administered by the SOM Institute). As a consequence, the Institute decided to include an “Other” option to its gender question accompanied by a free text response.
In both the ANES and SOM cases, the changes apparently were made without any tests to verify the possible consequences of changing the gender question from its traditionally binary form to a non-binary version. The SOM Institute confirmed that the changes were made without pilot testing.Footnote 6 It clearly responded to protests from student respondents and in a context in which non-binary concepts of gender were being discussed in national politics. The motivation of the ANES researchers is less clear but occurred when gender identity was at the forefront of political debate in the United States. Regardless of the normative value of a non-binary option, the change calls for a rigorous examination of its potential effects.
Prior research demonstrated that priming can access—often quasi-automatically—preestablished political values (Burdein et al. Reference Burdein, Lodge and Taber2006; Lodge and Taber Reference Lodge and Taber2005). Research on racial identity, for example, has shown that priming activates preestablished political attitudes (Valentino et al. Reference Valentino, Hutchings and White2002). In this study, we applied priming to gender to determine whether exposure to a non-binary question incites a reaction from respondents, especially from those who hold a preestablished negative view of a “non-binary–gendered world.” Thus, our key question was: Does a binary or non-binary gender question have a measurable impact on survey responses?
DATA AND RESULTS
To evaluate the effect of binary/non-binary gender categories, we conducted an electronic (i.e., web-based) survey experiment administered to nationally representative samples—based on sociodemographic quotas—in the United States, Canada, and Sweden.
In the United States and Canada, approximately 1,000 respondents were surveyed in each country by the firm Survey Sampling International from July 29 to August 8, 2016. In Sweden, the survey was administered between December 9, 2016, and January 4, 2017, to 1,200 respondents by the LORE Institute at the University of Gothenburg.Footnote 7
Essentially, if a binary gender question contradicts a progressive idea of gender, we believe that such attitudes will be primed and the gender question should elicit a negative reaction. Conversely, if a non-binary gender question offends a conservative view of gender, we would expect a more negative evaluation.
Respondents randomly received a binary question asking if they were male or female or a non-binary question with a third option, “other.” The gender question was the penultimate question on all surveys and was followed immediately by asking respondents to rate their satisfaction with the survey. This was done to maximize the potential impact of the gender question and to limit the possible influence of other questions (see Fournier et al. Reference Fournier, Turgeon, Blais, Everitt, Gidengil and Nevitte2011). The surveys also asked a standard suite of sociodemographic and political-orientation questions.
We believe that presenting individuals with a binary or non-binary form of gender may activate their attitude on gender diversity. Essentially, if a binary gender question contradicts a progressive idea of gender, we believe that such attitudes will be primed and the gender question should elicit a negative reaction. Conversely, if a non-binary gender question offends a conservative view of gender, we would expect a more negative evaluation. To measure the reaction associated with the type of gender categories used, we utilized a survey-evaluation question, following the methods developed and validated by the LORE Institute. In the three countries, the final question asked respondents to assess the survey on a scale ranging from “very bad” (0) to “very good” (100). Thus, any positive or negative reaction stimulated by the type of gender question should be measured through the survey-evaluation question. This experimental framework, including the measurement of respondents’ reactions, is similar to one used by Öhberg and Medeiros (Reference Öhberg and Medeiros2017) in a study exploring the reaction to respondents being asked (or not) about their ethnic background.Footnote 8 We converted the survey-evaluation variable to a 0-to-1 scale for the analyses.
Figure 1 shows the mean difference for survey evaluation between the groups that received the binary and the non-binary gender question for the three countries. The results do not indicate a statistical difference between both groups of subjects for any of the countries.
Figure 1 Overall Mean Differences per Country
Bars represent confidence intervals at the 84% level, corresponding to p<0.05 (MacGregor-Fors and Payton Reference MacGregor-Fors and Payton2013).
Although these initial results appear to demonstrate that neither type of gender question provokes a discernable reaction from respondents, these aggregate analyses may obscure impacts within subgroups. Inter-individual heterogeneity has become a common factor in political-behavior research (Sniderman et al. Reference Sniderman, Brody and Tetlock1991; Miller and Krosnick Reference Miller and Krosnick2000). The literature shows that sociodemographic variables—such as gender, age, and education—and political preferences can influence attitudes toward social diversity (Lalonde et al. Reference Lalonde, Doan and Patterson2000; Ryan et al. Reference Ryan, Hunt, Weible, Peterson and Casas2007). We tested for possible moderating effects of gender, age, and education but did not find any significant and systematic effects between the two types of gender questions. Table 1 in the appendix provides the detailed model results.Footnote 9
We also conducted a series of analyses to test the effect of ideology and partisanship. Respondents in Sweden were asked to position themselves on a unidimensional left–right scale (i.e., 0 to 10). In the United States and Canada, ideological preference was assessed multidimensionally; respondents positioned themselves on two scales (both 0 to 100): (1) an economic-ideological dimension, from government intervention to free market; and (2) a social-ideological dimension, from progressive to conservative. Principal-component analysis showed that in both countries, these two ideological dimensions were part of a single factor; however, the Cronbach’s α score for the items was less than 0.7. We therefore predicted—after using varimax rotation to improve principal-component score loadings—the factor score with a regression scoring method.Footnote 10 The ideology variable was converted into a 0-to-1 scale in both cases.
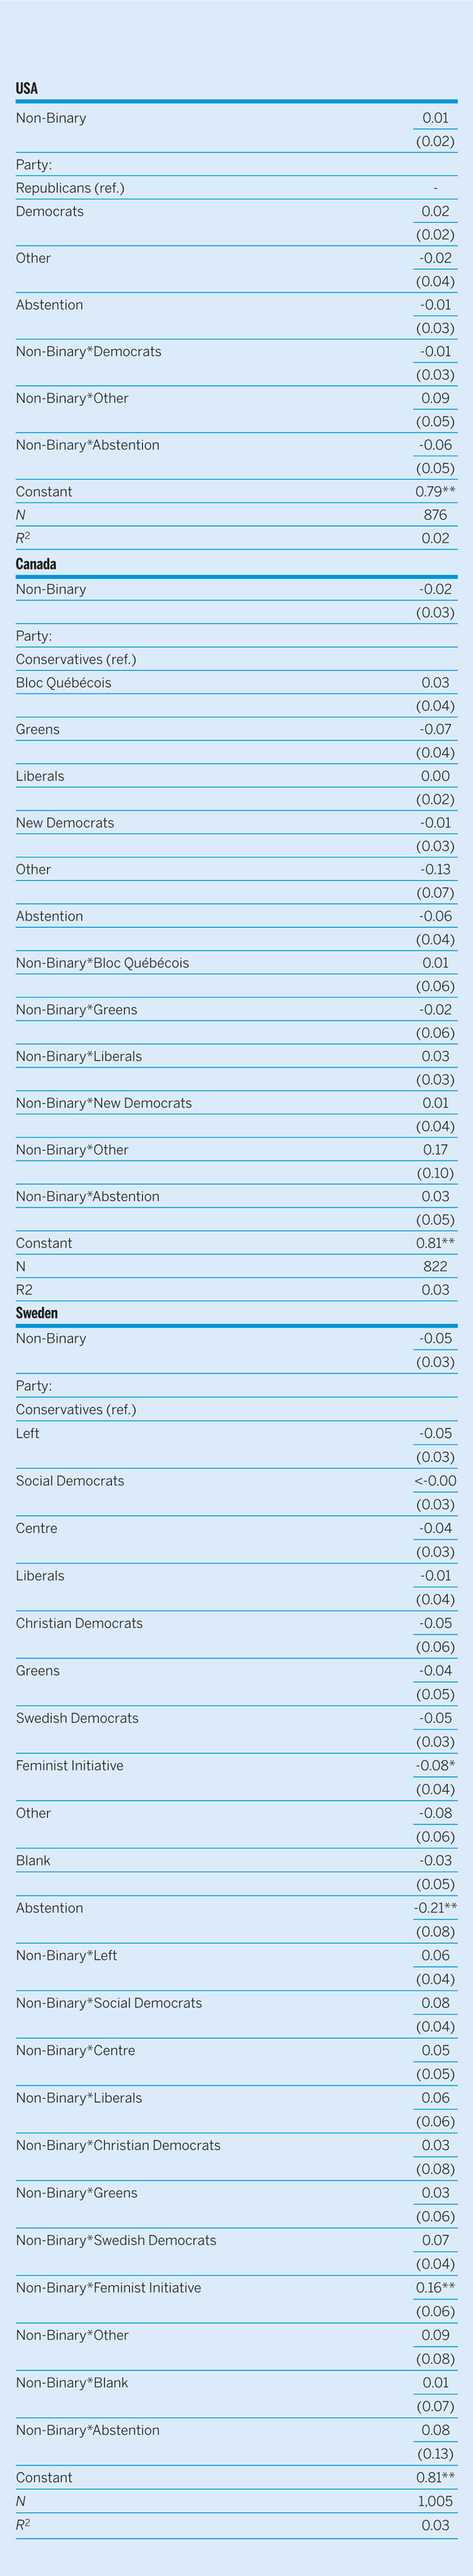
The results (see table 1 in the appendix), however, show no moderating effect of ideology on survey evaluation. To evaluate the effect of partisanship, we used vote intention (i.e., based on vote choice if elections were held on the day that the survey was taken).
The results, displayed in figure 2, vary by country. Table 2 in the appendix provides details of the analyses. In Canada, there was no significant moderating influence of vote intention for any of the parties on the survey evaluation. For the United States, there was a statistical difference among respondents who would vote for a party other than Democratic or Republican. The estimated marginal effects show that “Other” voters who received the non-binary question had a higher evaluation of the survey than “Other” voters who answered a binary version of the gender question. In Sweden, voters for the FI who received the non-binary question showed a higher evaluation of the survey than partisan counterparts who were exposed to the binary form of the question.Footnote 11 These voters also had the most negative survey evaluation for subjects who received the binary question (except for abstainers). In the administration of the 2014 Swedish Comparative Candidate Survey, candidates from this party had objected to the binary gender question that was used, with some even refusing to answer the survey for this reason.Footnote 12 Our results therefore support this expected preference for a non-binary form among FI partisans.
Whereas we strongly agree that non-binary questions can capture greater variation in identity and that such data have an important role in addressing inequality, we also argue that it is prudent to assess the effect of modifying survey questions—especially one so fundamental and ubiquitous as gender.

Figure 2 Vote Intentions and Survey Evaluation
Note: The markers represent predictive margins derived from OLS regressions. Confidence intervals are at the 84% level, which corresponds to p<0.05 (MacGregor-Fors and Payton Reference MacGregor-Fors and Payton2013).
DISCUSSION
The debate over gender categories has been framed in terms of both social justice and methodology: the use of a binary question for gender is characterized as erasing “important dimensions of variation and likely limits understanding of the processes that perpetuate social inequality” (Westbrook and Saperstein Reference Westbrook and Saperstein2015, 534). Whereas we strongly agree that non-binary questions can capture greater variation in identity and that such data have an important role in addressing inequality, we also argue that it is prudent to assess the effect of modifying survey questions—especially one so fundamental and ubiquitous as gender. Indeed, assessing the impact of question change is fundamental to survey design, even when the change creates a more accurate measure (as with the non-binary gender question). A substantial difference in reactions to the two question forms could significantly alter survey results and/or participation rates. Our results did not identify any adverse reaction to a non-binary question, so we conclude that researchers do not risk adverse effects if they use a more accurate measure of gender. We believe that the absence of a significant difference between the two types of questions—and especially the absence of a negative response—supports the use of the non-binary form.
For censuses, the use of a non-binary gender question is straightforward: although sexual minorities comprise a small proportion of the general population, they face important social challenges that require accurate data to address them (Westbrook and Saperstein Reference Westbrook and Saperstein2015). In contrast, the extremely small number of non-binary respondents means, however, that the choice of a binary or a non-binary gender question on general-population surveys does not matter methodologically. As the history of census categories shows, however, the terms used to classify national populations are unavoidably political (Thompson Reference Thompson2016). This observation can be interpreted two ways. First, the adoption of a non-binary gender category could provoke a response that would politicize reactions to the question. In that sense, the response of the FI voters constitutes a cautionary lesson: partisans will respond when the binary versus non-binary question is an explicit political issue. Given the advantages of the non-binary question, scholars should be prepared to make a positive public case for it.
Second, the histories of censuses show that the classification of even ostensibly “natural” categories (e.g., race) evolve substantially over time. The same is arguably true for gender. The use of a non-binary gender question conveys the acceptance of the non-binary concept of gender to all respondents, not only the small number who are gender nonconforming. Insofar as this is a worthy political goal, our results support the use of non-binary forms even on general-population surveys. However, we have two caveats to this recommendation.
First, our findings should be generalizable to other Western as well as non-Western societies that traditionally have been relatively open to gender diversity (e.g., India and Thailand). However, we recommend further study to gauge the potential impact of a non-binary gender question in more culturally conservative societies. Likewise, politicians and activists may react differently than the general population to binary and non-binary questions. Therefore, further study on “politicized” groups also is warranted.
Second, in our experiment, the gender question was the penultimate one, whereas this question often is asked earlier in surveys and census instruments. It is possible that using a non-binary gender question will affect subsequent responses to related issues (e.g., women’s roles and transgender rights). Further research is required to assess these potential question-order effects.
ACKNOWLEDGMENTS
The authors acknowledge the funding provided by the Social Science and Humanities Research Council of Canada (Insight Grant #435-2013-1476) and the Centre for the Study of Democratic Citizenship. We also thank Henrik Ekengren Oscarsson and the SOM Research Institute for their valuable assistance. We are grateful to Juliet Johnson, Amanda Bittner, Natalie Oswin, and this journal’s anonymous referees for their advice and suggestions. Any remaining errors are our own.
APPENDIX
Table 1 Marginal Effects of Survey Evaluation
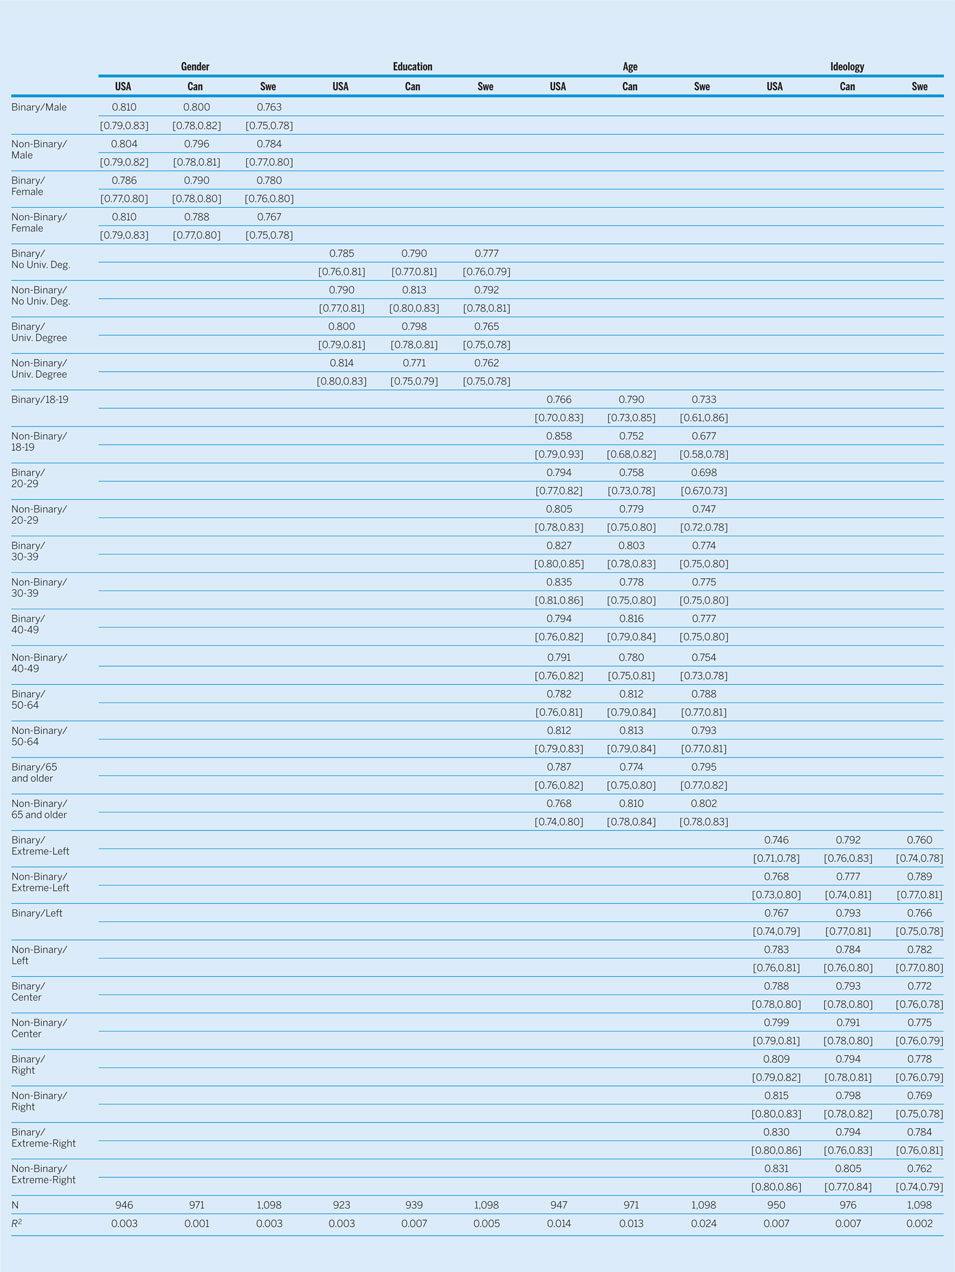
Table 2 Vote Intentions and Survey Evaluation


 Open access