


Whether or not dietary sugars, including fructose, exacerbate hepatic lipogenesis and non-alcoholic fatty liver disease (NAFLD) pathogenesis remains an unresolved question. Here, we quantitatively assess the early metabolic response to dietary sugars in oleic acid (OA) treated HepG2 cells, a ‘mixed nutrient’ model of NAFLD.
HepG2 cells were sub-cultured in medium containing physiological levels of glucose (5 mM, 5G), then treated with vehicle (V + 5G), 400μM oleic acid (OA + 5G) or OA with an additional 20 mM of monosaccharide as either glucose (OA + 25G) or fructose (OA + 5G + 20 F). Intracellular lipid was quantified at 0, 2, 4, 6 and 24 h time points. Nile red, a neutral lipophilic fluorescent dye, was used to measure total intracellular lipid and quantified either relative to vehicle or from an olive oil standard curve. Gas chromatography mass spectrometry (GC/MS) was used to measure intracellular lipid after Folch extraction with spiked internal standards. The extracted lipid was separated into fractions (i.e. diacylglycerol, DAG and triacylglycerol, TAG) by thin-layer chromatography before quantification of fatty acids (e.g. palmitic acid, 16:0 and oleic acid, 18:1n9) in each fraction. Data in figure 1 were statistically analysed by two-way ANOVA with Tukey's test post hoc.
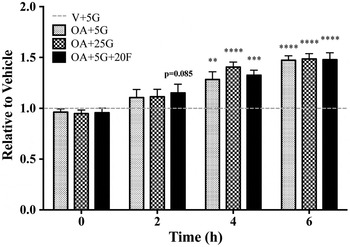
Fig. 1. Relative intracellular lipid at 24 h.
After a 24 h treatment with OA in 5 mM and 25 mM glucose, there was no difference in total intracellular lipid as detected by nile red. This held true when an olive oil standard curve was used (n = 4, data not shown). However, at earlier time points, the rate of lipid accumulation differed between treatments as detected by nile red (n = 4–5, statistical differences indicated as time point versus 0 h, Fig. 1). When assessed by quantitative GC/MS, initial results show a higher accumulation of TAG in OA + 25 G in comparison to OA + 5 G and OA + 5G + 20 F after 6 h of treatment; in particular, oleic acid in the TAG fraction (n = 1, Fig. 2). Interestingly, a higher amount of DAG was detected in OA + 5G + 20 F treated cells in comparison to OA + 25G; furthermore, higher amounts of palmitic acid, oleic acid and the de novo lipogenesis associated fatty acids, 16:1n7 and 18:1n7, were also detected (n = 1, Fig. 3).
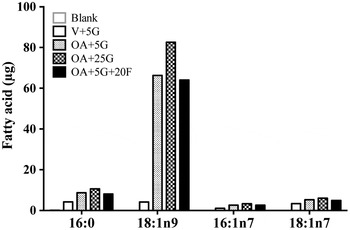
Fig. 2. TAG fraction at 6 h.

Fig. 3. DAG fraction at 6 h.
Data regarding a differential role for dietary sugars in liver fat accumulation and NAFLD pathogenesis is somewhat conflicted. A recent meta-analysis of human intervention trials shows no difference in the extent of fat accumulation in the liver from equimolar doses of fructose or glucose( Reference Chiu, Sievenpiper and de Souza 1 ). However, our data shows an initial increase in DAG synthesis in response to co-treatment with lipid and fructose; highlighting downstream signalling pathways fructose may modulate. Future studies will explore responses in the presence of insulin and monitor early signalling responses to fatty acids and sugars using proteomic approaches.


