


The UK market for ‘ready meals and main meal accompaniments’ was worth over £1·5 billion in the year up to January 2016(1). Ready meals have been characterised as ‘unhealthy’, being high in fat, saturated fat and salt(Reference Howard, Adams and White3–Reference Remnant and Adams4). Most ready meals are supermarket own-brand(2), and there are usually several ranges within each supermarket's ready meal offering, including a ‘healthy’ version of the standard product. A recent study that compared the nutrient profile of meals from the ‘luxury’, ‘standard’, ‘value’ and ‘healthy’ ranges found that the ‘healthy’ meals were more likely to be lower in energy, fat, saturated fat, and salt(Reference Remnant and Adams4). However, only six meal types were examined. The aim of this study was to compare the price, energy and nutrient content of ‘healthy’ range ready meals with their ‘standard’ equivalent.
Data available online from five UK supermarkets (Sainsbury's, Tesco, Waitrose, Asda, Morrisons) were collected during March 2016 for own-brand ‘healthy’ and ‘standard’ range chilled, one person, ready meals. The ‘healthy’ range(s) were identified first and then ready meals within the range were matched with a comparable meal from the supermarket's ‘standard’ range. If there was no comparable match the ‘healthy’ product was not included. Information on energy, total and saturated fats, total carbohydrates and total sugars, fibre, protein and salt content per 100 g was collected, as were pack weight and price. The energy and nutrient content per pack was calculated; contributions to Reference Intakes (RI) were calculated as a percentage of the RIs. As variables were not normally distributed, medians (interquartile range, IQR) are reported and non-parametric statistical tests were conducted.
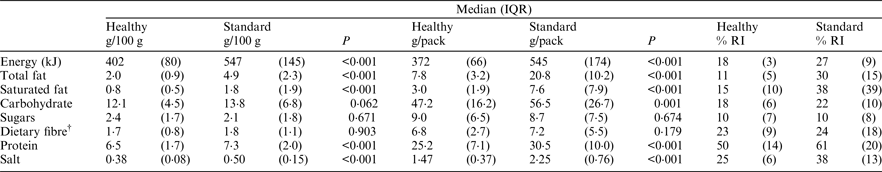
Included in the analysis were 180 ready meals. Pack weights ranged from 175 g to 500 g, with the ‘healthy’ range meals significantly lighter than the ‘standard’ meals [400 g (20 g) vs. 430 g (50 g), p < 0·001). Prices ranged from £2·00 to £3·90; there was a significant difference in price per pack [‘healthy’ £2·50 (£0·68) vs. ‘standard’ £2·50 (£0·70), p = 0·023; this difference was explained by the higher priced ‘healthy’ meals for Morrisons [£2·32 for all ‘healthy’ meals vs. £2·17 (£0·25) for ‘standard’, p = 0·039] and Waitrose [£3·30 (£0·80) vs. £2·50 (£0·75), p = 0·009). When price was expressed per 100 g, the ‘healthy’ meals were more expensive [£0·66 (£0·20) vs. £0·59 (£0·17), p < 0·001]. The ‘healthy’ range meals were lower than the ‘standard’ meals in energy, total and saturated fats, protein and salt, expressed as per 100 g and as per pack. Based on a ready meal contributing one third of daily energy and nutrient intake, when compared against one third of the relevant RIs, energy and nutrients were significantly different for both ranges (all p < 0·001).
†compared with the UK dietary reference value of 30 g/d.
In this study of a wide range of meal types, the ‘healthy’ range meals had a healthier nutrient profile than the equivalent ‘standard’ meals, although they were also more expensive (per 100 g). This may deter low income consumers from purchasing the healthier option(Reference Darmon and Drewnowski5).
