


Low vitamin D (vitD) status has been associated with impaired cognitive function and incidence of Alzheimer's disease and dementia( Reference Van der Schaft, Koek and Dijkstra 1 – Reference Aspell, Lawlor and O'Sullivan 2 ). However, vitD supplementation has not yet been tested on cognitive function in healthy older adults, free of cognitive impairment. It was hypothesised that those receiving vitD3 supplementation compared to placebo would show greater cognitive performance from baseline, after 6 mos( 3 ).
In a double-blind randomised placebo-controlled study (RCT) we assigned 60 healthy older adults, aged 60 years and older, without cognitive impairment (MMSE <23 or related disease) and with measured serum vitD <125 nmol/l, to receive either 50ug/day of vitD3 or placebo. We determined serum 25(OH)D status and cognitive performance at baseline, 3 and 6 mos. Predefined primary outcomes included the validated global cognitive function measure, Montreal Cognitive Assessment (MoCA) and a comprehensive domain specific battery comprising measures of attention (Sustained Attention to response Task_Coefficient of Variation: SART_CoV) and executive function (Trails Making Task A&B, B-A: TMTA&B, B-A), which were analysed using an intention-to-treat statistical approach.
Mean age was 68·5years SD 4·9 and 53·3 % were female. In total, 18·3 % were deemed deficient at baseline according to Institute of Medicine guidelines( 4 ). There were no significant baseline differences between groups. A retention rate of 93·8 % was achieved. At 6 mos. 25(OH) D concentrations were significantly higher in those whom in the vitD3 group (51·8 to 76·7 nmol/L) compared to the placebo group (49·4 to 42·3) (Figure 1). VitD supplementation did not show effect on global cognitive function scores (Figure 2. MoCA; VitD3: 0·17 Placebo: 0·93) or domain specific tasks of executive function (TMTA; VitD3: 1·11 Placebo: −0·53, p = 0·346; TMTB; VitD3: 29·73 Placebo: 33·45, p = 0·51; Figure 3. TMTB-A; VitD3: −15·39 Placebo: −20·49) and attention (Figure 4. SART_CoV; VitD3: 0·13 Placebo: 0·1).
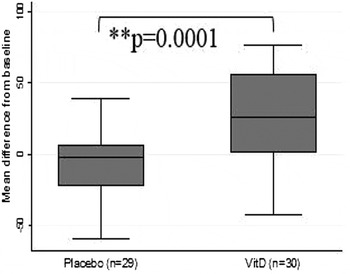
Fig. 1. Change in 25(OH)D (n mol/l) after 6mos
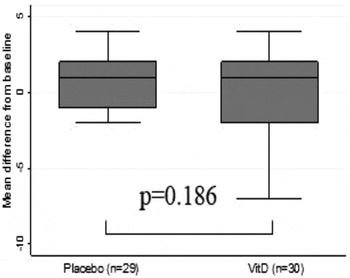
Fig. 2. Change in MoCA score after 6mos.

Fig. 3. Change in TMT B-A after 6mos.

Fig. 4. Change in SART_CoV after 6mos.
While this pilot study demonstrated that short term vitD3 intervention improved vitD status and that embedding a core cognitive outcome set, within the vitD RCT was feasible and acceptable, no short term changes in cognitive outcome measures were detected. This trial was registered at https://clinicaltrials.gov as NCT02804841.
N.A acknowledges PhD scholarship funding by the Irish Research Council.


