


Dietary reference values: concepts and terminology
Reference values for population nutrient intakes are the basis for making dietary recommendations that are consistent with good health. They are used for assessing and planning diets for individuals and groups and developing nutrition policies including food fortification. In the UK and Europe, they are collectively known as dietary reference values (DRV) and in the US/Canada, they are called dietary reference intakes. There are four main categories of values, for which different terms are used, depending on the body setting the DRV, and each category has a different application:
(a) Average requirement (AR)(1, 2), also called estimated average requirement(3, 4). This is the daily intake of a nutrient that meets the needs of 50 % of a healthy population, given a normal distribution of the requirement. It is the most important category for assessing the adequacy of nutrient intakes of a population group and for planning intervention strategies, such as food fortification.
(b) Population reference intake(1), also called the reference nutrient intake(2), RDA(3) and recommended nutrient intake(4). This is the daily intake of a nutrient that meets the needs of almost all healthy individuals, namely 97·5 % of the population, and is derived from the AR plus two sd. It can be used to plan the diets of individuals but not population groups. The precise sd is usually not known, and it is generally assumed to be 10–15 %.
(c) Adequate intake (AI)(1, 3) or safe intake(2). These values are derived as a last resort when data for estimating an AR are not available. The AI is the observed or experimentally determined average (median) intake in a group of apparently healthy people who are assumed to have an adequate status of the nutrient. The AI may well be higher than the actual requirements. When no population reference intake is available, the AI can be used as a guide to plan individuals’ diet. The use of AI for assessing the diets of individuals or population groups is limited.
(d) Upper level or tolerable upper intake level or upper tolerable nutrient intake(1, 3–5). These are maximum intake values for populations that if consumed chronically over time are judged unlikely to result in adverse effects; they do not apply to acute effects from high doses, e.g. supplements.
Attempts to harmonise DRV globally were initiated over 10 years ago(Reference King and Garza6) and a new umbrella term, nutrient reference value was proposed. In 2017, the National Academy of Science, Engineering and Medicine organised a workshop with WHO/FAO to discuss harmonisation of nutrient reference values(7). An ad-hoc NAS committee prepared a report on the harmonisation process, which includes case studies on iron and zinc(8).
The derivation of DRV requires quantitative information on the dietary requirements to prevent nutrient deficiency and maintain adequate body store or status. Where appropriate, prevention of chronic diet-related disease may also be taken into account, in which case intakes may be higher than those required to prevent deficiency. The most appropriate indicator for deriving the average nutrient requirement, which is ideally a biomarker for which a dose–response relationship has been shown, must be selected. When a nutrient does not have a useful biomarker, other approaches must be used to establish DRV, such as factorial modelling. This involves estimating physiological requirements for the absorbed nutrient and then converting this into dietary intakes using a conversion factor that takes into account bioavailability from the diet.
The definition of nutrient bioavailability is the percentage (or fraction) of total intake that is absorbed and utilised for normal body functions. Iron and zinc are two minerals that have varying (and sometimes low) bioavailability, depending on a number of dietary and host-related factors. Although isotopic labels can be used to directly measure iron bioavailability (namely utilisation) as the percentage of intake that is incorporated into Hb, this technique cannot be used to determine overall bioavailability from whole diets. Furthermore, there are no equivalent biomarkers of utilisation for zinc. Therefore, absorption is used as a surrogate measure of bioavailability for both iron and zinc and the two terms will be used interchangeably in this review.
Approaches used to derive dietary reference values for zinc
Estimating physiological requirements
In the absence of a suitable biomarker, dietary requirements for zinc have, in the past, been derived using the factorial approach. The European Micronutrient Recommendations Aligned (EURRECA) network undertook a series of systematic reviews, the aim of which was to develop an intake–status–health relationship model to inform the setting of DRV for zinc(Reference Lowe, Dykes and Skinner9). However, they were unable to recommend an alternative to the factorial approach as the potentially useful indicators of zinc status (plasma/serum zinc, hair zinc and urinary zinc excretion)(Reference Lowe, Medina and Stammers10) were not specific enough to characterise an intake–response relationship.
The factorial approach entails the estimation of the quantity of absorbed zinc required to replace endogenous losses of zinc. The majority of zinc lost from the body is intestinal (generally referred to as endogenous faecal zinc) and has been measured in conventional balance studies and with the use of radio- and stable isotope labels. Endogenous faecal zinc losses reflect the quantity of zinc absorbed, which is dependent on zinc intake. Non-intestinal losses include urine, dermal, menstrual (women) and semen (men). These are assumed to be constant over a wide range of zinc intake(3), with estimates ranging from 0·30 to 0·63 mg/d in men and 0·30 to 0·44 mg/d in women(Reference Gibson, King and Lowe11). Semen losses were estimated to be 0·10 mg/d(1, 3) and menstrual losses about 0·01 mg/d(1).
Estimates of total endogenous zinc losses reported by different bodies range from 1·40(4) to 3·84 mg/d(3) in adult men and 1·00(4) to 3·30 mg/d(3) in adult women. The low estimates from WHO were derived from studies in which the diets were very low in zinc. The US Institute of Medicine of the National Academy of Sciences used a linear regression approach to examine the relationship between endogenous faecal zinc and the quantity of zinc absorbed, which was then adjusted for non-intestinal losses of zinc in order to estimate total endogenous zinc losses(3). The European Food Safety Authority (EFSA) used multiple regression analysis and found that body size was the primary predictor of the quantity of zinc absorbed (when zinc balance is null), with no sex effect. An equation relating zinc physiological requirement to body weight was derived and zinc physiological requirements were estimated to be 3·20 mg/d in men (mean body weight 68·1 kg, based on measurements made in 16 500 European men aged 18–79 years) and 2·90 mg/d in women (mean body weight 58·5 kg, based on measurements made in 19 969 European women aged 18–79 years)(12).
Converting physiological requirements into dietary intakes
The AR is the quantity of dietary zinc that will supply the physiological needs (i.e. replace endogenous losses) of 50 % of the population. In order to convert requirements for absorbed zinc into dietary intakes, a correction for absorption has to be made. The efficiency of absorption depends on dietary composition, including zinc content and modifiers of absorption, and physiological needs. In particular, phytate (myo-inositol hexaphosphate), a phosphorus storage compound in plants, is a key determinant of zinc absorption. Values for dietary zinc absorption used by several bodies are summarised in Table 1.
Table 1. Absorption values used for zinc
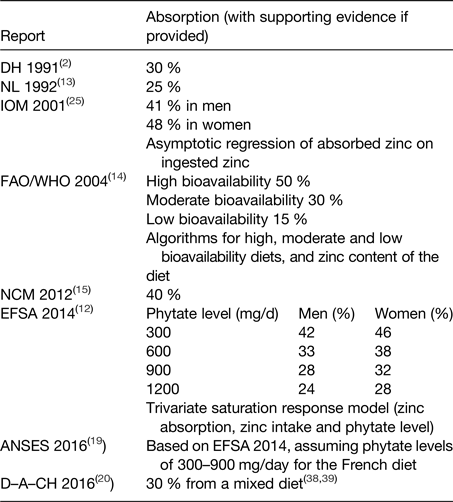
ANSES, French Agency for Food, Environmental and Occupational Health and Safety; D–A–CH, Deutschland–Austria–Confoederatio Helvetica; DH, UK Department of Health; EFSA, European Food Safety Authority; FAO, Food and Agriculture Organization; IOM, US Institute of Medicine of the National Academy of Sciences; NCM, Nordic Council of Ministers; NL, Health Council of the Netherlands.
The UK Department of Health assumed a value of 30 % for zinc absorption(2), and the Health Council of the Netherlands used 25 %(13). The US Institute of Medicine of the National Academy of Sciences(3) values were 41 % for men and 48 % for women, derived from a regression analysis using data from multiple studies on zinc absorption. However, many of the diets used in these studies were semi-purified and low in phytate, and it is likely that the inhibitory effect of phytate was underestimated.
FAO/WHO(14) estimated that 50 % of dietary zinc would be absorbed from highly refined diets. These were described as low in cereal fibre, low in phytic acid content, and with phytate–zinc molar ratio <5; adequate protein content principally from non-vegetable sources, such as meats and fish (high bioavailability). Absorption from moderate bioavailability diets was estimated to be 30 %; these diets contain animal or fish protein, and this category includes lacto-ovo, ovo-vegetarian, or vegan diets not based primarily on unrefined cereal grains or high-extraction-rate flours. The phytate–zinc molar ratio of the diet should be within the range 5–15, or not exceeding 10 if more than 50 % of the energy intake is accounted for by unfermented, unrefined cereal grains and flours and the diet is fortified with inorganic calcium salts (>1 g Ca2+/d). Absorption from low bioavailability diets was estimated to be 15 %. Such diets were described as high in unrefined, unfermented, and ungerminated cereal grain, especially when fortified with inorganic calcium salts and when the intake of animal protein is negligible. Low bioavailability was associated with diets where the phytate:zinc molar ratio of total diet exceeds 15, and high-phytate, soya-protein products constitute the primary protein source.
The Nordic Council of Ministers assumed an absorption of 40 % from a mixed animal and vegetable protein diet; this was the same as their previous report because they considered there were no new scientific data to justify changes(15).
There are several models for estimating zinc absorption at different levels of phytate intake. The International Zinc Nutrition Consultative Group model(Reference Brown, Rivera and Bhutta16) predicts that at phytate:zinc molar ratios of between 4 and 18, zinc absorption is 26 and 34 % in men and women, respectively, whereas, at ratios >18, absorption falls to 18 and 25 % in men and women, respectively. EFSA(12) calculated values for dietary zinc absorption at different levels of phytate (and zinc) intake using a refined trivariate model(Reference Miller, Krebs and Hambidge17) (Fig. 1). This model was based on the original one developed by Miller et al.(Reference Miller, Krebs and Hambidge18) and involved a careful and critical selection of individual values for zinc absorption from meals that were considered more representative of Western diets. The modifying effects of calcium, protein and iron were found to be insignificant and therefore were discounted in the final model(Reference Miller, Krebs and Hambidge17). Using this model, EFSA derived DRV for levels of phytate of 300, 600, 900 and 1200 mg/d (Fig. 1) which covers the usual mean/median intakes in different European countries although higher values may be found in certain countries.

Fig. 1. Refined trivariate model of dietary zinc absorption at different levels of phytate and zinc to derive dietary reference values for zinc at phytate levels of 300, 600, 900 and 1200 mg/d.
ANSES(19) endorsed the approach proposed by EFSA, whereas Deutschland–Austria–Confoederatio Helvetica cited references to support their selected value of 30 % from a mixed diet(20).
Approaches used to derive dietary reference values for iron
Estimating physiological requirements
There are no data on the relationship between iron intake and biomarkers of the physiological requirement that can be used to derive DRV, therefore the factorial approach has been used. Obligatory (sometimes referred to as basal or endogenous) losses of iron (e.g. dermal, epithelial, intestinal and urinary) were measured in three small groups of men in the 1960s using radioisotopes, with reported mean values ranging from 0·90 to 1·02 mg/d(Reference Green, Charlton and Seftel21). Based on these data, basal iron losses of 0·014 mg/kg body weight daily have been used by several bodies(3, 14, 15), to which estimates of menstrual iron losses had to be added in order to estimate the requirement for women of childbearing age. Using the same technique, a more recent study measured basal iron losses of 1·07 mg/d in men and 1·69–1·89 mg/d for pre-menopausal women(Reference Hunt, Zito and Johnson22). The results are summarised in Table 2. EFSA developed a regression model equation from the individual data on iron turnover and daily losses from the Hunt et al.(Reference Hunt, Zito and Johnson22) study in order to derive distributions for iron losses in men and women, from which percentiles could be estimated as the basis for determining AR and population reference intake values(23). For men, the 50th centile was 0·95 mg/d and for pre-menopausal women, it was 1·34 mg/d.
Table 2. Total obligatory iron losses measured using radioisotopes in adult men and women(Reference Green, Charlton and Seftel21, Reference Hunt, Zito and Johnson22)

* Pre-menopausal women, no hormonal contraceptives users.
† Geometric mean with −sd and + sd in brackets.
Converting physiological requirements into dietary intakes
The efficiency of iron absorption is determined by body iron requirements, which is related to body iron stores(Reference Hallberg, Hultén and Gramatkovski24) and the properties of the diet, i.e. iron content and the presence and quantity of enhancers and inhibitors of absorption(Reference Hurrell and Egli25, Reference Lynch, Pfeiffer and Georgieff26). When deriving DRV, physiological iron requirements need to be converted into dietary intakes by applying a bioavailability factor.
DRV setting bodies have used different values for the bioavailability factor, but they are not based on primary data for iron absorption from the whole diet over an extended period of time because this is very difficult to measure. A EURRECA systematic review of iron absorption from whole diets(Reference Collings, Harvey and Hooper27) identified nineteen pertinent studies from the USA, Europe and Mexico. Large variations in mean non-haem iron absorption, ranging from 0·7 to 22·9 %, were found between the studies, which were related to the iron status of the individuals.
Various algorithms have been developed to estimate iron absorption from the whole diet by taking into account the quantity of enhancers and inhibitors of iron absorption. The early algorithms used data from single meal studies in which iron absorption was measured by labelling the dietary iron with radio or stable isotopes(Reference Hallberg and Hulthén28), but single meal studies tend to exaggerate the effect of enhancers and inhibitors(Reference Cook, Dassenko and Lynch29). More recently, a diet-based algorithm was developed using iron absorption data from whole diets or several meals(Reference Armah, Carriquiry and Sullivan30). This algorithm was used to estimate absorption from the US diet, taking into account the mean intake of inhibitors (phytate and polyphenols) and enhancers (ascorbic acid), and the proportion of haem (10 %) and non-haem (90 %) iron(Reference Armah, Boy and Chen31) in the diet. Total dietary iron absorption was calculated to be 15·5 %.
Various values for dietary iron absorption (bioavailability) that are based on results from isotope absorption studies are used by different expert bodies charged with setting DRV (Table 3). Values range between 10 and 18 % for Western-type diets(2, 3, 13–15, 20, 23, 32).
Table 3. Bioavailability factors used to convert total absorbed iron into the dietary intake
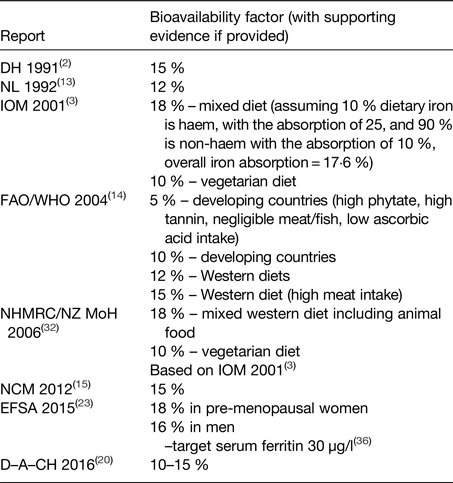
D–A–CH, Deutschland–Austria–Confoederatio Helvetica; DH, UK Department of Health; EFSA, European Food Safety Authority; FAO, Food and Agriculture Organization; IOM, US Institute of Medicine of the National Academy of Sciences; NCM, Nordic Council of Ministers; NHMRC, Australian National Health and Medical Research Council; NL, Health Council of the Netherlands; NZ MoH, New Zealand Ministry of Health.
The US Institute of Medicine of the National Academy of Sciences (2001)(3) considered that the maximum bioavailability of iron was 18 % in (non-pregnant, non-lactating) adults. This value was based on the assumption that 10 % of dietary iron intake was haem iron(Reference Raper, Rosenthal and Woteki33), with haem iron absorption being 25 %(Reference Hallberg34), and non-haem iron absorption being 16·8 % in individuals with a serum ferritin concentration of 15 µg/l(Reference Cook, Dassenko and Lynch29). With regard to iron losses, special consideration was given to the use of oral contraceptives and hormone replacement therapy, and also to vegetarianism, intestinal parasitic infection, blood donation, and increased iron losses in exercise and intense endurance training. The decrease in menstrual blood losses in women using oral contraceptives(Reference Nilsson and Solvell35) was taken into consideration, which gave an estimated reduction in losses of about 60 %. The iron bioavailability of a vegetarian diet was estimated to be about 10 % instead of 18 % for a mixed Western diet.
FAO/WHO(14) based their recommended nutrient intakes for women aged ≥19 years on the 95th percentile of the total requirements for absorbed iron (the average physiological requirement was assumed to be 1·46 mg/day). They proposed four different bioavailability figures: 15 and 12 % for Western-type diets, depending mainly on meat intake, and 10 and 5 % for developing countries.
EFSA employed values for dietary iron absorption that were derived using a novel approach developed by Dainty et al.(Reference Dainty, Berry and Lynch36). Total iron (haem and non-haem) absorption was predicted from a probability model, based on measures of iron intake and status in a representative group of men and women from the UK National Diet and Nutrition Survey. The model can provide estimates of total iron absorption from a mixed Western-style diet at any level of iron status. The EFSA panel selected a target value of 30 µg/l for serum ferritin concentration for men and premenopausal women, and at this level, the predicted iron absorption values were 16 and 18 %, respectively(23). Additional data from a nationally representative survey in Ireland and data collected in older people in the UK have subsequently been included in the model(Reference Fairweather-Tait, Jennings and Harvey37), and an interactive tool developed for estimating total dietary iron absorption in adult populations with a selected target serum ferritin concentration(Reference Fairweather-Tait, Jennings and Harvey37).
Conclusions
Accounting for the bioavailability of iron and zinc remains one of the most challenging aspects of setting DRV. It has been established that the dietary levels of phytate and zinc are the key determinants of zinc absorption in adults, but further studies are required to examine the relationship in other population groups, especially infants, children and pregnant women. Similarly, for iron, the model used to predict dietary absorption was derived from adult data, and further work is required to develop models for other population groups. The existing model for adults needs to be adapted for lower and middle-income countries, in which intakes of iron absorption inhibitors may be higher than Western diets and haem iron intakes may be lower. Good quality representative data for iron intake and status (serum ferritin, taking due account of the presence of infection/inflammation) could be used to evaluate the validity of the existing model. Alternative interactive tools for predicting dietary iron absorption could be based on the mathematical relationship between iron intake, iron status and iron requirements (all of which can be estimated with a reasonable degree of accuracy) since iron status is determined from the difference between physiological requirements and the quantity of dietary iron that is absorbed.
Financial Support
None.
Conflict of Interest
At the time of writing this review, S. F-T. was an appointed expert for the European Food Safety Authority Panel on Dietetic Products, Nutrition and Allergies (2009–2018) and the Working Group on DRV Minerals (2009–2015, vice-chair 2015–2018). She was also a member of an ad hoc Committee of the US National Academies of Sciences, Engineering and Medicine on the application of methodological approaches to global harmonisation of nutrient intake recommendations for young children and women of reproductive age (2017–2018). A. de S. is employed with EFSA in the Nutrition Unit that provides scientific and administrative support to the Panel on Dietetics Products, Nutrition and Allergies in the area of DRV for minerals. However, the present article is published under the sole responsibility of the authors and may not be considered as an EFSA scientific output. The positions and opinions presented in this article are those of the authors alone and do not necessarily represent the views or scientific work of EFSA.
Authorship
The authors are jointly responsible for all aspects of preparation of this paper.


