


Dietary reference values (DRV) are key concepts in the field of human nutrition. They provide the scientific basis on which nutrition recommendations are built, and risk-benefit analyses conducted(Reference Renwick, Flynn and Fletcher1). They are used in a variety of settings. Nutritionists and other health professionals may use DRV in the planning and designing of diets, and in the assessment of dietary adequacy for individuals and groups(Reference Beaton, Shils, Olson and Shike2,Reference Carriquiry3) . They are also important in the setting of food-based dietary guidelines, and are used by food manufacturers in food formulation and product labelling(4). They are not, however, designed to be used as targets for individuals, and this is probably the most important aspect of their misuse. This was an important consideration during the development of DRV in the UK(5).
Reference standards for intakes of food energy and nutrients have existed in the UK for over 40 years. In 1969, the Committee on Medical Aspects of Food Policy (COMA) established recommended intakes for nutrients; these were later revised and published as recommended dietary amounts in 1975. The recommended intakes and recommended dietary amounts had been set deliberately high so as to cover the needs of almost all of the UK population, those with high needs as well as those with lower needs. However, it became apparent that the reference values were being used inappropriately to scrutinise the diets of individuals, and were indeed being used as targets for individuals, and to make judgements about the dietary adequacy of individuals. In 1987, the chief medical officer instructed COMA to update values for dietary requirements and to consider how best to express them to reduce the likelihood of misuse. COMA established panels of experts to undertake this work, according to the specific expertise of panel members, and the updated reference values were published in 1991 as ‘Dietary Reference Values for Food Energy and Nutrients for the United Kingdom’, a seminal publication(5). The DRV set for micronutrients in 1991 are still in use today, with the exception of vitamin D, but important changes were made to how they were expressed, relative to the earlier values. There was a move away from a single value, to cover the needs of most of the population, to a number of values; this will be considered later. The term ‘reference’ was introduced and the term ‘recommended’ dropped, as this was considered to be a source of misunderstanding and misuse. It was also emphasised that the DRV were set for a healthy population and that requirements were normally distributed. This has a bearing on the type of literature that is admissible when considering evidence during a review of DRV. Importantly, it was also emphasised that the DRV are not meant to be used as an indication of an intake to treat disease.
Requirements for some nutrients differ between age groups and sex, and for pregnant and breastfeeding women, as a result of such factors as growth and nutrient absorption. DRV are therefore set according to age group, sex and physiological state; where data are not available for a particular age group, it may be necessary to either interpolate or extrapolate from data available in other age groups.
Normal distribution of requirements
In setting the 1991 DRV, a number of assumptions were made. First that nutrient requirements are normally distributed in a healthy population of a given age and sex. In fact, this is not always the case. A clear example is that for iron requirements in women of child-bearing age; women with high menstrual losses skew the distribution of requirements towards higher requirements(Reference Hallberg, Hogdahl and Nilsson6,Reference Hallberg and Rossander-Hulten7) . In order to take account of this, the COMA panel based the estimated average requirement (EAR) for women of reproductive age on the 75th percentile of menstrual blood losses(5). Other factors may skew the distribution of micronutrient requirements, including common polymorphisms in genes relevant to nutrient absorption or metabolism(Reference Molloy8). The assumption of normality is relevant to how available evidence can be used in the setting of DRV. Fig. 1 shows a normal distribution of requirements for a nutrient. EAR denotes the intake at the mid-point of the distribution curve; 50 % of the population have a higher requirement than the EAR, 50 % have a lower requirement. At the two extremes of the distribution are lower reference nutrient intake and reference nutrient intake (RNI), denoting intakes that will satisfy the needs of only 2⋅5 % of the population, or the needs of 97⋅5 %, almost all of the population, respectively. RNI is similar in concept to the earlier recommended intake and recommended dietary amount. The lower reference nutrient intake and RNI can be estimated as being EAR as sd 2 from the EAR, respectively. It is further assumed that there is a relationship between the intake and risk of deficiency or excess; the risk of deficiency diminishes as intake increases from lower reference nutrient intake to RNI. Additionally, consideration needs to be given to adverse effects associated with excessive intakes, which can be expressed as a safe upper level, reflecting an intake below which there is no significant risk of an adverse effect.
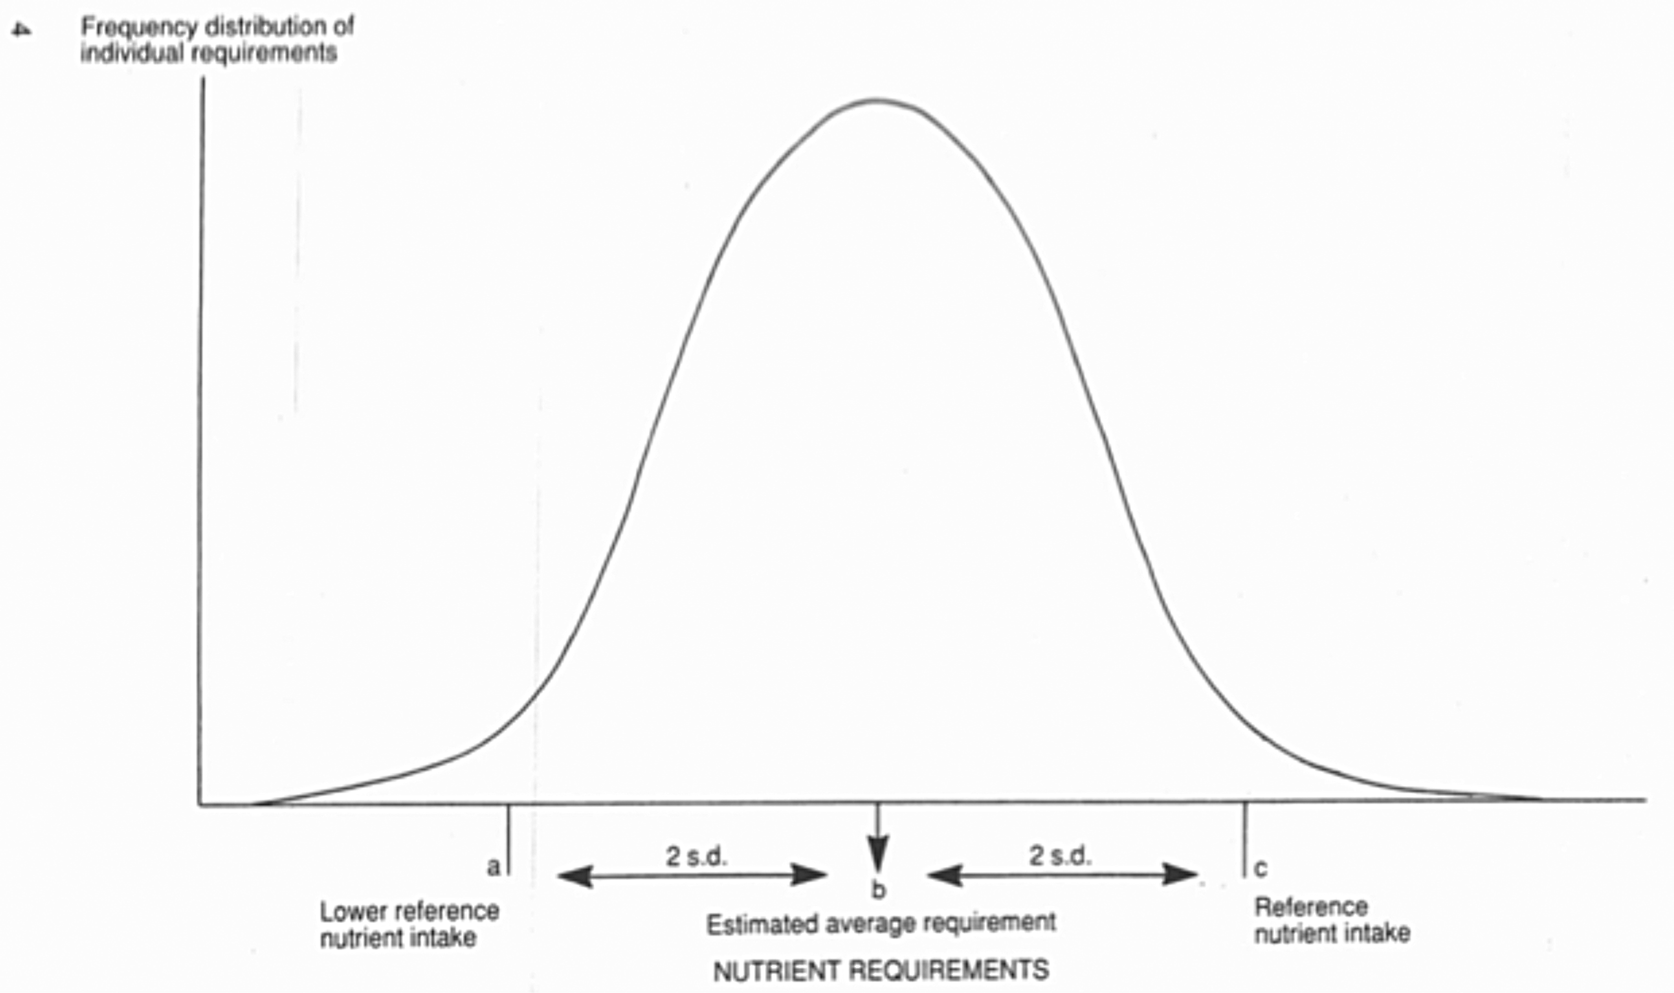
Fig. 1. Normal distribution of nutrient requirements, with definitions of dietary reference values(5). Figure reproduced from ‘Dietary Reference Values for Food Energy and Nutrients for the United Kingdom’, page 4. Reproduced under Open Government Licence v 3.0
Other bodies responsible for setting DRV use a similar approach, including an assumption about the normality of requirement distribution, although terminology differs. For instance, in place of RNI adopted by COMA in 1991, the European Food Safety Authority (EFSA) uses population reference intake; the Institute of Medicine, in the USA, uses RDA(9).
In setting DRV for one micronutrient, it is also assumed that the requirements of all other micronutrients are satisfied. Again this may have a bearing on what evidence is admissible when updating and reviewing DRV if the metabolism or absorption of one nutrient is influenced by the availability of another. For example, calcium absorption is dependent on the availability of vitamin D; homeostatic feedback loops maintain circulating calcium at the expense of bone calcium, operating via the effects of vitamin D metabolism. This interaction has implication for the estimation of calcium requirements(Reference Hunt and Johnson10).
Criteria of adequacy
DRV, and other expressions of dietary requirements, are set on the understanding of a causal relationship between the exposure (intake of the nutrient in question) and some criterion or criteria of adequacy, the outcome. Estimates of requirements for micronutrients are based on a diverse range of measures of adequacy, according to available evidence. Historically, estimates of nutrient requirements were generally based on preventing symptoms of deficiency, or of correcting symptoms of deficiency, sometimes from data arising from depletion/repletion studies. These studies were often carried out on a very small number of people, sometimes employing radioisotopes to observe nutrient metabolism(Reference Hodges, Hood and Canham11,Reference Wolf12) . Biochemical and metabolic criteria were also used. A consideration of metabolic and biochemical responses to a decrease in the body pool of a micronutrient may give some insight into the criteria of adequacy that can be used. As the body pool of a nutrient starts to decrease, usually when intake decreases, an early response that can be readily monitored is a fall in the blood concentration of that nutrient or a metabolite of the nutrient(Reference Levine, Conry-Cantelina and Wang13). Further depletion may impact the activity of a nutrient-dependent enzyme(Reference Bates, Powers and Downes14) or a biochemical pathway, sometimes leading to the accumulation of an intermediate(Reference Ulvik, Theofylaktopoulou and Midttun15,Reference Carmel16) . As depletion progresses, other changes may become evident including a measurable alteration in physiological function, such as grip strength or nerve conduction velocity(Reference Jin-Tak, Gyee Lee and Hyeon Yi17). Late-stage depletion will generally be evident as the appearance of clinical symptoms(Reference Golding18,Reference Glutsch, Hamm and Goebeler19) .
There are many other examples of biochemical and physiological responses to micronutrient depletion; some changes have proved useful as pre-clinical intermediate disease biomarkers, which have value in the process of identifying adequate micronutrient intake. Over the past few decades, findings from epidemiological studies linking the intake of micronutrients with the risk of chronic disease have contributed to discussions about nutrient adequacy. There has been increasing interest in the use of chronic disease endpoints in approaches used to set DRV(20,Reference Yetley, DeMets and Harlan21) . However, it has often proved difficult to fit sufficient good quality data from studies with chronic disease endpoints to existing EAR-based approaches to setting DRV. Risk of bias from various sources has been a particular problem(Reference Higgins, Altman and Gotzche22). Additionally, the relevance to the setting of DRV for the healthy population, of studies conducted in populations with chronic disease, is problematic. The availability of validated biomarkers for chronic disease can support the incorporation of chronic disease into the exposure endpoint model to set DRV.
The basis of the 1991 dietary reference values
The criteria on which the 1991 DRV were established are wide-ranging, depending on the nutrient in question. Some of the depletion/repletion experiments carried out in human subjects provided valuable information, but depletion experiments with clinical endpoints could be difficult to justify today. Monitoring of biochemical changes during graded repletion of subjects with sub-clinical deficiency is more readily justified however, and experiments of this type have provided insight into potential biomarkers for micronutrient adequacy(Reference Hill, Flatley and Barker23,Reference Caudill, Cruz and Gregory24) . For some micronutrients for which no specific clinical symptoms of deficiency are evident, an understanding of the biochemical functions has offered opportunities for identifying biomarkers of adequacy. Selenium is known to act as a cofactor for the antioxidant enzyme glutathione peroxidase and the whole blood activity of this enzyme is responsive to changes in selenium intake. Evidence of a plateau in activity at a blood concentration of 100 ug/l(Reference Thomson, Rea and Doesburg25) formed the rationale behind the 1991 DRV for this nutrient. The mean concentration of selenium in whole blood in the UK population at that time was above this threshold, and the RNI was set at an intake to achieve this(5). Vitamin B2, riboflavin, is a water-soluble vitamin. As early as 1950, Horwitt et al. (Reference Horwitt, Harvey and Hills26) showed that as intake increases, urinary excretion increases. This unpublished result was corroborated subsequently(Reference Brun, Chen and Campbell27), and an inflection in the intake/urinary concentration curve contributed to the 1991 setting of DRV for this vitamin. As for some other nutrients, a factorial approach was used to estimate iron requirements, based on the estimates of obligatory losses, menstrual losses and tissue accretion and a consideration of percentage iron absorption. COMA used an estimated 15 % absorption of dietary iron(5). The accuracy of the estimate of dietary absorption is central to the validity of the DRV for iron and given the factors that influence iron absorption(Reference Hurrell, Juillerat and Reddy28,Reference Minihane and Fairweather-Tait29) , there remains uncertainty in the accuracy of the estimate. A useful discussion of the limitations in the setting of DRV for iron is included in the Scientific Advisory Committee on Nutrition (SACN) iron and health report(30). The DRV set in 1991 are still in use today, with the exception of vitamin D.
Considerations when setting dietary reference values
Fig. 2 is an idealised scheme to illustrate the considerations that might be made when setting DRV. It proposes a relationship between dietary intake, health outcome and intermediate disease biomarkers that can inform the process of setting DRV, although it is often not possible to identify all the elements of the scheme. Primarily, the scheme supposes that there is a causal relation between dietary intake of a micronutrient and a known health outcome. It also proposes that changes in dietary intake influence preclinical or health indicators; the former may be referred to as intermediate biomarkers or intermediate disease endpoints. As referred to earlier in this paper, in the context of criteria of adequacy, as dietary intake changes, it may result in a readily observable and quantifiable change in the concentration of the nutrient or a metabolite of that nutrient, essentially reflecting change in the body pool. An example would be a fall in plasma concentration of ascorbic acid as dietary intake of vitamin C falls(Reference VanderJagt, Garry and Bhagavan31), or in a change in erythrocyte concentration of folates(Reference Duffy, Hoey and Hughes32) as dietary intake changes. For some micronutrients, biomarkers of functional change have been identified in response to changes in dietary intake. An example would be a decrease in serum concentration of methylmalonic acid in response to an increased dietary intake of vitamin B12(Reference Bolann, Solli and Schneede33). The relation between nutrient intake and body pool biomarker and between body pool biomarker and functional biomarker may not be a simple one. Factors (modulators) may interfere with either relation. Numerous factors influence the relationship between iron intake and concentration of iron in the plasma including dietary calcium and phytate(34,Reference Bach Kristensen, Tetens and Alstrup Jorgensen35) . Inflammation influences iron absorption and metabolism, and may act as a confounder of the relation between dietary iron and biomarkers of status or function(Reference Nemeth, Valore and Territo36). Polymorphisms in the folate metabolizing enzyme methylenetetrahydrofolate reductase influence folate metabolism and the relation between dietary folate and plasma 5-methyl tetrahydrofolate and plasma homocysteine(Reference Bailey and Gregory37,Reference Ashfield-Watt, Pullin and Whiting38) .

Fig. 2. (Colour online) An idealised scheme to illustrate the considerations that might be made when setting dietary reference values (DRV).
Notwithstanding their limitations, it is often possible to identify useful biomarkers that are related causally to both dietary intake and health outcomes, and in such instances, health outcomes can be linked with biomarker distribution or thresholds; quantification of the relation with nutrient intake informs DRV.
Exposure assessment, that is, quantification of the intake of individual nutrients, is subject to uncertainties and imprecision(Reference Bingham, Cassidy and Cole39). These are due in part to under and over-reporting of certain food groups, and inaccuracies in food composition tables(Reference Rennie, Coward and Jebb40), which contribute to the uncertainty about many DRV.
The SACN is an independent UK advisory body with a remit to assess risks and benefits of nutrients, dietary patterns, food or food components to health. Sometimes, this involves a review of DRV for food energy and nutrients. SACN may be prompted to review DRV for a micronutrient because of significant new or emerging evidence linking a micronutrient with a health outcome, or because of a new health concern, or as part of SACN regular horizon scanning of nutritional topics in need of attention. SACN conducts evidence reviews at the level of a full risk assessment or in the form of a commentary on the relation between a nutrient and health. A full risk assessment is subject to public consultation, may lead to new DRV which may lead to public health recommendations. When evaluating scientific evidence, SACN uses a framework of evidence to guide this process(41). SACN will sometimes conduct a scoping exercise to determine the need for a full review of a causal relation between a nutrient and health outcome. This may lead to an agreement to conduct a short review and will lead to the publication of a position statement. Position statements have been published on selenium and health, and iodine and health(42,43) but they were not full reviews. They did not lead to the setting of new DRV.
The only micronutrient for which there has been a full risk assessment, with a view to reviewing DRV, is vitamin D. In the late 1980s, COMA reviewed nutrient requirements DRV for food energy and nutrients. Vitamin D is obtained from UVB exposure as well as diet; COMA did not set a reference value for the UK population aged between 4 and 64 years as it assumed that sufficient vitamin D was available from cutaneous synthesis in the summer months. In 2007, SACN considered the need to review the DRV for vitamin D and concluded that there was insufficient new evidence to justify this. In 2010, SACN agreed that sufficient new evidence had accumulated to justify reconsidering the DRV for vitamin D. A working group was established with a remit to review the DRV for vitamin D and make recommendations.
A summary of the steps involved in the review of DRV for vitamin D will give some insight into the approach used by SACN(44). Vitamin D is unique among the vitamins in that it is the only vitamin for which the main source is not dietary; vitamin D is synthesised in the skin in the presence of UVB radiation (wavelength 280–315 nm)(Reference Holick, MacLaughlin and Clark45). This complicates the exercise for interpreting evidence and the setting of DRV for vitamin D but the general approach is not dissimilar from other micronutrients. The first step in the review process was to identify health outcomes that were considered potentially useful in the setting of DRV. A comprehensive list of health outcomes was considered; evidence for non-musculoskeletal health outcomes was deemed inadequate for the setting of DRV and these health outcomes were not considered further, whilst the evidence for musculoskeletal health outcomes was considered worthy of further consideration. The next step was to agree on the biomarker to be used as a marker of vitamin D exposure. The serum/plasma concentration of 25-hydroxyvitamin D (25(OH)D) was adopted, which is widely used as a biomarker of vitamin D status. The concentration of this compound in serum or plasma reflects exposure to vitamin D from diet and cutaneous synthesis. It has a long half-life in the circulation, relative to the parent compound, vitamin D or its functional metabolite 1,25(OH)2D, and is not subject to tight homeostatic control(Reference Viljakainen, Palssa and Karkkainen46,Reference Seamans and Cashman47) . The next step was to examine the literature to characterise the relationship between this biomarker and the musculoskeletal health outcomes of interest.
Most of the studies considered provided only mean or median serum 25(OH)D concentrations of participants so it was not possible to establish a range of serum 25(OH)D concentrations associated with the selected musculoskeletal health outcomes. If sufficient data had been available to define a distribution of serum 25(OH)D concentrations that related to identified musculoskeletal health outcomes, it might have been possible to identify an EAR and then, according to the 2 sd rule, an RNI and lower reference nutrient intake. A serum concentration of 25 nmol/l was identified as the concentration of 25(OH)D below which the risk of poor musculoskeletal health increased, at a population level. This was considered to represent a ‘population-protective’ concentration, in that it equates to the RNI, being a concentration considered adequate to cover the needs of the majority of the population, i.e. the concentration that 97⋅5 % of people should be above, throughout the year, in terms of protecting musculoskeletal health.
The next question to address was how the population could achieve this. Given the fact that vitamin D is made available through cutaneous synthesis and through diet, there were two modelling options available for attaining and maintaining the threshold serum concentration of 25(OH)D, that of summer sunshine exposure and that of vitamin D intake. It was not possible to quantify summer sunshine exposure required to attain and maintain the threshold serum 25(OH)D concentration in the general population because of the many factors that influence cutaneous synthesis(Reference MacLaughlin and Holick48–Reference Farrar, Webb and Kift50). The RNI was therefore derived by estimating the average intake of vitamin D to achieve a serum concentration of 25(OH)D of 25 nmol/l or more when cutaneous synthesis of vitamin D is minimal. Modelling relied on vitamin D dose–response data from randomised controlled trials conducted during winter at northern latitudes, when cutaneous synthesis can be assumed to be minimal(Reference Webb51). Regression and mathematical modelling at different levels of intake were carried out in studies that had been conducted in three population subgroups; adolescent girls and younger and older adults(Reference Cashman, Hill and Lucey52–Reference Cashman, Fitzgerald and Viljakainen54). Findings showed that the average daily intake of vitamin D required to maintain the concentration of serum 25(OH)D at or above 25 nmol/l in winter by the majority of the population was in the region of 10 μg/d. In the absence of data from other dose–response randomised controlled trials to show an age-dependent effect of vitamin D, data were extrapolated to younger age groups(Reference Madsen, Rasmussen and Andersen55). In total, 10 μg/d was set as the RNI for people aged 4 years and over. Safe intakes were set for infants and children aged under 4 years, for whom insufficient data were available to set an RNI. Safe intakes are based on a precautionary approach; they are ‘judged to be a level or range of intake at which there is no risk of deficiency, and below a level where there is a risk of undesirable effects’(5).
Although data from the National Diet and Nutrition Survey indicate that most people in the UK achieve a serum 25(OH)D concentration of 25 nmol/l or above during summer, a proportion of some population groups in the UK do not. For this reason, SACN proposed that the RNI should apply throughout the year. SACN made the following recommendation(44): Since it is difficult to achieve the RNI or safe intake, of 10 μg daily, from food, it is recommended that consideration is given to strategies for the UK population to achieve the proposed intakes.
Public Health England responded to the SACN recommendation with advice to the UK population that everyone should consider taking a daily supplement containing 10 μg vitamin D in autumn and winter. Public Health England gave further more specific advice to individuals and groups in the UK who may have little sunshine exposure, to consider taking 10 μg vitamin D daily all year round(56). During the COVID-19 pandemic of 2020, the UK Government responded to concerns that fewer people in the UK were able to spend time outdoors and that this may have a detrimental impact on the cutaneous synthesis of vitamin D. The NHS UK website(57) carried the following recommendation: You should take 10μg (400IU) vitamin D a day between October and early March, to keep your bones and muscles healthy.
Thus, in the context of vitamin D, we see an example of the three elements of risk analysis; risk assessment, risk management and risk communication(58).
European Food Safety Authority
Of course, there are many other bodies worldwide responsible for conducting reviews of DRV. EFSA is the European body responsible for giving scientific advice on nutrient intakes to EU risk managers and policy makers. In 2005, the European Commission asked EFSA to review and update the DRV for food energy and nutrients that had been established in 1993 by the Scientific Committee on Food. The EFSA Panel on Dietetic Products Nutrition and Allergies produced a scientific opinion on the general principles for deriving and applying DRV(9), which guided the subsequent deliberations. Over the following years, the EFSA Panel on Dietetic Products Nutrition and Allergies considered food energy and nutrients and published their findings and conclusions as scientific opinion papers. By 2019, EFSA had published thirty-five scientific opinions on water, energy, fats, carbohydrates, fibre and fourteen vitamins and fifteen minerals, an impressive output. A document is available which summarises the evidence used to arrive at each conclusion, as well as summarizing the DRV or equivalent that was in use at the time by other national and international bodies. It is an excellent resource(59). There is quite a significant variation in DRV set by different national and international bodies for micronutrients, as great as 50 % according to age and sex.
There has been a concern for some years about the disparity in terminology and in approaches to setting DRV between nations and international bodies, which some consider a barrier to scientific progress, to international labelling, and trade. There is a growing literature concerned with identifying and understanding the reasons for disparities. In 1995, the FAO/WHO convened a workshop to consider the elements of dietary guidelines, and promote the particular value of global food-based dietary guidelines, which reflect dietary patterns rather than numerical goals. The ensuing publication(60) included a description of the various terms in use to reflect dietary guidelines, which highlighted the diversity of terms in use worldwide. Differences persist in the terminology used by national and international bodies tasked with setting DRV. A qualitative analysis of stakeholder beliefs in dietary guidelines across Europe identified a need for greater clarity about the terminology used(Reference Brown, Timitijevic and Barnett61).
Notwithstanding the EFSA review of nutrient reference values and the publication of their updated values for the EU population(59), most countries in Europe set their own nutrient recommendations. Considerable heterogeneity exists between countries and it has proved difficult to establish with certainty what the main influences are that lead to disparities. Timotijevic et al. (Reference Timotijevic, Barnett and Brown62) conducted an analysis of influences on the setting of micronutrient recommendations across Europe. They collected data from thirty-five European countries regarding the types of bodies responsible for setting recommendations, the process of decision-making and communication with policy-makers. Their study showed a diversity of bodies and processes engaged with setting micronutrient recommendations, with a variety of levels of transparency of process, and of public reporting. The existence of a standing scientific advisory committee was associated with greater transparency in the decision-making process.
European and international bodies have collaborated to explore the value and feasibility of harmonisation of approaches to setting nutrient-based dietary guidelines(Reference King and Garza63). Consideration is being given to the need for a common framework to guide extraction, evaluation and judgement of evidence underpinning reference values. The European micronutrient recommendations aligned network of excellence (http://www.eurreca.org) was set up to consider a process for the re-evaluation and harmonisation of nutrient reference standards across Europe. Early work focused on developing standardised methodologies for reviewing nutrient reverence values looks promising(Reference Lambert and Ashwell64,Reference Matthys, Bucchini and Busstra65) . More recently, interest has revived not only in the mechanism whereby harmonisation of approaches might be reached, but to include the harmonisation of values themselves(Reference Allen, Carriquiry and Murphy66). There is debate about the desirability or feasibility of this. Although physiological determinants of nutrient requirements may not differ greatly across nations, cross-country differences in food availability, food practices and population lifestyle can influence decisions made within countries in the setting of nutrient reference values. There certainly seems to be a rationale for developing a common framework of evidence, and there is a need for greater transparency in approaches used for setting nutrient reference values.
In conclusion, it should now be evident that setting DRV can be complex and time-consuming, and the resulting DRV may have a high degree of uncertainty. There are quite large differences in approaches used by national and international bodies and significant variation in DRV between nations. There is a case for harmonizing approaches to setting DRV globally.
Acknowledgement
The author is grateful to the UK Nutrition Society for the opportunity to present at the Nutrition Society Winter meeting 2020, held virtually.
Financial Support
None.
Conflict of Interest
None.
Authorship
The author had sole responsibility for all aspects of preparation of this paper.


