


A central question in the study of political institutions is the extent to which voters can hold their representatives accountable. Early foundational research in political behavior—for example, Miller and Stokes (Reference Miller and Stokes1963)—questioned whether citizens possess sufficient political knowledge to be capable of sustaining accountability. Theories of political behavior that posit that voters do not meet this necessary condition for accountability remain highly influential (Achen and Bartels, Reference Achen and Bartels2016).
At the same time, a spate of recent “revisionist” studies have examined how well American citizens understand how their representatives vote on high-profile roll calls, and whether they respond rationally to those votes in their assessments of their representatives (Jessee, Reference Jessee2009; Ansolabehere and Jones, Reference Ansolabehere and Jones2010; Shor and Rogowski, Reference Shor and Rogowski2018; Clinton et al., Reference Clinton, Sances and Sullivan2019; Ansolabehere and Kuriwaki, Reference Ansolabehere and Kuriwaki2021). This new strand of research challenges the traditional view by arguing that voters can generally follow how their representatives vote and can use that information in an intelligent manner. This picture is not completely rosy, from a utopian perspective of democratic theory. But, all in all, a degree of accountability does seem quite plausible.
In this paper we apply this new framework to the study of United States senators’ voting on Supreme Court nominees. The fact that every Supreme Court vacancy in modern American politics becomes an instantaneous political fight means that votes on nominees are some of the most visible votes that senators will cast. We know that senators tend to follow their home states’ public opinion on nominees (Kastellec et al., Reference Kastellec, Lax and Phillips2010)—especially the opinion of their co-partisan constituents (Kastellec et al., Reference Kastellec, Lax, Malecki and Phillips2015). This connection between opinion and votes suggests a second path between voters and senators, in which voters both monitor their senators’ votes on Supreme Court nominees, and reward or punish their senators based on whether their roll call votes on a given nominee accord with voters’ preferences—for or against—a particular nominee. Yet, while there are theoretical reasons to suspect this second path exists, the evidence for it remains rather limited.
We present systematic and direct evidence that shows that voters hold senators accountable for their votes on Supreme Court nominees—at least in the 21st century. In particular, we use survey data from the nominations of Clarence Thomas (1991), Sonia Sotomayor (2009), and Elena Kagan (2010)—data that are particularly well suited to study electoral accountability. Using these data, we test whether voters, on average, can correctly recall the votes of their senators on nominees, and whether correct recall is correlated with higher levels of education and political knowledge. Next, we test whether voters use this information to update their assessments of their senators—is a voter more likely to approve of her senators if the voter perceives that a senator casts a vote on a nominee that aligns with the voter's preferences?
The results differ across the nominations of Thomas versus Sotomayor and Kagan. For Thomas, we find mixed evidence for accountability, as we can statistically answer only some of these questions in the affirmative.Footnote 1 Conversely, for Sotomayor and Kagan, we find strong evidence of accountability. Many voters can correctly recall their senators’ votes, this recall is correlated with higher levels of education and political knowledge, and voters’ assessments of their senators are driven by both actual and perceived agreement with how their senators voted on Sotomayor and Kagan. Establishing causality requires an instrumental variables (IV) approach, for which we extensively assess possible threats to identification.Footnote 2 Finally, we find that the impact of the Sotomayor and Kagan confirmation votes on citizen evaluation of senators was larger than that of other high-profile roll call votes taken at the same time, including the passage of the Affordable Care Act. These results have important implications for both the broader study of representation and for understanding the current politics of Supreme Court nominations.
1. The evolution of Supreme Court nominations and the prospects for accountability
Testing for democratic accountability is of course important across most issue areas, but Supreme Court nominations provide a particularly interesting laboratory for assessing accountability. Figure 1 depicts the proportion of “yea” votes that every nominee with a roll call vote on the floor of the Senate received from 1789 to 2020; we treat voice votes as unanimous support for the nominee. In the figure, we label nominees who received at least one “nay” vote. The figure shows that nominees in the late 18th century and early 19th century tended to receive high levels of support. The middle of the 19th century saw many failures and close calls, followed by a return to broad support around the turn of the 20th century. The middle of the 20th century is quite notable for its low levels of contentiousness. Indeed, the majority of votes in this period were voice votes, meaning that not a single senator felt that it was worth going on the record as opposing the nominee.

Fig. 1. Proportion of yea votes for Supreme Court nominees, 1789–2020. The figure excludes nominations that ended before the Senate acted on the nomination. We label nominees who received at least one nay vote. Nominees with voice votes are coded as having received 100 percent support. The (green) circles depict confirmed nominees, while the (red) diamonds depict nominees who were not confirmed.
Toward the end of the 20th century, nomination politics would shift decidedly. Even as the overall rate of confirmation has remained relatively high over the last few decades, Figure 1 shows that roll call votes on Supreme Court nominees have become increasingly contentious—particularly for nominees in the 21st century. No nominee this century has received more than 80 percent yea votes (John Roberts received 78 percent in 2005), and President Trump's three nominees (Gorsuch, Kavanaugh, and Barrett), who were confirmed on near party-line votes, received 55, 51, and 52 percent support, respectively.Footnote 3 Thus, it appears safe to conclude that we have entered a new and unprecedented era with respect to Senate voting on nominees—the levels of contentiousness now exceed those seen in the 19th century, and the modern era marks the first time that votes on Supreme Court nominees consistently proceed in a party-line manner.
Another way to quantify the shift in nomination politics is to look at the changing quantity of news coverage of Supreme Court nominees. Figure 2 depicts the number of articles in the New York Times and Los Angeles Times that feature reporting on a Supreme Court nominee for every nomination between 1930 and 2020.Footnote 4 The points show the number of stories for specific nominees, while the solid line depicts the time trend via a loess line. The figure shows a marked rise in total coverage starting around 1970 (the year after Clement Haynsworth was nominated by Richard Nixon and rejected by the Senate). This figure does not include either cable TV or Internet coverage of Supreme Court nominations, which of course did not exist in earlier eras but are now omnipresent in nomination politics. Thus, it is clear that Supreme Court nominations are now high-profile events that receive a great deal of media coverage. As such, voters are much more likely to be aware of nominations than they used to be; re-election minded senators, in turn, are likely to be aware that voters are more aware.

Fig. 2. Newspaper coverage of Supreme Court nominees, 1930–2020. The points depict the number of stories appearing in the New York Times and the Los Angeles Times for each nominee.
Finally, Figure 3 depicts the number of interest groups that mobilized in every Supreme Court nomination between 1930 and 2020. (This measure is also based on coverage in the New York Times and Los Angeles Times—see Cameron et al. (Reference Cameron, Gray, Kastellec and Park2020) for more details.) As with newspaper coverage, we see a sharp rise in interest group mobilization for Supreme Court nominations beginning around 1970. Although before 1970 interest group mobilization was relatively rare, it is now a mainstay of nomination politics, with groups on both sides immediately mobilizing to enter the fray whenever there is a vacancy on the Court.Footnote 5

Fig. 3. Interest group mobilization on Supreme Court nominees, 1930–2020. The points depict the number of unique groups mobilizing on each nominee, based on coverage in the New York Times and the Los Angeles Times.
How do these trends fit within the broader literature on democratic accountability? Consider what nominations looked like around the period when Miller and Stokes (Reference Miller and Stokes1963) established the conventional wisdom that most voters lack the knowledge and sophistication to hold their representatives accountable. In particular, consider the period of 1930–1970—and what nomination politics looked like from the perspective of senators for most nominations in this period. Based on existing research on nominations, we know the following. With some notable exceptions (such as labor groups during the nomination of John Parker), the small number of interest groups that existed in this period showed little appetite for getting involved in nomination politics (Scherer, Reference Scherer2005; Cameron et al., Reference Cameron, Gray, Kastellec and Park2020). In turn, the parties and presidents had relatively low interest in the policy outputs of the Court (Yalof, Reference Yalof2001; Cameron et al., Reference Cameron, Kastellec and Mattioli2019)—again, there were a few exceptions, such as Southern Democrats’ fury at the Court following Brown v. Board of Education (1954). As a result, most nominations were sleepy affairs. This sleepiness resulted in both relatively low levels of media coverage and almost no polling about nominees (Kastellec et al., Reference Kastellec, Lax and Phillips2010). While public opinion may have existed even in the absence of polling, it's clear that most nominations in this period were of relatively low salience for both elites and the masses.
Now consider this state of affairs from the perspective of either classic soft rational choice studies of Congress and the electoral connection (Mayhew, Reference Mayhew1974; Fenno, Reference Fenno1978; Arnold, Reference Arnold1990) or of formal rational choice models of political principal–agent relations (Ferejohn, Reference Ferejohn1986; Canes-Wrone et al., Reference Canes-Wrone, Herron and Shotts2001; Besley, Reference Besley2006; Ashworth and Bueno De Mesquita, Reference Ashworth and Bueno De Mesquita2014, inter alia). The latter are sometimes dubbed political accountability models; the former do not employ formal theories, but their underlying logic essentially rests on accountability.
Accountability models come in all types of flavors, but at their core they assume some sort of attentive audience, whether actual or potential. In other words, a political agent answers to a political principal who either pays attention or might conceivably pay attention to the agent's action and/or the consequences of this action. In Mayhew's (1974) classic account, the desire for re-election—that is, approval by an “audience of voters”—can explain a great deal of variation in the behavior of members of Congress. Arnold (Reference Arnold1990) extends this idea to include the concept of “potential preferences” among the audience of voters—preferences that members believe might arise in the future as a result of activation by interested parties (such as interest groups) or by future challengers searching for campaign issues.
Senators, of course, had re-election concerns in our “early period,” and certainly worried about taking positions that would displease their constituencies. But how exactly would this work with respect to Supreme Court nominations? Who exactly was the audience—real or potential? Before the explosion of interest groups and judicial activists in the 1970s and 1980s, no such audience existed for confirmation voting, except for the occasional highly salient nominee. A vote one way or the other for a Charles Whittaker, Stanley Reed, or Frank Murphy—who but the nominee knew? Who cared? Recall that the majority of votes in this period were voice votes, meaning that even if a particular voter took an interest in a confirmation vote, there would be no way to differentiate her senators’ votes from those of other senators.
Nomination politics would change, of course, beginning gradually in the late 1960s and then accelerating in recent decades. The number of interest groups who cared about the Court exploded. The Court made a number of decisions, such as Roe v. Wade (1973), that activated interest group and/or citizen interest in nomination politics. Coverage of nominations increased significantly, as did polling of citizens about nominees. Moreover, the nature of opinion holding shifted dramatically, with party polarization of views on Supreme Court nominees now a reliable fact of life (Kastellec et al., Reference Kastellec, Lax, Malecki and Phillips2015). As a result, an audience for nomination politics developed.
How has this shift changed the incentives of senators when voting on Supreme Court nominees? Both the rising stakes of Supreme Court appointments as well as the greater visibility of nomination fights mean that votes on Supreme Court nominees can be some of the most consequential roll call votes that senators cast. Recent research has established that senators tend to be in sync with the views of their constituents—particularly their partisan constituents—when voting on Supreme Court nominees (Kastellec et al., Reference Kastellec, Lax and Phillips2010, Reference Kastellec, Lax, Malecki and Phillips2015). This, in turn, implies that senators face the risk of being thrown out of office if they are in fact out of step with their constituents (Canes-Wrone et al., Reference Canes-Wrone, Brady and Cogan2002).
Indeed, we know from existing research that many Americans are both aware of and care about their senators’ votes on Supreme Court nominees (Hutchings, Reference Hutchings2001). For example, during the nomination of Samuel Alito in 2005 and early 2006, 75 percent of Americans thought it important that their senators vote “correctly” (Gibson and Caldeira, Reference Gibson and Caldeira2009). Moreover, we can point to concrete examples of the consequences for senators who ignore such concerns. Despite being virtually unknown, Carol Moseley Braun defeated incumbent Senator Alan Dixon in the Illinois Democratic primary of 1992, principally campaigning against his vote to confirm Clarence Thomas (McGrory, Reference McGrory1992).
In addition, a few studies have directly examined the link between senators’ votes on Supreme Court nominees and voters’ assessments of senators. Wolpert and Gimpel (Reference Wolpert and Gimpel1997) found that respondents’ vote choices in the 1992 Senate elections were influenced by correctly recalling whether their senators voted to confirm or reject Clarence Thomas in 1991. Hutchings (Reference Hutchings2001) examined the prior question of which type of citizens were more likely to correctly identify the direction of their senators’ votes on the Thomas nomination. More recently, Badas and Simas (Reference Badas and Simas2022) show that voters who agreed with their senators’ votes on the 2017 and 2018 nominations of Neil Gorsuch and Brett Kavanaugh, respectively, were more likely to vote in support of their senators.
Our work both complements and extends this existing research. Most importantly, we use the framework developed in Ansolabehere and Kuriwaki (Reference Ansolabehere and Kuriwaki2021) to tie the concepts studied more closely to accountability theory.Footnote 6 In particular, this framework allows us to account for the possibility that a citizen's evaluation of a senator's vote may be endogenous to the citizen's overall assessment of the senator. The framework also allows us to account for the role of party agreement in citizen assessment of senators, which is particularly important for more recent nominations given the rise in partisan polarization among voters both overall and on Supreme Court nominees. Finally, the framework allows us to benchmark the magnitude of the effect of voter–senator congruence on Supreme Court nominees against other high salience roll call votes.
2. Data and methods
As applied to the context of nominations, the Ansolabehere and Kuriwaki (Reference Ansolabehere and Kuriwaki2021) framework has three parts:
• Correct recall of roll call votes and senator partisanship Which types of voters are more likely to know how their senators voted on a nomination, as well as what party their senators belong to?
• Does reality predict perceptions? Does actual agreement between a voter and a senator on nominees and party predict perceived agreement on nominees and party?
• Do perceptions affect evaluation? Do citizens’ perceptions of whether they agree with senators on nominees and party affect how citizens evaluate senators, both in terms of general approval and whether citizens vote to reelect senators?
As we noted above, accountability models come in different varieties, but a core assumption is that there is a real or potential audience for the actions of a politician. Of course, when it comes to sophistication and knowledge by the general public, reality may not accord with the logic of rational choice models (Achen and Bartels, Reference Achen and Bartels2016). A necessary condition of our accountability story is that citizens—or, at least, a sufficient number of them—can successfully monitor the votes of their senators on nominees.
How can we test whether this is the case? In the modern era, hundreds of polls have asked about Americans’ opinions on Supreme Court nominees. But the Ansolabehere and Kuriwaki (Reference Ansolabehere and Kuriwaki2021) framework requires not just this information, but also how citizens perceive their senators to have voted on a given nominee, as well as voters’ assessments of their senators. Polls that ask both types of questions are rare, but they exist for three nominees: Clarence Thomas (1991), Sonia Sotomayor (2009), and Elena Kagan (2010).
For Thomas, we use the 1992 portion of the American National Election Study: Pooled Senate Election Study, 1988, 1990, 1992 (ASES) (Miller et al., Reference Miller, Kinder and Rosenstone2005). The ASES, which was also analyzed in Wolpert and Gimpel (Reference Wolpert and Gimpel1997) and Hutchings (Reference Hutchings2001), contains 2,759 respondents, with at least 40 in every state (including Hawaii and Alaska). The survey was conducted in November and December 1992, in the weeks following the elections in November. The elections in 1992, famously dubbed “the year of the woman” (Dolan, Reference Dolan1998), saw several female candidates win their Senate races, driven in large part by anger over how Anita Hill was treated during the Senate Judiciary Committee's hearings on Thomas' nomination.
For Sotomayor and Kagan, we use the 2009 and 2010 versions of the Cooperative Congressional Election Study (CCES) (Ansolabehere, Reference Ansolabehere2012, Reference Ansolabehere2013a). The “Common Content” of the CCES provides a wealth of information about respondents, including their party identification and demographic variables. The specific questions we primarily focus on, however, come from the Harvard “team” modules of the CCES in these years (Ansolabehere, Reference Ansolabehere2013b, Reference Ansolabehere2013c), both of which asked respondents about their recall of their senators’ votes on nominees. We denote these the “2009 CCES” and “2010 CCES” for convenience. The surveys were conducted in the Fall of 2009 and 2010, respectively, a few months after the confirmations of Sotomayor and Kagan (which occurred in August of 2009 and 2010, respectively).Footnote 7 The sample size from the CCES surveys differs across the types of analyses we run, but in general the sample size is much larger for Sotomayor and Kagan compared to Thomas.
The nomination of Thomas, of course, was an extremely high-profile event due to the Anita Hill scandal. The nominations of Sotomayor and Kagan, by contrast, were more routine affairs. Both nominees were appointed by President Obama during his first two years in office, when the Senate was heavily controlled by Democrats, making their confirmations close to a sure thing from the start. Despite the relative lack of controversy, both were confirmed on near party-line votes, with Sotomayor and Kagan receiving only nine and five yea votes from Republicans, respectively. Due to their overall similarity, throughout the paper we combine the results from the 2009 and 2010 CCES polls into a single survey and present pooled analyses, except where otherwise noted. (As it turns out, there is little substantive difference in the results when we analyze Sotomayor and Kagan separately—see Appendix Section A.6.4.)
Note that the CCES samples are cross-sectional, not a panel, so the respondents do not overlap across the two years. Thus, for every nominee, each respondent is asked to evaluate the votes of their two senators. In addition, the fact that each respondent has two senators means that the data can be analyzed in its wide form (one observation per respondent) or in its long form (two observations per respondent, one for each senator). For each of the analyses that follows, we make clear which form we are using.
2.1 Voter recall of senator votes
The question wording about voter preferences on nominees and voter recall differs somewhat between the Thomas survey and the CCES, but is comparable. Beginning with voter preferences, the 1992 ASES asked, “Now, thinking for a moment about the nomination of Clarence Thomas to the Supreme Court last year. Following the committee hearings, the full Senate voted whether or not to make Clarence Thomas a Justice on the United States Supreme Court. At that time, were you for or against making Thomas a Supreme Court Justice?” The CCES asked “If you were in Congress, would you have voted for or against the confirmation of [Sotomayor/Kagan] to the Supreme Court?” We code both as being either in favor or against confirmation, with non-responses and “don't knows” coded as such.
In terms of recall, the 1992 ASES asked respondents, “Do you remember how Senator [name] voted on the Thomas nomination?” It then followed up with “Did (he/she) vote for or against Thomas?” For respondents who said they did not know, the survey asked “Would you guess that (he/she) probably voted for or against Thomas?” We follow the lead of Hutchings (Reference Hutchings2001) and pool the guessing responses from the second question with the responses from the initial question. The 2009 and 2010 CCES asked, respectively, “The Senate considered the appointment of Sonia Sotomayor [Elena Kagan] to the U.S. Supreme Court. Did Senator [name1] vote for this appointment or against it?” These questions were repeated for the respondent's second senator.
For each survey, some respondents chose not to offer an opinion on how their senators voted (even after the second prompt, in the case of the Thomas survey). Our general strategy on how to handle such non-response is as follows. For the analysis that immediately follows in this subsection, we examine voter recall in two ways. First, we treat non-responses as being an “incorrect” recall assessment; in other words, those who do not offer a response are pooled with those who offer an incorrect response. Second, we drop non-responses, and examine recall only among those who offered an opinion.Footnote 8 Dropping non-responses will obviously lead to higher levels of recall.Footnote 9 But the advantage of looking at this set is that we can compare the distribution of recall to what we would observe if people were simply guessing (based on either flipping a coin or just cueing off the party of the senator). When we do that, it makes less sense to treat non-responses as incorrect, since such respondents made an affirmative choice not to guess how their senator voted. In the subsequent analyses that rely on regression methods, we include non-responses; as explained shortly, such responses are directly accounted for in the measures that implement the Ansolabehere–Kuriwaki framework.
To measure respondent recall of senators’ votes, we follow the example of Hutchings (Reference Hutchings2001, 852) and construct an index in the wide data that takes on the following values:
• 0 if the respondent correctly recalled neither senator's vote.
• 0.5 if the respondent correctly recalled exactly one senator's vote.
• 1 if the respondent correctly recalled both senators’ votes.
The distribution of this index for the nominees is presented in the top portion of Table 1. Let's begin with Thomas. The first column shows the recall index when we include all respondents and code non-responses as “don't knows.” We can see here that recall is fairly poor, as nearly half of all respondents could not correctly recall either of their senators’ votes on Thomas. A somewhat rosier view is that a majority of respondents correctly identified at least one of their senators’ votes, with one-quarter correctly identifying both. However, when we drop “don't knows,” the picture improves quite significantly. Among those who venture an opinion on how their senators voted on Thomas, only 25 percent get zero correct, with 36 percent getting one correct and 39 percent getting both correct.
Table 1. Measuring voter recall of senator votes

The top portion of the table uses the wide data to depict the distribution of the nominee-recall index, both with and without respondents who did not provide a response. The bottom part of the table uses the long data to compare the responses of voters whose senators voted with the majority of the party and those who voted against the majority of the party.
Now let's turn to Sotomayor and Kagan. Beginning again with all respondents, we see that Americans’ recall of senators’ votes on these two nominees is superior to what we saw with Thomas, with fully 46 percent of respondents correctly recalling both of their senators’ votes. Moreover, when we drop non-responses, the results are eye-popping, with only 2 percent correctly recalling neither senator, 10 percent recalling exactly one, and fully 89 percent recalling both correctly. To place these results in context, Ansolabehere and Jones (Reference Ansolabehere and Jones2010) find that on average voters are able to correctly identify about 72 percent of House members’ votes.
Of course, these raw distributions are somewhat difficult to interpret, and we might worry that many respondents are just guessing. First, note that if respondents were simply tossing a figurative coin when they respond and guessing yes or no, the null distribution of the recall index would come out to about 25 percent getting zero correct by chance, 50 percent getting one correct by chance, and 25 percent getting both correct. Since this null distribution is based on pure guessing, it makes sense to exclude respondents who are not willing to offer an opinion when they don't have one. When we do that, a chi-squared test easily rejects the null hypothesis that the actual distributions in Columns (2) and (4) are not distinguishable from the pure guessing distribution.
In addition, we follow the lead of Ansolabehere and Jones (Reference Ansolabehere and Jones2010, 585) and note the following additional reasons why mere guessing is unlikely to explain these levels of recall. First, if responses were simply random, we would be unlikely to find any structure in the data when we model the relationship between those who perceive themselves to be in agreement with their senator and those who don't. In fact, we find a great deal of structure. Second, people might just cue on partisanship, based on either the partisanship of the roll call votes on nominees and/or of their given senator. To account for this possibility, we control for both party identification and respondent agreement with their senator (we also do this for ideology); the key results still hold. Finally, statements of correct recall and policy agreement might be endogenous to approval of a senator. To account for this, we conduct an IV analysis below, and the key results again hold for Sotomayor and Kagan, but not for Thomas.Footnote 10
Finally, in the bottom portion of Table 1 we also follow the lead of Ansolabehere and Jones (Reference Ansolabehere and Jones2010, 585) by comparing the responses of voters whose senators voted with the majority of the party and those who voted against the majority of the party. Here we switch to the long version of the data, since we need to account for whether an individual senator voted for or against his or her party. In addition, since we will compare these responses to a guessing benchmark, here we only include respondents who offered an opinion on how their senator voted.
Let's begin with Thomas, who was approved by a narrow 52–48 margin. Thomas, a nominee of President George H.W. Bush, received yea votes from all but two Republicans, while 11 Democrats crossed party lines to vote for his confirmation. About 57 percent of respondents correctly identified their senators’ votes. Surprisingly, we see little difference depending on whether the senator voted with or against the party line; recall is actually slightly higher for the latter group.
Now let's turn to Sotomayor and Kagan, where the results are quite different. Sotomayor was confirmed by a vote of 68–31, with every Democrat voting to confirm her and all but nine Republicans voting to reject her. Kagan was confirmed by a vote of 63–37, with all but one Democrat voting to confirm and all but six Republicans voting to reject. We can see in Table 1 that about 93 percent of respondents correctly identified their senators’ votes on Sotomayor and Kagan. However, the results are quite different when we condition on how a senator voted relative to her party. When a senator voted with her party, voters correctly identified the vote fully 94 percent of the time. Conversely, that percentage drops to 70 percent of the time when senators voted against their party.
There are two points to note here. The first is the differences we find in recall between Thomas and Sotomayor/Kagan. It is important to note the changing historical context of these nominations. The Thomas nomination took place before the parties had reached their current levels of polarization. In addition, Thomas’ confirmation was assured by the support of (now extinct) Southern Democrats, who voted yes in large part because of their sizable African-American constituencies (Overby et al., Reference Overby, Henschen, Walsh and Strauss1992). This “scrambling” of the normal ideological lines surely helps explain why we don't observe a higher difference in recall among senators who voted with and against the party in the bottom-left portion of Table 1. Finally, the Anita Hill scandal injected both racial and gender dynamics into Thomas’ nomination in a way that is unique in the history of Supreme Court nominations (Hutchings, Reference Hutchings2001).Footnote 11 These factors surely combined (in perhaps interactive ways) to reduce correct recall of senators’ votes on Thomas.
Conversely, by 2009, the current era of extreme party polarization was firmly in place. These differences in party sorting and polarization surely made it easier for respondents to correctly recall the votes of senators by using party as an aid. And the fact that the roll call votes for Sotomayor and Kagan were largely party line votes made correct recall an easier task for many citizens. (In addition, note that in our analyses below we account for “party agreement”—both real and perceived—between respondents and senators when we examine the link between recall and evaluations of senators.)
However, the asymmetric results in the bottom-right portion of Table 1 show it is not simply party doing the work in explaining the high levels of recall for Sotomayor and Kagan. To see this, imagine that voters simply guessed every time that senators voted in line with their party. For Sotomayor and Kagan, this means assuming all Democratic senators voted yes and all Republican senators voted no. In the Sotomayor and Kagan data, only about 4 percent of observations feature senators with “cross-party” votes. If respondents were simply guessing based on party, we would expect them to recall these votes correctly only about 4 percent of the time, since 96 percent of the time they would correctly align with the “straight-party” votes. Instead, the actual percentage of correct responses in these votes is about 70 percent. This difference provides strong evidence that most people are not simply guessing. Instead the recall that we observe in 21st century Supreme Court nominations seems quite real.Footnote 12
Voter recall and political engagement
Examining the levels of recall is certainly worthwhile, but of perhaps even greater interest is the variation in who is, in fact, doing the recalling. For each survey, we coded variables that capture the concept of political engagement, such as education, political knowledge, and news interest. Figures 4 and 5 depict the levels of recall across each of the variables we collected, for Thomas and Sotomayor/Kagan, respectively (full details on the coding of these variables can be found in Appendix Section A.2). For each panel in these figures, the vertical axis depicts the mean index of recall, while the horizontal axis depicts the levels of the respective predictor, moving from lower levels of political engagement to higher levels.

Fig. 4. Political engagement and voter recall of senators’ votes to confirm Clarence Thomas. For each panel, the vertical axis depicts the mean index of recall, while the horizontal axis depicts the levels of the respective predictor.
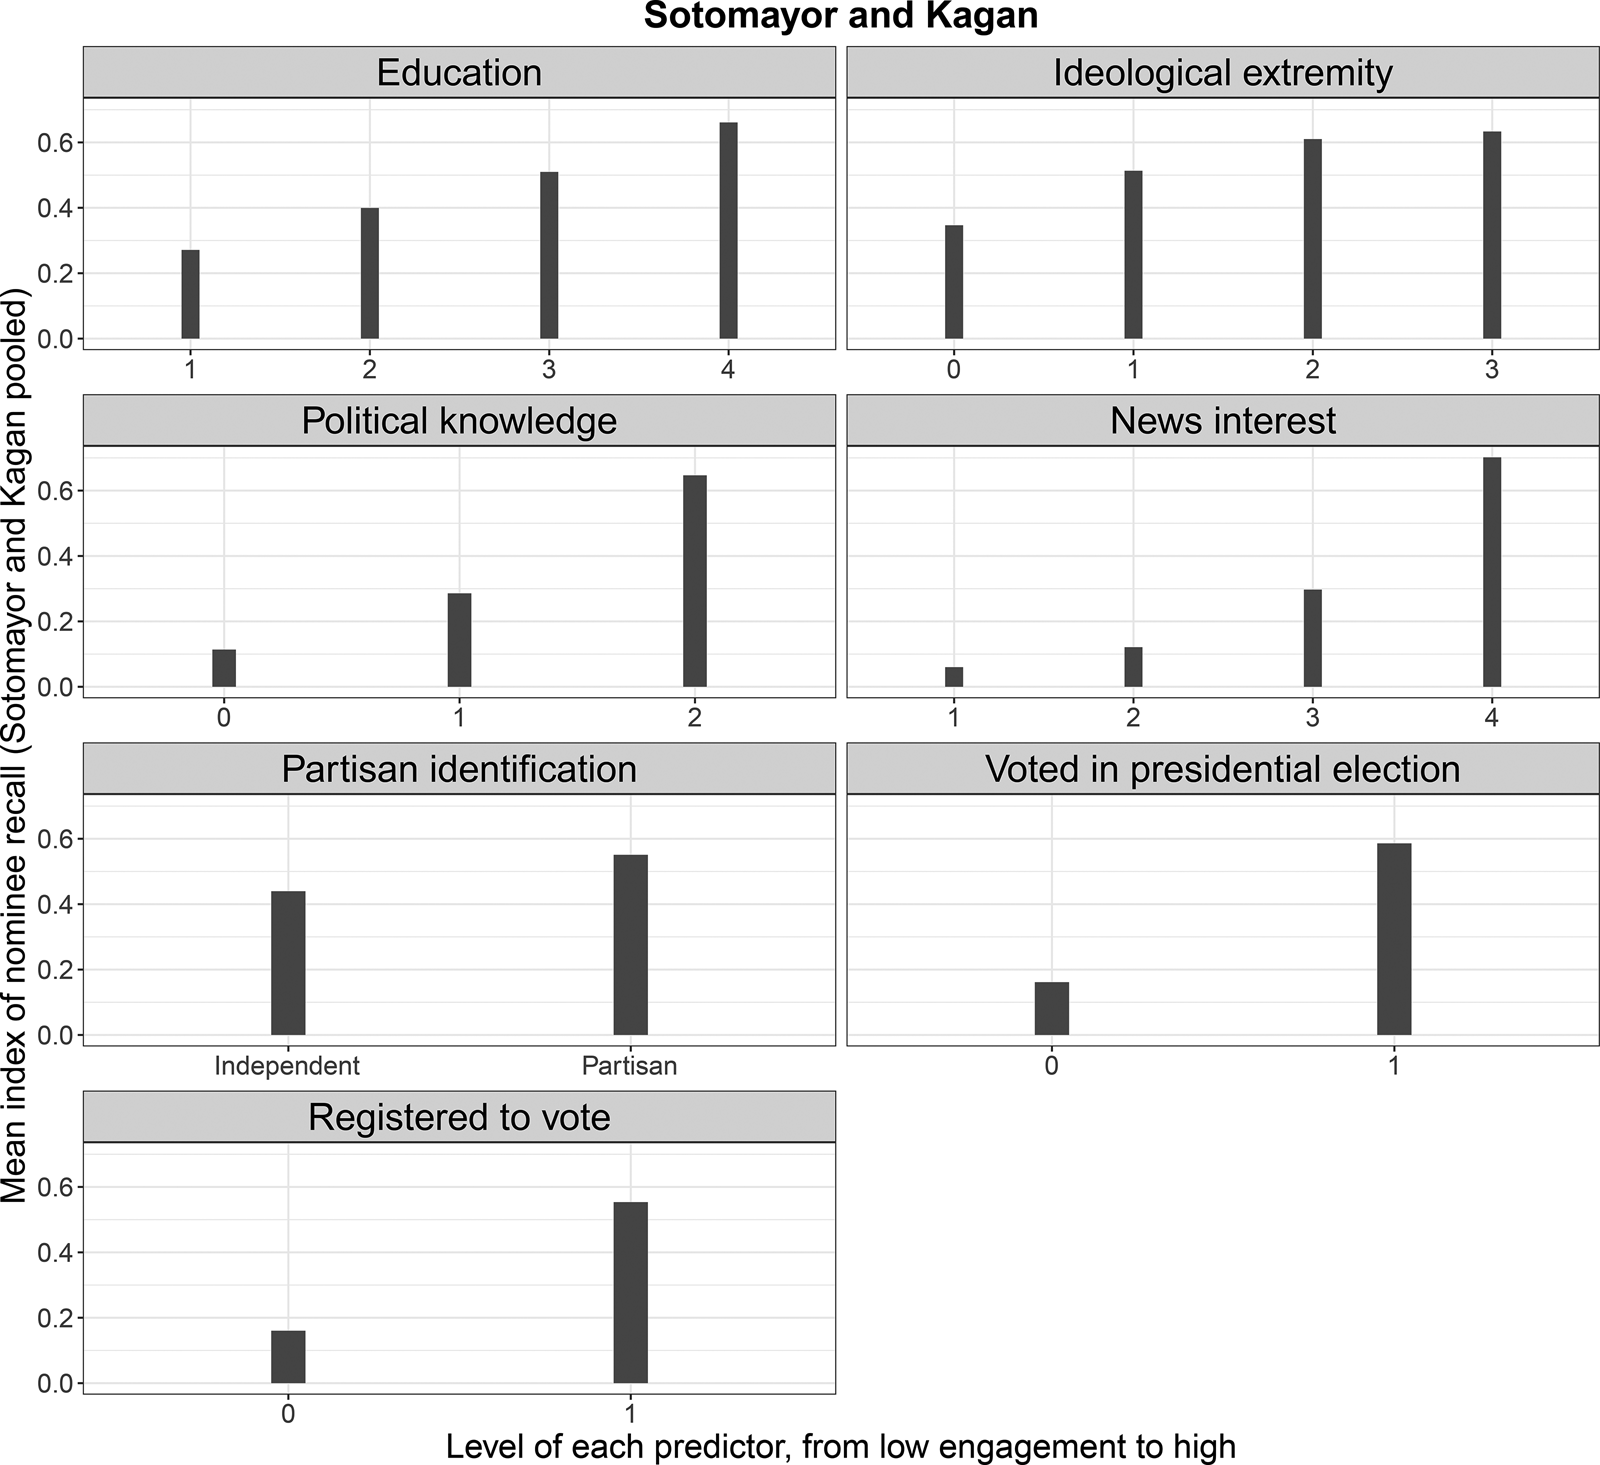
Fig. 5. Political engagement and voter recall of senators’ votes to confirm Sotomayor/Kagan. For each panel, the vertical axis depicts the mean index of recall, while the horizontal axis depicts the levels of the respective predictor.
In both Figures 4 and 5, the patterns are fairly clear, though again generally stronger for Sotomayor/Kagan compared to Thomas. For most of the variables, higher levels of political engagement lead to higher levels of recall. The patterns are particularly strong for education, political attention, political knowledge, and whether a respondent voted in the most recent presidential election.
To test the relationship between political engagement and voter recall more systematically, for each nominee we used a principal components analysis to create a single factor score that summarizes all of the variables in Figures 4 and 5. We rescale this variable by dividing it by two times its standard deviation; the coefficient on this variable can then be interpreted as moving from the mean minus one standard deviation to the mean plus one standard deviation; or more generically, from the lower end of the scale to the higher end of the scale (Gelman, Reference Gelman2008).
Table 2 presents four ordinary least squares (OLS) models—two each for Thomas and Sotomayor/Kagan—in which the dependent variable is the index of recall. Each model contains the factor scores of engagement; we standardize the scores by centering and dividing by two standard deviations. Models (2) and (4) include controls for education, gender, race, age, and party identification (though they are omitted from the table for clarity).Footnote 13 In each model, the coefficient on political engagement is positive and significant. In line with the graphical results above, the relationship is much stronger for Sotomayor/Kagan compared to Thomas. A shift of two standard deviations in engagement predicts about a 40–45 percentage point increase in recall for the former; even for Thomas, a two standard deviation shift predicts a roughly 12 percentage point increase in recall.
Table 2. OLS models of voter recall as a function of political engagement

In each model, the dependent variable is the index of recall. Political engagement is a factor score based on a principal components analysis of the variables shown in Figures 4 and 5, respectively, for Thomas and Sotomayor/Kagan. Models (2) and (4) include, but do not display, controls for education, gender, race, age, and party identification. *p < 0.05.
In sum, we find that the necessary conditions for accountability with respect to voting on Supreme Court nominees do exist—at least for the nominations of Sotomayor and Kagan, by which point the modern era of strong party polarization had solidified. Overall, voters do a decent job of identifying how their senators voted on these nominees. And, as we would expect, the ability to correctly recall correlates quite significantly with levels of political engagement among citizens (this is true for Thomas as well).
2.2 Does reality predict perceptions?
To flesh out our approach for the rest of the paper, we reproduce Figure 1 from Ansolabehere and Kuriwaki (Reference Ansolabehere and Kuriwaki2021) in Figure 6, which summarizes the relationships between actual agreement, perceived agreement, and evaluations.Footnote 14 While policy representation is important for accountability, party identification, of course, also plays a role in linking citizens and representatives. The Ansolabehere and Kuriwaki approach accounts for the importance of party by allowing the interplay of actual party agreement and perceived agreement to inform citizens’ assessments of their representatives. Thus, under this conceptual framework, actual party agreement and actual issue agreement (where “issue” for our purposes means a confirmation of a Supreme Court nominee) predict perceived party and issue agreement.

Fig. 6. Figure 1 from Ansolabehere and Kuriwaki (Reference Ansolabehere and Kuriwaki2021), which summarizes the relationships between actual agreement, perceived agreement, and evaluations.
In this subsection we ask whether actual agreement on nominees predicts perceived agreement. In other words, does the reality of roll call voting and party agreement shape voter perceptions of roll call voting and party agreement? This analysis can be thought of as the “first stage” regressions in the causal path identified in Figure 6. (In the next subsection, we address the identifying assumptions of the IV analyses that will seek to identify whether perceptions causally affect evaluations.)
Following Ansolabehere and Kuriwaki (Reference Ansolabehere and Kuriwaki2021), we define “perceived nominee agreement” as follows:
• + 1 if a respondent's preference (based on how she would have voted on the nominee) is the same as the respondent's perception of the senator's vote (i.e., the respondent would have voted yes (no) and perceives the senator as having voted yes (no)).
• 0 if the respondent does not have an opinion on the nominee or does not express an interest.
• − 1 if a respondent's preference (based on how she would have voted on the nominee) is opposite to the respondent's perception of the senator's vote (i.e., the respondent would have voted yes (no) and perceives the senator as having voted no (yes)).
Next, we define “actual nominee agreement” in the same manner, but substitute the senator's actual vote instead of the respondent's perception of the vote. That is, + 1 if the respondent's preference agrees with the senator's actual vote, − 1 if it the respondent's preference is opposite to the senator's vote, and 0 if the respondent does not have an opinion on the nominee or does not express an interest.
We code “perceived party agreement” as follows:
• + 1 if the respondent identifies with the same party she perceives the senator to be (i.e., the respondent identifies as a Republican (Democrat) and perceives the senator as being a Republican (Democrat)).
• 0 if the respondent is an Independent or is unsure of her senator's party.
• − 1 if the respondent identifies with the opposite party as she perceives the senator to be (i.e., the respondent identifies as a Republican (Democrat) and perceives the senator as being a Democrat (Republican)).
We define “actual party agreement” in the same manner, but substitute the senator's actual party identification instead of the respondent's perception of it.
With these measures in hand, we can now examine how well reality predicts perceptions, in terms of nominee votes and party agreement. In doing so, we note that from this point forward, we analyze the long version of the data, in which each respondent appears twice, once for each of their senators. To account for non-independence across the paired observations, we employ robust standard errors, clustered on the respondent.Footnote 15
Finally, for models with control variables, we include demographics, party identification, and political engagement. Because ideological differences with a senator may affect perceptions, even accounting for party agreement, we follow Ansolabehere and Kuriwaki and include an “actual ideological agreement” variable that is similar in thrust to the party agreement variable. Specifically, this variable is measured as the proximity between a respondent's self-reported ideology and a senator's first dimension DW-NOMINATE score. The respondent's ideology is taken from her placement on a 7-point scale ranging from “Very Liberal” to “Very Conservative,” standardized to range from − 1 to + 1. NOMINATE scores lie between around − 1 (Democrats) and + 1 (Republicans). The absolute difference between the two measures is then flipped so that positive values indicate less distance, and ranges from − 1 to + 1.
Table 3 presents parallel regressions for Thomas and Sotomayor/Kagan. For each, perceived nominee agreement is the dependent variable in the models in columns (1) and (2), while perceived party agreement is the dependent variable in the models in columns (3) and (4). The models in columns (1) and (3) do not include control variables; the models in columns (2) and (4) do include them, though we omit their presentation in the interest of space.
Table 3. OLS regressions of voters’ perceptions of how senators voted on nominees and the party of their senators

In models (1) and (2) the dependent variable is perceived nominee agreement, while for models (3) and (4) the dependent variable is perceived party agreement. For models (2) and (4), control variables include: education, gender, race, age, partisanship, actual ideological agreement, and the factor score of political engagement based on the variables in Figures 4 and 5. *p < 0.05. Standard errors are clustered on respondents.
Overall, the connection between reality and perception is strong—again, this is especially so for Sotomayor and Kagan. For Thomas, a one-unit increase in actual agreement on his confirmation vote predicts about a 10 percentage point increase in perceived agreement with a senator. For Sotomayor and Kagan, this predictive effect is about 40 percentage points. For some context, this effect size is roughly comparable to what Ansolabehere and Kuriwaki find in their study of House members (they find an average effect size of 0.34). In addition, and unsurprisingly, for both sets of nominees, actual party agreement predicts perceived party agreement quite strongly.
Note also from Table 3 that for both analyses, the “cross-effect” of actual party agreement on perceived nominee agreement is much weaker than the “straight” effect of actual nominee agreement on perceived nominee agreement. For Thomas, the coefficient on actual party agreement in the first two models (where the DV is perceived nominee agreement) is only 0.04, compared to 0.10 and 0.12 for actual nominee agreement. For Sotomayor/Kagan, the coefficient on actual party agreement in the first two models is only 0.16 and 0.10, compared to 0.42 and 0.40 for actual nominee agreement. Thus, the results in Table 3 make clear that perceived nominee agreement is not operating directly through partisanship—actual nominee agreement (i.e., issue-based agreement) is doing most of the work.
2.3 Do perceptions affect evaluation?
So far we have shown that the public as a whole can make sense of how their senators vote on Supreme Court nominees, and that citizens’ perceptions of these votes are grounded in the actuality of senatorial decisions, particularly for Sotomayor and Kagan. Thus, the seeds for accountability are there. The final—and most difficult—piece of the puzzle is to examine whether these perceptions actually cause support for or opposition to citizens’ elected representatives.
Returning to Figure 6, Ansolabehere and Kuriwaki (Reference Ansolabehere and Kuriwaki2021) note that one key threat to interpreting a positive correlation between perceptions and evaluation is the endogeneity (or reverse causation) of perceived agreement. “For example, a respondent might have underlying trust in the [senator], which both leads to higher job approval and also leads him to the belief that the [senator] probably agrees with him on key issues too” (Ansolabehere and Kuriwaki, Reference Ansolabehere and Kuriwaki2021, 4). To deal with the possibility of an unobserved confounder, Ansolabehere and Kuriwaki implement IV regressions, employing actual issue and party agreement to serve as instruments for perceived issue and party agreement. We do the same.
Implementing IV regressions with observational data—especially when one does not have random or quasi-random assignment of the treatment, as is the case with our data—requires several assumptions, many of them strong. Accordingly, we carefully review each assumption, evaluate how violations could threaten our inferences, and discuss what evidence we can provide against these threats. To do so, we follow the very clear presentation in the “Instrumental Variables” chapter in Cunningham (Reference Cunningham2021), who notes that identification in an IV set-up requires five assumptions.Footnote 16 We present the assumptions moving from most innocuous, in our judgment, to the most severe threats to inference.
The first assumption is the stable unit treatment value assumption, which states that the treatment status of one individual (or unit) should not affect the response of any other units. Since our data feature individual survey respondents taking each survey in isolation, there is no reason to think that the perceptions of any individuals in our survey affect the evaluation of any other individuals.
The second assumption relates to the first stage of the IV equation, sometimes known as the “strong instrument” assumption. The requirement is that the instrument must have a sizable effect on the treatment in order to identify unbiased causal effects. Fortunately, this assumption is testable. The results in Table 3 show a strong relationship between actual agreement and perceived agreement on nominees (and party), particularly for Sotomayor and Kagan. Below we formally test the instrument strength through an F-test; see Table 6.
The third assumption is the monotonicity assumption. This requires that the IV weakly have the same directional effect on all individuals. This assumption would be violated if actual agreement had a negative relationship with perceived agreement for some people. While there may be no relationship between actuality and perceptions for some people, we see no reason why such a negative relationship would exist, and hence monotonicity seems satisfied in this context.
The final two assumptions are more difficult. The fourth assumption is the well-known exclusion restriction, which states that any effect of the instrument on the outcome must occur only through the effect of the instrument on the treatment, and not through a direct effect of the instrument on the outcome. In our context, this means that actual agreement on nominees (and party) affects evaluation of senators only through voters’ perceptions about how their senators voted, and not through any direct effects of actual agreement on evaluations. If the exclusion restriction holds (along with the other four assumptions), then the IV approach will allow us to recover the causal effect of perceived agreement on voter evaluations of senators, even in the presence of endogeneity. As with any observational study, one can imagine scenarios where the exclusion restriction—which is untestable—might be violated. However we share the assessment of Ansolabehere and Kuriwaki (Reference Ansolabehere and Kuriwaki2021, 4) on this question: “Although this is an untestable assumption, we point out that it is a natural one in our setting given that constituents can only form evaluations based on what they perceive” (emphasis added).
The last, and most challenging, assumption is the independence assumption, sometimes also referred to as “exogeneity.” Here the key idea is that the instrument should be “as good as randomly assigned,” or nearly so. In other words, the instrument is orthogonal to the treatment and outcomes, conditional on covariates. (Ansolabehere and Kuriwaki (Reference Ansolabehere and Kuriwaki2021, 4) label this assumption “exogeneity of the instrument conditional on controls.”) An exogenous IV imparts shocks to the endogenous variable distinct from those imparted by an unobserved confounder like trust. These independent shocks then allow identification of the effect of the endogenous variable on the outcome.
With a truly random instrument, independence occurs naturally via random assignment. This is true with respect to both the first stage and the reduced form. But in observational data, such independence is unlikely to be fully achieved; the question then is whether so much deviation occurs in the data that we would be skeptical of the overall results.Footnote 17
In Section A.3 in the Appendix, we present a variety of evidence to assess this assumption; we focus only on the Sotomayor and Kagan results since the Thomas IV results with respect to perceived nominee agreement in Table 6 below are not significant. First, we look at covariate balance among the non-instrument variables, and find that the data are well balanced, especially among the respondents who are likely driving the results (i.e., those who score either “− 1” or “1” on the actual nominee agreement index). Second, we implement a sensitivity analysis that probes the possibility that omitted variable bias is driving the key results (Cinelli and Hazlett, Reference Cinelli and Hazlett2020). We find that an unobserved confounder would have to unreasonably surpass the effects of partisanship and ideology to make the estimated relationship between perceptions and evaluations go to zero. Together, both the balance tests and sensitivity analyses suggest that unobserved confounding is unlikely to explain away the apparently strong causal relationships between perceptions and evaluations in our analyses of Sotomayor and Kagan.
Even given these robustness analyses, we recognize that some readers will not be convinced that IV analysis in this context is appropriate, given the lack of a truly exogenous shock that affects treatment status. In addition, some readers might not entertain our argument about the exclusion restriction. For such readers, we would note that an alternative way to conceive of our design in this section as simply one of selection on observables. Accordingly, in Table 6, in addition to two-stage least squares regressions that implement the IV analysis, we also present OLS models where evaluations of senators are dependent variables and perceived nominee (and party) agreement are the main predictors. (Note that the covariate balance checks and sensitivity analysis apply equally to the IV framework and the selection-on-observables framework.)
2.3.1 Reduced form estimates: actual agreement and voter evaluations
We begin by presenting the estimates of the reduced form relationship in Figure 6, which captures the relationship between actual agreement and voter evaluations of senators.Footnote 18 Because studies of accountability generally can only measure actual agreement (as opposed to perceptions), this relationship is the one that is usually examined in the literature. Returning to Badas and Simas (Reference Badas and Simas2022), they find a strong relationship between citizens’ actual agreements with their senators’ votes on the nominations of Neil Gorsuch and Brett Kavanaugh and citizens’ vote choices for senators.
To study citizen evaluation, we employ two dependent variables, both of which have strengths and weaknesses. The first is citizens’ vote choice for senators. Here we follow the lead of studies of accountability in the House of Representatives, which often look at whether a respondent voted for a House member in the previous election. Vote choice is probably the concept that most naturally links to theories of accountability. However, the fact that senators have six-year terms with staggered electoral cycles complicates the use of vote choice due to missing data. In each of our relevant Senate election years (1992 and 2010), fewer than a third of senators were up for re-election (after accounting for senators who either retired or were defeated in a party primary). In addition, we cannot analyze vote choice for Sotomayor, since her recall questions were asked in the 2009 CCES, a year before the 2010 Senate elections. Thus, all our vote choice regressions will be relatively under-powered.
Accordingly, we follow the lead of Dancey and Sheagley (Reference Dancey and Sheagley2016) and also examine voter approval of senators, based on the straightforward survey question of whether voters approve of their senators or not. For both Thomas and Sotomayor/Kagan, we construct binary approval measures, coded 1 if the respondent either approved strongly or somewhat approved and 0 if the respondent disapproved strongly or somewhat disapproved of her senator. We construct this measure for both of the respondent's senators, meaning that all respondents across all three nominees can be included in the approval analyses.
Table 4 presents several parallel OLS regressions for Thomas and Sotomayor/Kagan that estimate the reduced form relationship of whether actual nominee and party agreement predict evaluations of senators. For the models in columns (1) and (2), the dependent variable is whether the respondent approved of her senator; for the models in columns (3) and (4), the dependent variable is vote choice. Models (1) and (3) do not include control variables, while models (2) and (4) do include them, though we omit their presentation in the interest of space.
Table 4. OLS regression models of reduced form of actual agreement versus evaluation of senators

The dependent variable in columns (1)–(2) is whether respondents approve of their senators, while columns (3)–(4) employ vote choice as the dependent variable. Models with control variables include: education, gender, race, age, partisanship, and the factor score of political engagement based on the variables in Figures 4 and 5. *p < 0.05.
We begin with the Thomas nomination. We find only a modest relationship between actual agreement and voter evaluations of senators. For approval, a one-unit increase in actual agreement predicts only about an one percentage point increase in approval, and the coefficient is measured somewhat imprecisely, especially in model (2). The relationship is stronger for vote choice, with a one-unit increase in actual agreement predicting about a five percentage point increase in the likelihood that the respondent voted for their senator. Both of the coefficients on actual nominee agreement in models (3) and (4) are measured fairly precisely. Finally, it is worth noting that actual party agreement has a stronger predictive effect on approval and vote choice than does agreement on the Thomas vote.
Turning to the Sotomayor and Kagan nominations, we see much stronger effects. For approval, a one-unit increase in actual nominee agreement predicts about a 14 percentage-point increase in model (1) and about a 12-percent increase in model (2), with both measured quite precisely. The coefficients for vote choice are similar in models (3) and (4). Again, and perhaps not surprisingly, the relationship between actual party agreement and voter assessments is quite sizable, especially for vote choice.
These reduced form estimates are important, as they show modest relationships for the Thomas nomination between actual nominee agreement and citizen assessment of senators and quite strong relationships for the Sotomayor/Kagan nominations. But, as Ansolabehere and Kuriwaki note, the reduced form is incomplete, as it is silent as to how citizens perceive agreement with their senators and whether they act on those perceptions. Accordingly, we now return to our central question of whether perceptions of agreement causally affect voter evaluations of senators.
2.3.2 Perceptions and voter evaluations
Prior to using a regression framework, Table 5 presents a simple analysis of senator approval (we rely on approval here rather than vote choice to maximize the sample size). Specifically, it breaks down citizen approval of senators by perceived nominee and party agreement. The table is essentially a cross-tab—each cell depicts the mean level of approval among a particular combination of nominee and party agreement. The exterior rows and columns depict the marginal distributions, while the percentages in the bottom right-hand corners depict the overall means.
Table 5. Approval of senators by perceived nominee and party agreement

Each cell depicts the mean level of approval among a particular combination of nominee and party agreement. The exterior rows and columns depict the marginal distributions, while the percentage in the bottom right-hand corner depicts the overall mean level of approval.
A number of interesting patterns emerge from Table 5. First consider Thomas. Notice that if we condition on perceived party agreement (i.e., moving up and down the columns) moving from perceived nominee agreement to perceived disagreement is always associated with a sizable decrease in mean levels of approval. For example, among those respondents who are in party agreement, moving from perceived nominee disagreement to perceived nominee agreement predicts a shift from 67 percent approval to 87 percent approval. Conversely, for Thomas, conditional on nominee agreement, moving across party disagreement has relatively little predictive effect on approval. Thus, even accounting for party identification, whether voters perceive themselves as in agreement or disagreement on these nominees has significant implications for whether they approve of their senators—in addition, for Thomas, nominee agreement is doing much more work than party agreement. (Note that these “effects” are much larger than we see in the reduced form relationship in Table 4, which could be due in part to citizens relying on incorrect perceptions.)
For Sotomayor/Kagan, even more so than with Thomas, shifts in perceived nominee agreement are associated with large shifts in approval, even conditional on perceived party agreement. For example, even among voters who perceive themselves as in party agreement with their senator, moving from perceived nominee disagreement to agreement means a shift from 54 percent approval to 90 percent approval. Similarly, among those who perceive themselves as of the opposite party as a senator, moving from perceived nominee disagreement to agreement means a shift from 6 percent approval to 39 percent approval. However, unlike with Thomas, changes in perceived party agreement in 2009 and 2010 are associated with massive changes in perceived nominee agreement. For instance, among respondents who perceive they are in agreement with their senator's party, 90 percent support their senator. This percentage drops to 38 percent among respondents who perceive they are not of their senator's party. This difference between Thomas and Kagan/Sotomayor again apparently illustrates the sharpened party polarization between 1991 and 2010.Footnote 19
We now turn to estimating the full relationship in Figure 6, in order to systematically evaluate the relationship between perceptions and evaluations. Table 6 presents both two-stage least squares IV regressions and OLS regressions. The IV results are in the first four columns; in these models, actual nominee agreement and actual party agreement serve as instruments for perceived nominee agreement and perceived party agreement, respectively. The OLS results are in the last four columns for the different nominees. In columns (1), (2), (5), and (6), the dependent variable is whether the respondent approved of her senator. In columns (3), (4), (7), and (8), the dependent variable is whether the respondent reported voting for their incumbent senator. (Recall that these data do not exist for Sotomayor, and thus the models in the bottom-right quadrant only include Kagan.) The odd-number models do not include control variables, while the even-number models do include them, though we omit their presentation in the interest of space.Footnote 20
Table 6. Regression models evaluating whether perceptions about nominee votes affect evaluation of senators

The first four models present IV models, while the last four models present OLS regressions. For columns (1), (2), (5), and (6), the dependent variable is whether respondents approve of their senators on perceived nominee and party agreement. For columns (3), (4), (7), and (8), the dependent variable is whether respondents voted to re-elect their incumbent senator. Models with control variables include education, gender, race, age, partisanship, and the factor score of political engagement based on the variables in Figures 4 and 5. The F-statistics in the IV regressions are tests of whether actual nominee and party agreement are sufficiently strong predictors of perceived nominee and party agreement, respectively. *p < 0.05.
Let's begin with the IV results. Starting with Thomas, the coefficient on perceived nominee agreement is positive in all four models; however, it is measured quite imprecisely in each, with standard errors on par with the coefficient magnitude. In addition, the table presents a test of the F-statistic for whether actual nominee agreement is a strong instrument for perceived nominee agreement. The general rule of thumb is that an instrument should have an F-statistic of at least 10 to be considered “strong” (Angrist and Pischke, Reference Angrist and Pischke2014, 145). While the F-statistics in the approval analyses meet this bar, the F-statistics in the vote choice analyses do not. Note that the choice of dependent variable does not affect the structure of the first-stage analysis, so this difference is mainly a result of the much smaller sample size in the vote choice regressions. Nevertheless, the evidence we find for a systematic relationship between perceptions of nominee agreement and evaluation in the Thomas nomination is ambiguous at best. (Conversely, we find a strong relationship between party agreement perceptions and evaluations.)
The picture looks quite different when we move to the Sotomayor/Kagan nominations. The coefficients on perceived nominee agreement in each model are both sizable and statistically significant. For approval, a one-unit shift in perceived nominee agreement predicts about a 25 percentage point shift in approval. For vote choice, the effect sizes are smaller, but still of substantive significance, as they are in the range of 13 percentage points. In addition, for Sotomayor and Kagan, perceived nominee agreement easily passes the bar for a strong instrument. We again find significant party effects, showing that the effect of nominee perceptions is operating above the general effect of partisan alignment between citizens and senators.
Next, let's turn to the OLS regressions in the last column of Table 6. Crucially, the results for perceived nominee agreement for Sotomayor and Kagan are substantively and statistically the same as in the IV regressions. As we noted above, if one is more comfortable with a selection-on-observables framework, then such an approach leads to the same conclusion for Sotomayor and Kagan. For Thomas, the coefficients on perceived nominee agreement are actually positive and statistically significant, unlike in the IV regressions. However, given the overall ambiguity we have seen in the Thomas results, we are hesitant to put too much stock in these OLS models. (Notably, even if one were confiden in Thomas’ OLS models, the size of the respective coefficients on perceived nominee agreement is much smaller compared to what we observe for Sotomayor and Kagan.)
2.3.3 Comparing nominations to other issues
All in all, the results for Sotomayor and Kagan strongly suggest that in the politics of today's Supreme Court nominations, voters seem to hold senators accountable for their votes on Supreme Court nominees, and that voters’ assessments of senators are driven by voters’ perceptions of how senators vote. But in a vacuum, it is somewhat difficult to say how substantively large the relationship between perceptions and assessments is. One way to benchmark the effect of perceived nominee agreement on senator approval and vote choice is to compare it to the effects seen in other high-profile votes. The 2009 and 2010 CCES asked respondents to cast a number of “roll call votes” on several salient issues, including the 2009 stimulus package; the 2010 passage of the Affordable Care Act (“Obamacare”); the 2010 repeal of “Don't Ask, Don't Tell”; the 2009 expansion of the Children's Health Insurance Program (CHIP); the 2009 passage of the Lilly Ledbetter Fair Pay Act of 2009; and the 2010 Dodd–Frank bill on financial regulation. For each of these issues, we ran IV regressions parallel to those on our nominees (using controls) in Table 6.
Figure 7 shows the results of these parallel analyses.Footnote 21 The top panel depicts the results from using senator approval as the dependent variable, while the bottom panel depicts the results from using vote choice as the dependent variable. (Because the questions about Lilly Ledbetter and CHIP were asked in 2009, we cannot use them in the vote choice analysis.) For each panel, the points depict the coefficient from “perceived issue agreement,” with the issue varying by different roll calls. The horizontal lines depict 95 percent confidence intervals.

Fig. 7. Comparing effects of perceived issue agreement for Sotomayor and Kagan to other high-profile roll call votes in 2009 and 2010. The top panel shows the results for approval, the bottom for vote choice. Each estimate comes from a regression that parallels the structure of the IV with control models in Table 6 (i.e., the models in columns (4) and (8)). The horizontal lines depict 95 percent confidence intervals.
Let's begin with the approval results. The top panel in Figure 7 reveals that perceived agreement on all of these issues influenced voters’ assessments of their senators. Even the issue with the smallest estimated effect—the Dodd–Frank bill—still shows an estimated effect of about 9 percentage points. Notably, however, the effects seen for Sotomayor/Kagan are among the largest—the estimated effect of agreement with senators’ votes on these nominees is effectively tied for the largest in magnitude with the ACA, the Stimulus, and Don't Ask, Don't Tell, as each predicts a 20- to 25-percentage point shift in approval. Conversely the coefficients for CHIP, Lilly Ledbetter, and Dodd–Frank are roughly between a third and half as large.
Turning to the vote choice regressions, we see in the bottom panel in Figure 7 that the estimated effect of Kagan agreement on vote choice is somewhat smaller than for the ACA and the stimulus. Yet, the estimated effect of Kagan agreement is still quite sizable in broader context, as it exceeds that seen for Don't Ask, Don't Tell and Dodd–Frank.
How should we think about the relative importance of votes on Supreme Court nominees in this broader context? On the one hand, the relative size of the effects for Sotomayor/Kagan is quite surprising. Recall that these were relatively low salience and low-key nominees, whereas the ACA and the stimulus were enormous pieces of legislation that generated huge media coverage and partisan bickering. On the other hand, compared to complex legislation, Supreme Court nominations are very straightforward affairs, with outcomes that are quite stark: either the nominee is confirmed, allowing her to serve on the nation's highest court, or she is rejected, forcing the president to name another candidate. In this process, note Watson and Stookey (Reference Watson and Stookey1995, 19): “there are no amendments, no riders and [in recent decades] no voice votes; there is no place for the senator to hide. There are no outcomes where everybody gets a little of what they want. There are only winners and losers.” It seems quite plausible that this clarity allows voters to easily update their assessments of their senators based on their perceptions of how they voted on Supreme Court nominees.
3. Conclusion
Summarizing their pioneering work on voter recall and accountability, Ansolabehere and Jones (Reference Ansolabehere and Jones2010, 584, citations in original) wrote:
Individuals’ beliefs reflect a mix of hard facts learned from the media, campaigns, and other sources and inferences drawn from other facts, especially party labels (see, e.g., Aldrich (Reference Aldrich1995); Cox and McCubbins (Reference Cox and McCubbins1993)). Importantly, though, constituents on average hold accurate beliefs about the roll-call voting of [r]epresentatives, which allows the public collectively to hold politicians accountable.
In this paper we have presented a variety of empirical evidence that supports this assessment when it comes to senatorial votes on contemporary Supreme Court nominees.
In particular, after the Thomas, Sotomayor, and Kagan nominations, many voters were aware of their senators’ confirmation votes and perceived them correctly, particularly for Sotomayor and Kagan. In addition, citizens’ evaluations of senators tracked their perceived agreement or disagreement with the senators’ roll call votes on the nominees. We applied the IV approach pioneered in Ansolabehere and Jones (Reference Ansolabehere and Jones2010) and Ansolabehere and Kuriwaki (Reference Ansolabehere and Kuriwaki2021) to these data. While the evidence for Thomas is ambiguous at best, the results for Sotomayor and Kagan suggest these relationships are in fact causal. In other words, constituents’ perceived agreement or disagreement with their senators’ confirmation votes on Sotomayor and Kagan caused changes in constituent evaluations of their senators and in citizen vote choices. Finally, we find that the size of these effects is comparable to those arising from such high-profile roll call votes as the Affordable Care Act and the 2009 stimulus package.
These empirical findings assume greater significance when combined with earlier studies showing the responsiveness of senators to co-partisan public opinion on Supreme Court nominees. The evidence on constituents in the current paper in some sense closes the “circle of democratic accountability”—constituents track roll call votes on Supreme Court nominees and reward or punish senators accordingly, and senators’ roll call votes on Supreme Court nominees respond to the preferences of constituents (Overby et al., Reference Overby, Henschen, Walsh and Strauss1992; Kastellec et al., Reference Kastellec, Lax and Phillips2010, Reference Kastellec, Lax, Malecki and Phillips2015). One cannot definitely establish that citizen monitoring and reward causes senator responsiveness, but the overall patterns are exactly what the revisionist accounts of democratic accountability would predict. Conversely, it is not what the traditional dim view of democratic accountability would lead us to expect.
Supreme Court confirmations are, of course, just a single venue for studying democratic accountability, and an unusual one at that. Recent Supreme Court appointments are highly visible and confirmation votes are very easy to understand. These features distinguish Supreme Court appointments from many, or perhaps even most, issues in modern governance. At the same time, Supreme Court nominations afford an interesting case, though hardly a “crucial” one in the sense of Eckstein (Reference Eckstein1975): if accountability for senator actions does not work in such a favorable setting, how could it work in problematic ones? But, accountability does seem to work here—or at least so the empirical evidence suggests.
In addition, the results are highly suggestive for future Supreme Court nominations. In all likelihood, these nominations will also prove controversial, highly visible, and easy to understand. The evidence presented here thus suggests constituents will follow their senators’ confirmation votes, register them accurately, and remember them. Then, the agreement or disagreement of the senator's vote with constituent preferences will likely carry consequences for constituent evaluations of senators and citizen choices at re-election time.
Unanswered questions remain, even within the somewhat narrow confines of nomination politics. Recent research on accountability has demonstrated that it can be contextual. Dancey and Sheagley (Reference Dancey and Sheagley2016), for example, show that the ability of voters to correctly identify their senators’ votes decreases when senators vote more frequently against their party line, and that the connection between policy positions and evaluations by constituents is diminished among voters represented by such senators (see also Dancey and Sheagley, Reference Dancey and Sheagley2013; Fortunato and Stevenson, Reference Fortunato and Stevenson2019). Whether this heterogeneity in the pre-conditions for accountability extends to Supreme Court nominations is worthy of future study. In addition, it would be worthwhile to examine whether accountability differs significantly across Democrats and Republicans in the electorate, and whether there are differences in monitoring senators from one's own party and senators of the out-party.
Finally, another outstanding question is: what determines citizen preferences about Supreme Court nominees? Should one think of citizens as making rather sophisticated evaluations of the likely policy positions of nominees? Do citizens value nominee quality and qualifications? Or, do citizen rely primarily on cues from elite actors, particularly the president and interest groups, but also from senators themselves (Lenz, Reference Lenz2013; Stone, Reference Stone2020)? What we can say, however, is that whatever the origin of citizen preferences about nominees, they seem to have consequences, due to the fact that citizens hold senators accountable for their confirmation votes.
Supplementary material
The supplementary material for this article can be found at https://doi.org/10.1017/psrm.2022.21 and replication materials at https://doi.org/10.7910/DVN/JNVVHJ.
Acknowledgements
We thank Stephen Ansolabehere, Shiro Kuriwaki, and Georg Vanberg for helpful comments and suggestions, as well as seminar participants at Princeton's Center for the Study of Democratic Politics and the University of Toronto. We also thank Stephen Ansolabehere for providing us with the Harvard modules of the CCES from 2009 and 2010.


 Open access