


Unemployment, particularly among youth, is a major source of political instability and economic loss in the Middle East and North Africa (MENA).Footnote 1 How the international development community proposes to alleviate unemployment in MENA hinges on whether or not it sees political reform as a prerequisite. A vibrant political science literature on the Middle East sees the root causes of unemployment as political.Footnote 2 Civil war, state collapse, military blockades and occupations, and market meddling by authoritarians, all conspire to reduce competitive dynamism and depress job creation throughout the region. From this view, political reform is a prerequisite to economic improvement in the MENA region. But if there is one widely accepted lesson of the Arab Spring, it is that political reform is not likely to happen without considerable revolutionary violence, and so scholars and policymakers understandably hope for a route to economic improvement that does not insist on political reform.
Obligingly, a formidable economics literature on urban labor markets sees unemployment as the result of technical shortcomings, such as weaknesses in urban transit infrastructure that frustrate laborers from linking up to employers. From this view, political reform is not a prerequisite to economic improvement, and substantial headway can be made in alleviating unemployment in MENA through marginal, technical interventions, for example, by improving urban transit infrastructure. While the political theory of unemployment enjoys significant empirical support within MENA, the causal impact of infrastructural interventions has gone almost entirely unevaluated within the region.Footnote 3
In this paper I argue that, insofar as politics cause unemployment in MENA through the causal channels argued by the political literature, there will be consequences for the way in which marginal shocks to urban transit infrastructure impact unemployment. Specifically, the political literature emphasizes demand-side barriers, especially arising from political corruption and turmoil, that importantly deter employers and investors from creating jobs. Insofar as this holds true, it should tend to frustrate the kind of employment gains that infrastructure improvements are otherwise theorized to provoke. By the same token, localized deteriorations or interruptions to urban transit infrastructure should have an attenuated impact on unemployment, since employers can replace absentee commuters by drawing from the large preexisting pool of unemployed laborers.
I test this latter prediction by building a new geospatial dataset on the West Bank. Much like the broader MENA region in which it is embedded, the West Bank is home to a young, urban-peri-urban Arab population suffering high unemployment rates. As elsewhere in MENA, the unaccountable manner in which Palestinians are governed in the West Bank, along with uncertainty about the political future and occasional episodes of violence, plausibly discourage entrepreneurship and investment.Footnote 4 Among other empirical contexts, the West Bank furthermore possesses a unique confluence of spatio-temporally disaggregated data and a plausibly exogenous connectivity shock. In particular, during the 2000–2004 Palestinian uprising, the Israeli army built a separation wall and deployed hundreds of roadblocks and checkpoints along the West Bank's internal road network in an effort to defend Israeli settlements. While hostilities tapered down during 2005–2007, obstacles remained deployed as a conflict management device, but drew international condemnation for their disruptive effect on Palestinian society (World Bank, 2007; B'Tselem, 2007).
I pursue an instrumented (2SLS) first-differences strategy to assess the causal impact of Israeli army obstacles on Palestinian unemployment. I negotiate access (on-site only) to Palestinian censuses from 1997 and 2007, pre- and post-dating the advent of Israeli obstacle deployment, disaggregated down to the neighborhood level (N = 480). I build a geospatial dataset of the West Bank road network and neighborhood locations from UN data, then geo-reference and digitize a series of UN poster-maps to track the shifting locations of Israeli obstacles during 2003–2007. I calculate nighttime luminosity of Palestinian towns from satellite imagery to help estimate pre-obstacle Palestinian commuter flows. Since obstacles were deployed to defend Israeli settlements, I use the lengthwise proximity of Israeli settlements to Palestinian commuter routes as an instrument to quasi-randomize the blockadedness of Palestinian neighborhood. Numerous robustness checks support the validity of the instrument.
The results hinge on an empirical trick, unique to this study, of exploiting the projected asymmetric flows of Palestinian laborers to assess both the direct and indirect impacts of obstacles on unemployment. Since Palestinian unemployment levels were high on the eve of the Second Intifada (20 percent according to the 1997 census), I expect that multiple laborers were competing for the same small set of jobs. When obstacles were subsequently deployed, they should have had a direct, deleterious impact of obstructing some Palestinian laborers from accessing jobs. But in so doing, they should also have had an indirect, positive impact of reducing job competition for other Palestinians living on the “other side” of the obstacles. By exploiting pre-Intifada projected asymmetries in labor flow, I am able to recover separate point-estimates for both the obstructive (direct) and protective (indirect) effects within the same regression. This is the key difference between this paper and previous studies, which set up their regressions in a way that only allowed them to estimate the obstructive effect, all but guaranteeing that they would find that disconnectivity is bad (Calì and Miaari, Reference Calì and Miaari2018) and connectivity is good (BenYishay et al., Reference BenYishay, Trichler, Runfola and Goodman2018) for economic outcomes.Footnote 5
I find the point-estimates of both the obstruction and protection effects are statistically significant, oppositely signed, and of similar magnitude. Taken at face value, the results suggest 16,536 Palestinian laborers (3.50 percent of the labor force), mostly drawn from the urban periphery, lost their jobs via the obstruction channel, but 18,546 others (3.92 percent), mostly drawn from the Ramallah-Nablus urban core, gained jobs via the protection channel (Figure 6).
The results suggest that even in the West Bank, where the overall political milieu is the most plausible and first-order explanation for unemployment, marginal shocks to transit infrastructure still have a causal impact on unemployment. The nature of that impact, however, is more definitively spatio-distributional than aggregate. The deployment of Israeli checkpoints was, employment-wise, clearly a bane for some Palestinians (as Calì and Miaari (Reference Calì and Miaari2018) discovered), but also clearly a boon for other Palestinians of a similar order of magnitude (something that has not previously been acknowledged). As it happens, Ramallahites sometimes refer to other Palestinians commuting in from peripheral areas in a derogatory manner, resenting them for bidding down wages and displacing them from scarce jobs in the urban core.Footnote 6 The deployment of Israeli road obstacles would have tended to frustrate these commuters while relieving their more centrally located peers of unwanted competition.
Conversely, the results imply that removing those checkpoints, or paving roads and adding lanes or extensions, as USAID subsequently spent $900 million doing (BenYishay et al., Reference BenYishay, Trichler, Runfola and Goodman2018), will very likely succeed in altering the spatial distribution of Palestinian unemployment, displacing joblessness from one neighborhood to another. Whether such interventions would cause an overall reduction in Palestinian unemployment, however, is harder to say. My findings therefore do not support the kind of “win-win” rhetoric that often accompanies multi-million dollar infrastructure investments by the World Bank, USAID, or other international development institutions operating in the MENA region. Such projects promise to deliver aggregate economic gains on which my results cast significant doubt, while ignoring the significant countervailing impacts that my findings illuminate.
This is not the only study from this context to find spatio-distributional impacts. An older study by Angrist (Reference Angrist1996) exploiting temporal variation in border closures between the West Bank and Israel likewise found countervailing consequences for the labor market. A recent, exemplary empirical investigation by Getmansky et al. (Reference Getmansky, Grossman and Wright2019) finds a robust displacement effect on auto theft from northern to southern Israel during the construction phase of the separation wall. In contrast, studies finding level impacts to economic outcomes include those studying internal barriers to movement (the aforementioned studies of Calì and Miaari (Reference Calì and Miaari2018) and BenYishay et al. (Reference BenYishay, Trichler, Runfola and Goodman2018)); and others studying barriers to external trade (Amodio et al. (Reference Amodio, Baccini and Di Maio2021) on the West Bank, and Etkes and Zimring (Reference Etkes and Zimring2015) on Gaza).
1. Unemployment in MENA
Unemployment is currently a major problem in the MENA region. Relative to OECD countries, which in 2017 averaged 4.9 percent unemployment, MENA averaged 11.0 percent.Footnote 7 Among young people, who represent the region's future, the gap was much worse: 29.8 percent in MENA relative to 13.9 percent in the OECD. The problem appears not to be one of insufficient urbanization. Relative to Germany, the leading EU economy, where unemployment in 2017 was 4.2 and 76 percent of the population was urbanized, Jordan's unemployment rate was 13.4 percent (34 percent among youth) despite being more urbanized (84 percent).
In the Occupied Palestinian Territories, on which more later, urbanization is comparable to Germany (75 percent), yet unemployment reached 24.2 percent in 2017 (40.0 percent among youth). Moreover in all of these countries, unemployment has not declined with urbanization. Over the long difference 1991–2017, for example, Tunisia went from 38 to 67 percent urbanized, yet unemployment remained unchanged (14.4–14.6 percent) and youth unemployment increased (29.7–35.5 percent). Together, these figures imply rampant urban unemployment. This is a major problem for the region, not only because urban unemployment implies profound economic loss from forgone production, but also because it precipitates political violence and upheaval such as were observed during the Arab Spring.
1.1 An infrastructural explanation
A formidable economics literature on urban labor markets sees unemployment as the result of urban infrastructure deficiencies. This line of thinking dates back at least an half-century to John Kain's Reference Kain1968 article on “negro unemployment” in American inner cities, which formulated the puzzle of why some (inner-city) neighborhoods suffered high unemployment rates despite being located “in the midst of an otherwise robust metropolitan economy”.Footnote 8 The theoretical solution that emerged from this puzzle, which has been tested extensively in advanced capitalist economies, is that urban infrastructural failings exacerbate labor market frictions, frustrating employers and would-be employees from linking up.Footnote 9 The ensuing policy prescription is to make marginal infrastructural improvements within urban areas, such as paving roads, adding lanes to roads, extending commuter rails, and so on. Major development institutions such as the World Bank and USAID have adopted this line of reasoning to champion urban infrastructure projects in developing countries. Indeed, the World Bank has advised the governments of Turkey, China, India, and Nigeria, among others, to stimulate urban employment by improving urban transit.Footnote 10 The Bank has itself spent hundreds of millions of dollars funding urban infrastructure projects such as the Dar es Salaam Bus Rapid Transit System (BRT), a commuter rail for Nairobi, and urban road improvements for Kabul.Footnote 11 Within the MENA region, USAID in recent years spent 900 million dollars to improve the West Bank's internal road network (BenYishay et al., Reference BenYishay, Trichler, Runfola and Goodman2018). Likewise, China's “belt and roads” initiative recently established a research center in Egypt, indicative of its interest in pursuing infrastructural improvements within MENA.Footnote 12
1.2 A political explanation
On the other hand, a vibrant political science literature traces the MENA region's urban unemployment woes, and its economic problems more generally, to pervasive political maladies. Aside from the most obvious political causes of economic disaster, such as civil war (Yemen, Syria), state failure (Libya), or military blockade (Gaza, see Etkes and Zimring, Reference Etkes and Zimring2015), this literature sees the political origins of unemployment even in more stable parts of the region. Limited access orders, such as Morocco, Algeria, pre-revolutionary Tunisia, Egypt, Jordan, and all of the Gulf states, purchase political stability through a mixture of repression and co-option, where the latter often involves anti-competitive laws and practices that benefit cronies of the regime at the expense of competitive dynamism (Sahnoun et al., Reference Sahnoun, Keefer, Schiffbauer, Sy and Hussain2014; Cammett et al., Reference Cammett, Diwan, Richards and Waterbury2015). Indeed, recent micro-empirical studies have provided evidence of crony capitalism's market-distorting effects in pre-revolutionary Tunisia (Rijkers et al., Reference Rijkers, Freund and Nucifora2017), Egypt (Diwan et al., Reference Diwan, Keefer and Schiffbauer2014), and Lebanon (Diwan and Haidar, Reference Diwan and Haidar2020).
Across all of these studies is a consistent view that political circumstances cause unemployment in MENA by depressing the demand side of the labor market. That is to say, despite an abundance of cheap labor, political circumstances alter the calculus of entrepreneurs and investors in the MENA region, deterring them from creating jobs. The literature suggests at least three causal channels by which politics depress demand for labor. First, there may simply be laws and policies that distort the labor market: “In the Arab region, the policies and laws that regulate the labour market hinder the growth of jobs in a manner that matches demographic growth and the needs of the market” (UNDP, 2016). In Ben Ali's Tunisia, for example, Rijkers et al. (Reference Rijkers, Freund and Nucifora2017) document how sectors where firms connected to the dictator's family operated were more heavily regulated in ways that stifled competition. In Egypt, Springborg (Reference Springborg2017) explains in detail how the military involves itself in every major industry, monopolizing by force or delegating production to regime cronies. As a recent World Bank report concludes, “policies that stifle competition and create an uneven playing field abound in MENA and are a major constraint on private sector growth and job creation” (Sahnoun et al., Reference Sahnoun, Keefer, Schiffbauer, Sy and Hussain2014). Second, these laws may be unevenly applied, in a way that creates uncertainty. Indeed, the World Bank has found that firms in Egypt, Morocco, Lebanon, and Jordan, report uncertainty over the discriminatory and politically motivated application of industrial policy as a “severe” or “major” obstacle to growth (Sahnoun et al., Reference Sahnoun, Keefer, Schiffbauer, Sy and Hussain2014). Finally, the prospect of civil war, foreign invasion, uprisings, and other forms of political upheaval discourage investment. Indeed, capital flight from politically uncertain places is a well-documented phenomenon.Footnote 13
1.3 Testable implications
According to the infrastructural theory, transit infrastructure shocks impact the supply of labor from residential neighborhoods to commercial centers. But according to the political theory, demand for that labor is anemic for political reasons orthogonal to transit infrastructure. Insofar as the political theory applies, then, unemployment will be high to begin with (before infrastructure shocks). Any subsequent marginal interruption to transit infrastructure will marginally decrease labor supply to commercial centers. But since labor is already over-supplied, firms will simply replace their absentee commuters with others drawn from the large pool of preexisting unemployed laborers. This act of substitution implies countervailing spatio-distributional impacts: some neighborhoods suffer employment losses, while others enjoy employment gains. Every transit interruption, therefore, is predicted to have the following effects:
Prediction 1 (the obstruction effect): A marginal increase to neighborhood j's transit costs of accessing commercial centers reduces neighborhood j's employment rate.
Prediction 2 (the protection effect): A marginal increase to neighborhood k's transit costs of accessing commercial centers raises neighborhood j's employment rate.
Prediction 3 (attenuated net effect): the local protection effects partially offset the local obstruction effects, attenuating the overall net effect on the economy's employment rate toward zero.Footnote 14
2. Data and identification
2.1 Context
2.1.1 The West Bank as a spatial economy
The West Bank (Figure 1) is a very small territory, sandwiched between coastal Israel on its northern, southern, and western borders, and Jordan to its east, running about 56 km (34.8 miles) at its widest and about 133 km (82.6 miles) at its lengthiest, roughly 1/4 the area of New Jersey. As a result, every single Palestinian neighborhood in this study lies within 25 road-kilometers (15.5 miles) of both a Palestinian commercial center and an Israeli border crossing. Among the 2 million West Bank Palestinians interviewed for the 2007 census, 61 percent of employed laborers reported working in neighborhoods different from their neighborhoods of residence, with 14 percent working in Israel, implying an active commuter economy. The same census registered only 6.8 percent of laborers employed in agricultural activities.

Figure 1. Israeli road obstacles in the West Bank circa December 2007.
2.1.2 The Second Intifada and mobility restrictions
The latter 1990s saw minimal violence (see Figure 2) between Israelis and Palestinians as the Oslo peace process appeared poised to deliver a political resolution to the decades-old conflict. Relevant to this study, the 1997 census was taken during this period of calm, when violence had reached its lowest point in at least a decade. The failure of the Camp David talks in 2000, however, swiftly led to a general uprising or “intifada”. In contrast to the grassroots-led First Intifada (1987–1991), Palestinian militant factions led the Second Intifada (2000–2004) with suicide bombings and conventional militant attacks. Security forces of the Palestinian Authority (PA) abandoned security cooperation with Israel to join the fray, and Israel openly attacked PA infrastructure. As Figure 2 depicts, this period delivered the highest death tolls of the last 30 years. An average of 200 Israelis and 330 Palestinians were killed per year during 2001–2004, with 385 Israeli casualties and 627 Palestinian casualties in 2002 alone.The Israeli army responded to militant activity with both offensive retaliations and defensive efforts aimed at intercepting militants before they could reach Israeli civilian destinations. This latter policy was known as “Operation Defensive Shield”, and involved the deployment of numerous physical obstacles (Calì and Miaari, Reference Calì and Miaari2018; Weide et al., Reference Weide, Blankespoor, Rijkers and Abrahams2015). A 500 km wall was built to separate Israel from the West Bank, but most Israeli settlers, numbering close to 200,000Footnote 15 by this time, dwelt beyond the wall and could not rely upon it for protection. Instead, the army deployed hundreds of obstacles inside the West Bank, along the internal road network, in order to intercept militant traffic before it could approach Israeli settlements:

Figure 2. Fatalities in the West Bank and Israel, 1987–2015, excluding Gaza. Data source: B'Tselem (www.btselem.org).
Israel's primary justification for the movement restrictions is that they are necessary to protect Israelis within its jurisdiction and Israelis living in the West Bank or traveling on West Bank roads.
...the settlement enterprise, including the roads built for it, was one of the primary factors in shaping the restrictions regime that Israel has forced on the Palestinians since the beginning of the Second Intifada.
(B'Tselem, 2007)
[Israel] is considering a plan to remove all of the checkpoints in the northern West Bank area between Jenin and Nablus [because]... there are few settlements in need of protection.
(Wikileaks, 2005)
Consistent with their defensive purpose, obstacles did not forbid civilian commuting between neighborhoods, but introduced significant delays as vehicles were checked for weapons:
I saw the soldiers were carefully checking a Palestinian taxi. They dismantled the seats, the door panel and many other parts of the taxi. They spent a lot of time inspecting it...
(B'Tselem, 2007)
...[a checkpoint near Nablus] continues to inspect 100 percent of travelers into/out of Nablus and does not generally permit passage of private cars...
(Wikileaks, 2007)
2.1.3 Decline of violence, persistence of obstacles post-uprising
By January 2005, Palestinians were weary of the violence and destruction, and elected President Mahmoud Abbas on a mandate to cease hostilities and restore rule of law. Israeli-Palestinian security cooperation was revitalized, and training and equipment were provided to the Palestinians via the US State Department (Abrahams, Reference Abrahams, Berman and Lake2018). The Fatah-Hamas schism in 2006–2007 notwithstanding, Palestinian fatalities declined from 199 in 2004 to 84 in 2007, while Israeli fatalities declined from 69–40 to 21–10 across 2004–2007. By December of 2007, the uprising was long since over, and PA enumerators were back on the streets to take a second census. Thus, the censuses used in this paper are both drawn from periods of relative calm. This should assuage concerns of violence-induced measurement error and concerns over violence as a confounding factor in regression analysis. Even so, I pursue an instrumental variables strategy described below and additionally show robustness checks where I include fatalities data at the neighborhood-year level to prove their orthogonality to the main findings.
Despite the decline in violence, most obstacles remained in position, as evident from Figure 1, which was true in December 2007. As such, obstacles may properly be viewed as conflict management devices whose use persisted well past the end of hostilities. Their presence, however, drew international condemnation for their disruptive effects to Palestinian mobility (World Bank, 2007; B'Tselem, 2007).
2.2 Census data
Over an eight-month sojourn in the West Bank, the author was able to negotiate on-site access to Palestinian population censuses from 1997 to 2007 and a firm census from 2004 disaggregated to the neighborhood level.
2.2.1 Descriptive statistics
Table 1 lists aggregate descriptive statistics from the censuses. I define labor force using the conservative, classical definition, as the number of laborers employed or searching for work. I therefore exclude from the labor force those who report they are not available to work because they are instead studying, doing house chores, too old, disabled, or on pension. I define employment the way the census does, including everyone who reported working at all in the week prior to the census. This includes wage earners, unpaid family members, and self-employed. The census includes no category for formal/informal employment, probably because, given widespread tax evasion practices, it would be hard to elicit reliable answers from respondents. One can, however, consider unpaid family members and the self-employed as likely informal. Theoretically, all of these modes of employment receive remuneration of some kind, and the dollar value of that is what “wage” means in my theoretical conception. I revisit these categorizations in the robustness checks (see the technical appendix).
Table 1. Palestinian West Bank: summary of Census Data 1997, 2007

Due to an Arabic grammatical ambiguity in available responses to the 1997 census question on place of work, the commuting rate to Palestinian neighborhoods is erroneously inflated to 74.0 percent.
With these concepts defined, the employment rate is simply the number of employed laborers divided by the labor force, multiplied by 100.Footnote 16 Notice that employment rates in the West Bank were very low both pre- and post-uprising (80.9 and 85.1 percent), reflecting the Palestinian economy's chronic malaise in the absence of a political solution. Unemployed laborers can obtain benefits from the PA, itself largely funded by international donor aidFootnote 17, or from international organizations such as the UN's World Food Program.
Sectorally, the West Bank profiles as a low-skill urban services economy reminiscent of urban economies embedded in natural resource exporter nations a la Gollin et al. (Reference Gollin, Jedwab and Vollrath2016). The exported resource in this case is low-skill labor: after the West Bank's capture in 1967, Palestinians largely gave up agrarian livelihoods in favor of commuting to Israel to work in low-skill urban jobs, especially in the construction sector (Hilal, Reference Hilal1976). In addition to revenues from this exported labor, Palestinians are among the world's highest per-capita recipients of international aid. Most of this aid is channeled through the PA, which passes it on either by employing Palestinians as public servants, or by offering unemployment benefits. These revenues are then spent inside the West Bank on food (produced locally and in Israel) and non-food items (mostly imported), with minimal local manufacturing (AIX Group, 2013).
2.2.2 Census neighborhoods
Since individuals cannot be tracked across the censuses, I use census neighborhoods as the unit of observation for regression analysis. The PCBS defined 659 distinct West Bank Palestinian neighborhoods in the 1997 census, then collapsed them to just 524 neighborhoods in the 2007 census. I use the PCBS's merge rule to match 1997 and 2007 neighborhoods.Footnote 18 From among these, I remove the so-called Jerusalem-1 neighborhoodsFootnote 19 since PCBS surveyors were forbidden access. Ultimately, I am able to match 480 out of 524 Palestinian neighborhoods, comprising 99.5 percent of the (non-J1) West Bank 1997 labor force. These neighborhoods are depicted as green dots/circles in Figure 1.
The reader should note that PCBS neighborhoods vary considerably in size. All of downtown Hebron, for example, constitutes a single neighborhood according to the PCBS definition. On the other hand, what might broadly be referred to as Ramallah is more finely delineated by the PCBS as Al-Bireh, Qaddura Camp, Beituniya, and so on. There are at least two consequences of this for regression analysis. First, statistical confidence of employment statistics varies with the number of observations per neighborhood, so it is important to weight these observations accordingly.Footnote 20 Second, one might be concerned that the number of neighborhoods (N = 480) is artificially inflated wherever the PCBS has delineated neighborhoods too finely, leading to unduly narrow confidence intervals around point-estimates. Accordingly, all regressions below use a clustering scheme that partitions the 480 neighborhoods into 310 supra-neighborhoods jointly agreed upon by the PCBS and World Bank as part of a poverty mapping exercise.
2.2.3 Percentage-point change in employment
The main dependent variable is percentage-point change in employment between 1997 and 2007 for each neighborhood, henceforth $\triangle \% {\rm employ}$ . The first line of Table 2 lists descriptive statistics for $\triangle \% {\rm employ}$
 . The variable exhibits considerable negative and positive variation. There are some outliers (− 62.12 percent), so in the regression analysis, I perform a robustness check using only the 25th to 75th percentiles of $\triangle \% {\rm employ}$
 . The spatial histogram of $\triangle \% {\rm employ}$
 (see the technical appendix) suggests that there are no obvious employment trends that may be driving the paper's main findings. I do not, for example, observe any clear systematic employment gains among core neighborhoods versus peripheral neighborhoods, and this visual impression is confirmed moreover in robustness checks using governorate-level trends (see the technical appendix).
Table 2. Summary statistics of main regression variables

Note: the endogenous variables $\triangle {\rm obstruction}$ , $\triangle {\rm protection}$
 , and instruments $\triangle iv\_{\rm obstruction}$
 , $\triangle iv\_{\rm protection}$
 are normalized to means of 1.0 to make regression point-estimates easy to compare.
2.3 Independent variables
2.3.1 UN maps
As of September 2003, the United Nations Office of the Coordination of Humanitarian Affairs (UN-OCHA) began publishing poster-sized maps depicting the precise locations of obstacles along the West Bank's internal roads. Through to the end of 2007, a total of 11 posters were published.Footnote 21 I georeference all 11 poster-map pdfs and digitize all obstacles (6,180 obstacles plus the separation barrier), superimposing the new data over the poster imagery. Figure 1, for example, displays the digitized December 2007 map, where more than 500 internal obstacles were deployed beyond the 500 km wall.
Not all obstacles were the same. While checkpoints were manned by soldiers and could not be passed without inspection, the UN also identifies “partial checkpoints”, which had all the appearance of checkpoints yet rarely interfered with passing traffic. Unmanned obstacles included “roadblocks”, usually giant boulders set in the middle of roads by army bulldozers; or “earthmounds”, described as mounds of dirt dumped in the middle of roads by bulldozers. UN-OCHA reports that earthmounds were a particularly ineffective type of obstacle, since Palestinian traffic usually circumvented them with ease, or drove over them repeatedly until they flattened out. Although results are similar with their inclusion, I exclude earthmounds, partial checkpoints, and incomplete sections of the separation wall from the regression analysis in order to reduce attenuation bias.
Not all obstacles stayed in the same place. Indeed, at any given time, some 40 percent of checkpoints were temporarily, “flying” checkpoints (World Bank, 2007), set up suddenly along road segments with the intention of surprising militants. While UN-OCHA faithfully recorded obstacle locations, their maps amount to a series of snapshots that necessarily miss day-to-day variation. As described below, my instrumental variables approach greatly mitigates this source of attenuation bias by isolating the subset of obstacles deployed in the immediate vicinity of settlements. Settlements required perpetual defending, so obstacles in the vicinity of settlements were most likely to have been enforced with permanent vigilance.
2.3.2 Obstruction and protection
I now generate two treatment variables: $\triangle {\rm obstruction}$ and $\triangle {\rm protection}$
 . $\triangle {\rm obstruction}$
 quantifies the degree to which Palestinian laborers dwelling at a given census neighborhood are blockaded from accessing jobs at other neighborhoods. $\triangle {\rm protection}$
 , on the other hand, quantifies the degree to which the laborers of each Palestinian census neighborhood are protected from the inflow or through-flow of competing laborers. Figure 3 illustrates this distinction. In the left panel, a checkpoint obstructs residents of village #1 from accessing jobs in the business district. In the right panel, a checkpoint protects residents of village #1 from the throughflow of competing laborers from village #2 to the business district.Implicit in Figure 3 is an asymmetric flow of commuter traffic: laborers residing in village #1 are trying to reach the business district; they are not trying to reach village #2 because there are no jobs there. In the data, however, there are 480 neighborhoods, each of which is home to some laborers and some firms; there is no single “business district” neighborhood, and there are few purely residential neighborhoods. Business does tend to concentrate, however, along a central spine of the West Bank in major towns suchas Hebron, Ramallah, Nablus, while most other neighborhoods are small villages and towns that contain a few convenience stores, butcheries, coffee shops, but are largely residential. I could defensibly define our “business district” as a small set of major towns (the ten governorate capitals, e.g.), which would be equivalent to weighting the commercial importance of these towns as 1 and all other towns as 0. I prefer, however, to follow the lead of Ahlfeldt et al. (Reference Ahlfeldt, Redding, Sturm and Wolf2015), weighting each neighborhood k by its share of total business activity m k. A natural way of estimating m k would be with firm census data, but unfortunately the PCBS conducted a firm census only in 2004, when firm counts were already potentially reacting to obstacle deployment. So although as a robustness check, I do run the main regressions using firm counts from the 2004 census (Table 5), I prefer in the absence of pre-uprising neighborhood-level firm data to estimate m k by radiance-calibrated nighttime lights satellite imagery from the year 2000, on the eve of the Second Intifada.

Figure 3. Obstructive and protective effects of a checkpoint. In the left panel, laborers dwelling in Village #1 are obstructed from jobs in the Business District. In the right panel, laborers dwelling in Village #1 enjoy reduced competition for jobs in the Business District as laborers from Village #2 are obstructed.
Table 5. Effects of obstacles on $\triangle \% {\rm employ}$ using 2004 firm census to define treatment

Robust standard errors are clustered using 310 clusters determined by poverty mapping teams at the World Bank and PCBS. ***, **, and * indicate statistical significance at the 1, 5, and 10 percent levels, respectively.
The relationship between Defense Meteorological Satellite Program (DMSP) nighttime lights imagery and economic activity is well documented in other studies (most notably Henderson et al., Reference Henderson, Storeygard and Weil2012), so I exploit that relationship here: I assume the brightness of Palestinian towns at night corresponds to their business activity, and calculate m k as k's share of total light emanating from Palestinian neighborhoods. I obtain UN polygon data of each Palestinian neighborhood accurate to 2005.Footnote 22 I assign the light of each pixel to a neighborhood if the pixel's centroid lies inside the neighborhood's polygon. To correct for the imagery's blurring problems, I apply a novel deblurring technique developed in Abrahams et al. (Reference Abrahams, Oram and Lozano-Gracia2018). Inspecting the deblurred image, I find that the five brightest neighborhoods were Al-Khalil (Hebron), Nablus, Yatta, Tulkarm, and Jenin.Footnote 23 Unsurprisingly, four of these are governorate capitals, but Yatta is not. Likewise, Adh-Dhahiriya is the 8th brightest town, and Dura is the 11th, yet neither is a governorate capital. Without lights data, I would risk overlooking these important commercial centers.
Whereas Figure 3 only shows one road to reach the business district, the real road network interconnecting the 480 census neighborhoods allows many different commuting paths. Emulating Ahlfeldt et al. (Reference Ahlfeldt, Redding, Sturm and Wolf2015), I assume that laborers traveled the path of minimal road distance (pre-uprising) to reach their destinations. For each origin-destination pair (j, k), I find the shortest sequence of roads (pre-uprising) by writing a Python script to operate ArcMap's Network Analyst software. I record the road distances as d jk. With the same Python script, I then count the number of obstacles subsequently deployed along the shortest road sequence of each (j, k) pair, obtaining ${\rm num\_obstacles}_{jk}$ . Note that obstacles do not always appear in the same neighborhood in all 11 maps, so I weight each obstacle by the duration of months for which its map was valid.
I define a preliminary variable $\triangle {\rm obstruction}\_{\rm naive}_{j}$ as the average of ${\rm num\_obstacles}_{jk}$
 across all destinations k, weighting each destination k with its pre-uprising share of the economy's business m k, and inverse-weighting each destination by its pre-uprising road distance from j:

Inverse weighting by d jk satisfies the intuition that laborers were unlikely to travel too far to work, so the subsequent deployment of obstacles along paths to far-distant neighborhoods was probably irrelevant. Indeed, in both censuses, more than 90 percent of commuters report that their workplace and residence are in the same governorate, which implies road journeys of no more than 30 km (see also Calì and Miaari, Reference Calì and Miaari2018). Meanwhile, weighting Equation 1 by m k satisfies the intuition that the harmfulness of obstacles increases in the importance of the destination. For example, in the right panel of Figure 3, laborers from village #1 have no desire to travel to village #2 because #2 has no business (m 2 = 0), so the deployment of a checkpoint between #1 and #2 is harmless to #1.
I define $\triangle {\rm protection}_{j}$ similarly, but weight each origin k by its pre-uprising share of the economy's labor force n k:

Weighting 2 by n k satisfies the intuition that the benefit of obstacles increases in the quantity of laborers they “keep out”. So in the right panel of Figure 3, laborers from village #1 benefit from the deployment of a checkpoint between #1 and #2, but the benefit is smaller if the number of laborers dwelling in #2 is smaller. Note that the way I have defined $\triangle {\rm protection}_{j}$ is correct under the assumption that the road structure is linear (Figure 3). Following the lead of most models in the urban economic literature (all models in Zenou (Reference Zenou2009), e.g.), I assume a linear road structure, with the commercial district at the end of a line of neighborhoods (Figure 3). According to that structure, laborers should be unhappy if an obstacle is placed “in front” of their neighborhood, obstructing them from accessing jobs, but should be delighted if an obstacle is placed “behind” their neighborhood, reducing the in-/through-flow of other laborers. $\triangle {\rm protection}_{j}$
 is defined to capture exactly this intuition. By contrast, if the road structure were a “star” (“hub and spoke”) network, with each neighborhood enjoying its own unique road by which to access the commercial center, then the present definition of $\triangle {\rm protection}_{j}$
 would be inadequate. In particular, it would measure merely the degree of blockadedness on roads between (residential) neighborhoods—roads that should on average be irrelevant to commuter access to the commercial center. In that case, in the analysis below, I would expect the point-estimate on $\triangle {\rm protection}_{j}$
 to be a noisy zero. As I shall see, however, this is not at all the case.
The definition of $\triangle {\rm obstruction}\_{\rm naive}$ misses an important fact: 21.6 percent of Palestinian laborers commuted daily to Israel pre-uprising (see Table 1). As a result, obstacles subsequently deployed along roads leading to border crossings may have had an important obstructive effect ignored by $\triangle {\rm obstruction}\_{\rm naive}$
 . To address this issue, I identify from the UN-OCHA maps 10 border crossings (Green-line Checkpoints) along the 1967 armistice line. I calculate for each Palestinian neighborhood j the closest border crossing by road. I calculate the pre-uprising percentage of j's labor force employed in Israel:

I now augment $\triangle {\rm obstruction}\_{\rm naive}$ with Israel-bound traffic, weighting the Palestine-bound and Israel-bound parts by $( 1 - {\rm work}\_{\rm isr}_{j, 1997})$
 and ${\rm work}\_{\rm isr}_{j, 1997}$
 , respectively:

Figure 4 depicts spatial histograms of $\triangle {\rm obstruction}$ and $\triangle {\rm protection}$
 . Notably, there is a healthy amount of variation in obstruction and protection across urban and peri-urban areas of the West Bank. This is important for causal identification. Indeed, since there are only two time periods for the analysis, I cannot eliminate each location's employment trend (although I do eliminate governorate employment trends). The persistence of location employment trends constitutes a threat to identification. If, for example, there was a trend in the 1990s and 2000s to relocate economic activity in the West Bank from its peripheral areas to its urban cores (Nablus, Ramallah, Hebron, etc.), then I would expect to see employment losses in peripheral locations outpacing employment losses in “central”, urban areas—a pattern that substantially mirrors what I find when testing for the impact of obstacles. Fortunately, the deployment of obstacles did not neatly divide the West Bank's core and periphery. As can be seen from Figure 4, there is substantial variation in both obstruction and protection across peripheral and central areas. As might be expected, relatively central locations in the vicinity of Nablus are lightly obstructed from access to commercial areas, but heavily protected from competing labor inflows. The same goes for locations to the north of Hebron. On the other hand, locations immediately north of Ramallah are not substantially protected, nor are locations north of Nablus. Neither are locations along the periphery of the West Bank uniformly obstructed—from Ramallah south to Bethlehem locations are both heavily obstructed and protected, but further north into Tulkarm and Salfit, there are many lightly obstructed peripheral locations.
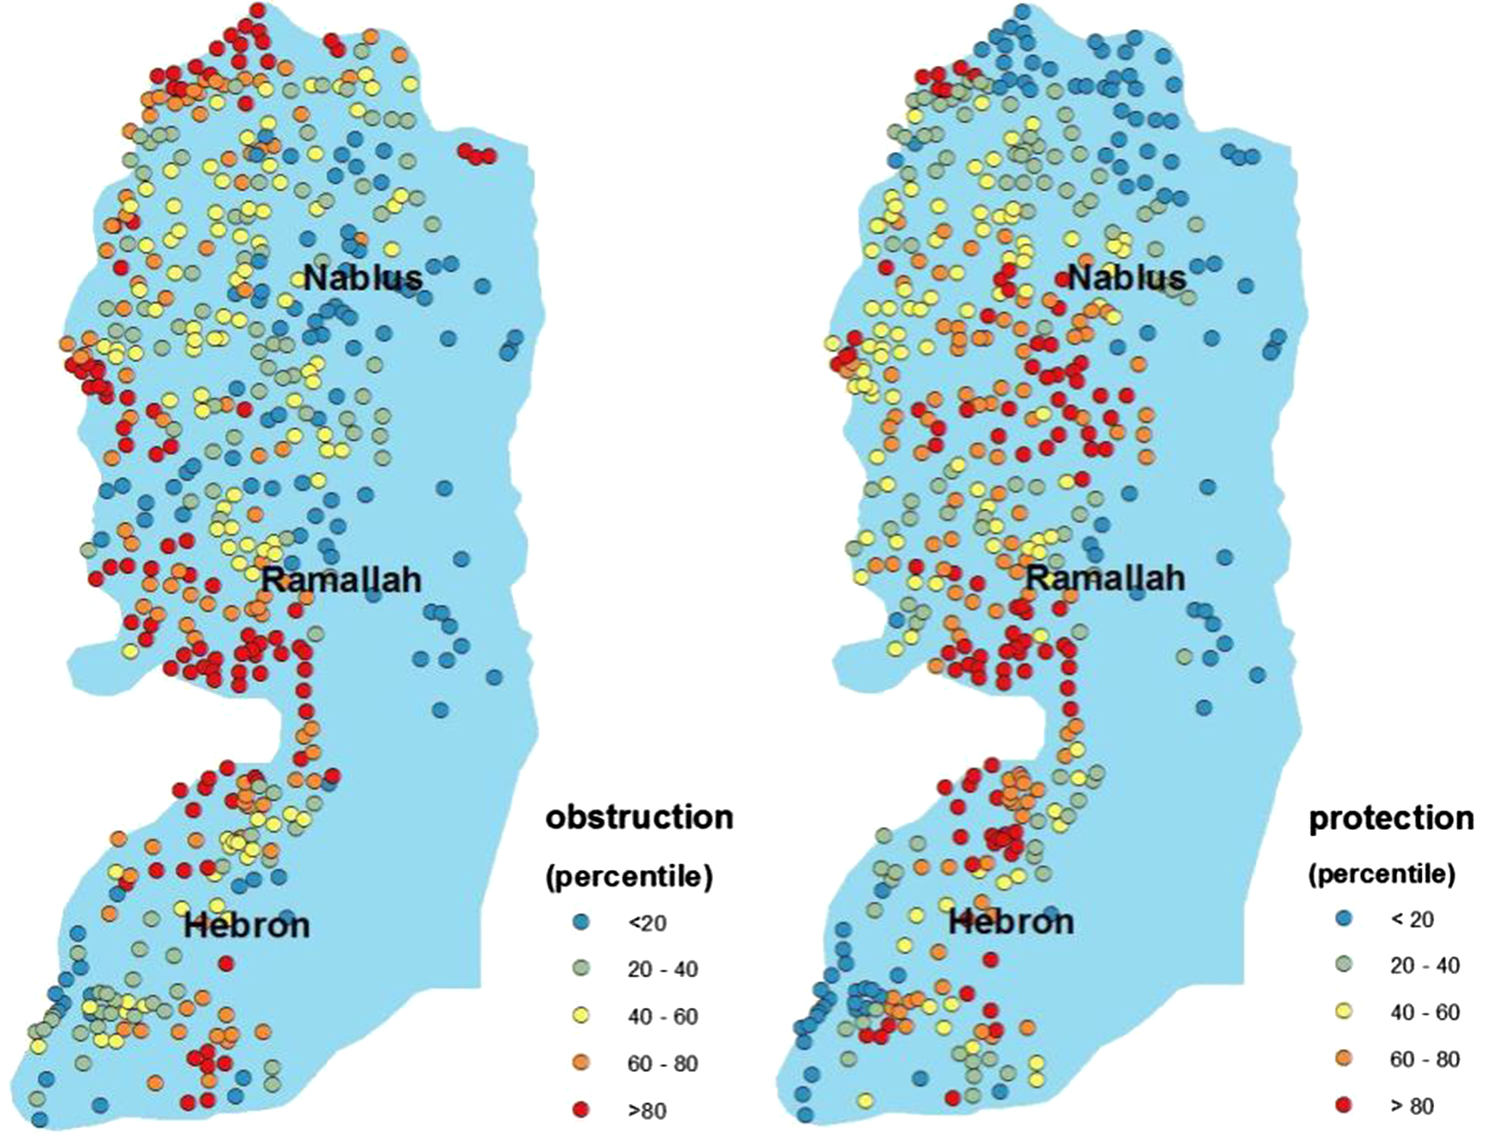
Figure 4. Spatial histograms depicting each Palestinian neighborhood's degree of obstruction and protection as a result of obstacle deployment.
2.4 Instruments
My intention is to regress $\triangle \% {\rm employ}$ on $\triangle {\rm obstruction}$
 and $\triangle {\rm protection}$
 . The central identification challenge is that the deployment of obstacles may not be random with respect to the employment prospects of Palestinian neighborhoods. For example, Miaari et al. (Reference Miaari, Zussman and Zussman2014) present evidence that Palestinian West Bank neighborhoods with lower employment rates engaged more frequently in violence during the Second Intifada. If the Israeli army subsequently deployed obstacles to blockade violent neighborhoods, a correlation will appear between employment changes and blockadedness that has nothing to do with our thesis.To guard against such endogeneity issues, I develop an instrumental variables approach based on the aforementioned narrative that obstacles were deployed to protect Israeli settlements. Figure 5 displays UN-OCHA polygon data of settlements from 2005. Most settlements are effectively commuter suburbs of Jerusalem, the largest among them being Ma'ale Adumim, located at the West Bank's midsection, just east of Jerusalem. A few settlements are ideologically oriented, such as Kiryat Arba'a and nearby settlements inside the Old City of Hebron, near the Tomb of Abraham. Finally, there are several large agricultural settlements in the Jordan Valley. Since the army intended to protect settlements, obstacle deployment should be predictable by settlement neighborhood. In particular, the army would have enforced defensive buffer zones around settlements, intercepting all Palestinian traffic passing close to settlements. Figure 5 demonstrates this concept for a fictional pair of Palestinian neighborhoods, “origin” and “destination”. Since two Israeli settlements lie near the connecting road, Palestinian commuter traffic from “origin” cannot help but pass through the settlements’ buffer zones on their way to “destination”. The intersecting road segments, colored dark blue, are where Palestinian commuters faced a high likelihood of being detained and searched. How wide were these buffer zones likely to have been? Arbel et al. (Reference Arbel, Ben-Shahar, Gabriel and Tobol2010) document housing price fluctuations in the West Bank Israeli settlement of Gilo after incidents of gunshot attacks by Palestinian militants at a maximum range of 650 m. As depicted in Figure 5, I set buffer width to 500 m, then identify all segments of road intersecting buffer zones around settlements.Footnote 24 Along the shortest pre-uprising path between every (j, k) pair, I then calculate the total length ${\rm len}\_{\rm seg}_{jk}$
 of all road segments lying inside buffers on the path from j to k. For each neighborhood j, I can then define the instruments


The instrument's exclusion condition is stated as follows: the proximity of Israeli settlements to Palestinian travel routes, while evidently predictive of subsequent blockadedness (Table 3), should not have affected the evolution of Palestinian neighborhoods’ employment rates via any other causal channel.

Figure 5. Instrumental variables strategy. I use the lengthwise proximity of Israeli settlements to Palestinian pre-uprising commuter paths as a predictor for these paths’ subsequent blockadedness.
Table 3. First stage

Robust standard errors are clustered using 310 clusters determined by poverty mapping teams at the World Bank and PCBS. ***, **, and * indicate statistical significance at the 1, 5, and 10 percent levels, respectively.
Table 4. Main results, effects of obstacles on $\triangle \% {\rm Employ}$

Robust standard errors are clustered using 310 clusters determined by poverty, mapping teams at the World Bank and PCBS. ***, **, and * indicate, statistical significance at the 1, 5, and 10 percent levels, respectively.
This condition could potentially be violated if, for example, the lengthwise proximity of settlements to travel routes were correlated with settlements’ proximity to Palestinian neighborhoods themselves. I know from studies like Arbel et al. (Reference Arbel, Ben-Shahar, Gabriel and Tobol2010) that the lengthwise proximity of a settlement to a Palestinian neighborhood could precipitate violence, which could prompt not only obstacle deployment but also security raids and curfews, all potentially resulting in employment loss. Moreover, settlements were employers of a small minority of Palestinian laborers (see Table 1), so the lengthwise proximity of settlements surely corresponded with their ease of access and could plausibly have affected the evolution of employment rates. In robustness checks below, I offer evidence that these alternative channels operate orthogonally to the instruments and have no bearing on the results.
3. Results
3.1 Main specification
I test for countervailing obstructive and protective effects of obstacles on the long-difference percentage-point change in employment of Palestinian neighborhoods, post-uprising (2007) relative to pre-uprising (1997). The main specification is a two-stage least squares (2SLS) first-differences regression of $\triangle \% {\rm employ}$ on $\triangle {\rm obstruction}$
 and $\triangle {\rm protection}$
 , instrumenting with $\triangle iv\_{\rm obstruction}$
 and $\triangle iv\_{\rm protection}$
 , respectively. The second stage is therefore the regression of percentage-point change of employment for each neighborhood j = 1,..., 480, on instrumented values of j's obstruction and protection, controlling for governorate-level trends and neighborhood-level covariates:

While the first stage regressions are

and

According to the testable predictions, I expect to observe a negative obstructive effect β1 < 0 and a positive protective effect β2 > 0. Governorate trends trendgov(j) and neighborhood-level covariates $\triangle X_{j}$ are included only for the sake of precision. I show that the point-estimates of β1 and β2 are statistically significant even when these covariates are excluded, and their values do not change in a statistically significant way when these covariates are included.
3.2 First stage results
Table 3 confirms the strength of the instruments as predictors of the endogenous regressors. All regressions in all tables below are heteroskedasticity-robust, and observations are clustered by World Bank/PCBS poverty clusters and weighted by 2007 labor forces.Footnote 25
In the first column, first row, I see that $\triangle iv\_{\rm obstruction}$ is a strong positive predictor for $\triangle {\rm obstruction}$
 even after controlling for $\triangle iv\_{\rm protection}$
 and accounting for governorate-level trends and obstacle/wall and settlement proximity trend dummies at 0–1, 1–2, …, 9–10 km radial bands. The F-test of excluded instruments is 44.88, far beyond the usual significance threshold of 10. Similarly, in column 2, I see that $\triangle iv\_{\rm protection}$
 is a strong positive predictor of $\triangle {\rm protection}$
 even after controlling for other covariates, and the F-test of excluded instruments is 36.19. I conclude the instruments are very strong. Column 3 adds various controls to column 1's specification, corresponding to alternative hypotheses discussed and tested below. In particular, I control for change in the percentage of laborers employed on Israeli settlements or employed by the PA; the per-capita net-immigration of laborers from other neighborhoods; the percentage net increase in firms operating locally; the change in incidence of local residential renting; and the per-capita fatalities of Palestinian civilians and militants per neighborhood for each year, 2000–2007. The point-estimate on $\triangle iv\_{\rm obstruction}$
 is basically impervious to the inclusion of these covariates. Likewise, column 4 adds these same controls to column 2's specification, and the point-estimate on $\triangle iv\_{\rm protection}$
 is negligibly impacted. These findings, together with the robustness checks below, suggest the instruments succeed in isolating exogenous variation in obstacle deployment.
3.3 Main results
The paper's main results are presented in Table 4. In column 1, coefficients on the treatment variables $\triangle {\rm obstruction}$ and $\triangle {\rm protection}$
 are both significant at the 1 percent level and are signed negatively and positively, in agreement with our predictions. Since the treatment variables are normalized to an average value of 1.0, the coefficients can be compared, and I find that the positive marginal effect of a unit increase in $\triangle {\rm protection}$
 nearly cancels out the negative marginal effect of a unit increase in $\triangle {\rm obstruction}$
 . Indeed, at this level of precision, the values $\hat {\beta _{1}} = -3.756$
 and $\hat {\beta _{2}} = 3.507$
 are statistically indistinguishable. I generate fitted values to quantify the aggregate effect of obstacles on employment rates:

I plot the results in Figure 6. Consistent with the predictions, obstacles tended to cause employment loss in peripheral areas of the West Bank, but to raise employment in core neighborhoods, especially around Hebron and in the Nablus-Ramallah zone. I can use these fitted values to calculate the number of laborers losing or gaining jobs per neighborhood. The sum of these is what I call the “aggregate” employment effect of obstacles, in the sense that it aggregates together the obstructive and protective effects, and moreover aggregates across neighborhoods. I should remind the reader, however, that the “true”, national aggregate effect of the obstacle policy is unknowable; for that, I would require a counterfactual West Bank by which to compare. With that caveat in mind, I find in aggregate that obstacles slightly increased employment 0.42 percent (statistically indistinguishable from zero), as the obstructive effect (− 3.50 percent) was entirely washed out by the protective effect (3.92 percent). Column 2 of Table 4 repeats the main specification of column 1, but leaves out the obstacle and settlement proximity trend dummies. The point-estimates on $\triangle {\rm obstruction}$ and $\triangle {\rm protection}$
 remain statistically significant, and their values do not change by even a 1/2 standard deviation. This result demonstrates that the inclusion of obstacle and settlement trend dummies is just for the sake of precision; the results do not depend on their inclusion.Footnote 26 Judging by the 16-percentage-point decline in R 2 from columns 1–2, however, these proximity trend dummies capture important variation in employment rate changes. The relevance of obstacle proximity to labor market trends was pointed out in Calì and Miaari (Reference Calì and Miaari2018), so the R 2 shift between columns 1 and 2 is consistent with that. One plausible mechanism for this is that the proximity of obstacles radicalizes Palestinians (as in Longo et al., Reference Longo, Canetti and Hite-Rubin2014) and then this radicalization trend affects employment rate trends, leading to the large R 2 change between columns 1 and 2. What is clear by looking at the point-estimates on $\triangle {\rm obstruction}$
 and $\triangle {\rm protection}$
 in columns 1 and 2, however, is that these other causal channels and findings are orthogonal to the thesis on the obstructive and protective effects of obstacles. Whether or not I control for these proximity trend dummies, the results of the main story are robust. Column 3 of Table 4 presents the results of regressing $\triangle \% {\rm employ}$
 on the endogenous regressors $\triangle {\rm obstruction}$
 and $\triangle {\rm protection}$
 (without instrumenting). Qualitatively the results are similar, but precision on the coefficient of $\triangle {\rm protection}$
 is slightly lower, likely due to attenuation bias associated with flying checkpoints. Column 4 repeats column 3's regressions, but without the proximity trend dummies. Results are virtually unchanged. Column 5 presents the reduced form results of regressing $\triangle \% {\rm employ}$
 directly on the instruments $\triangle iv\_{\rm obstruction}$
 and $\triangle iv\_{\rm protection}$
 , while column 6 repeats this regression without the proximity trend dummies. Results are statistically significant and do not significantly attenuate with the inclusion/exclusion of proximity trend dummies.
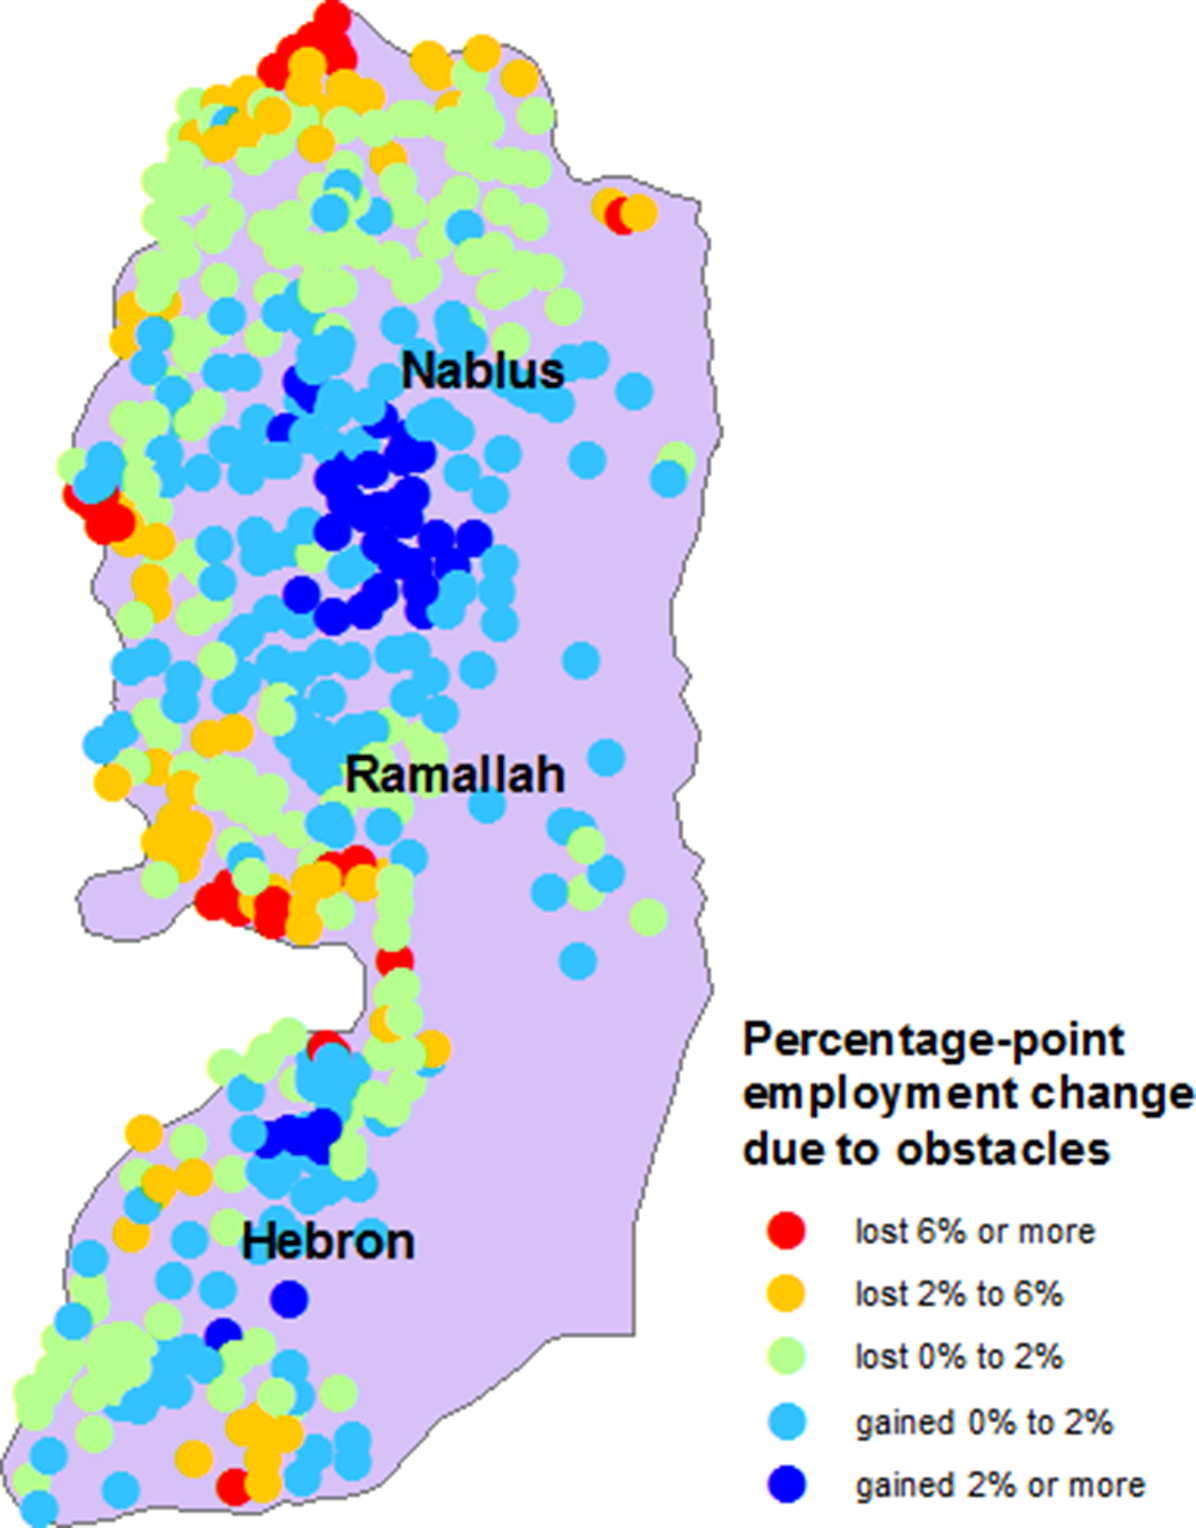
Figure 6. These fitted values from the main regression (Table 4, column 1) suggest that obstacles inflicted employment losses in the periphery but employment gains in the core.
3.4 Robustness: firm counts instead of radiance
Readers skeptical of the use of pre-uprising nighttime lights as a proxy for pre-uprising commercial density m k should consider Table 5, where I estimate each m k by k's share of open firms in the 2004 census. The main worry with this specification is that by 2004 firms may already have begun to open or close in response to obstacle deployment. For this reason, I prefer to rely on lights for the main results, but I am encouraged by how the main findings are echoed in Table 5. Notably, I continue to find statistically and magnitudinally significant countervailing effects. I also note the role of the instrument in mitigating attenuating bias: the OLS first-differences regression in column 3 yields a statistically insignificant point-estimate for the coefficient on $\triangle {\rm protection}$ , but once I instrument for this with $\triangle iv\_{\rm protection}$
 in column 1, I achieve significance at the 10 percent level. Reduced-form regressions in columns 5 and 6 show the instruments are robustly predictive. I refer the reader to the online appendix for further robustness checks.
4. Conclusion
Unemployment runs rampant across the MENA region, and is associated with widespread economic discontent and political instability. Some scholars and policymakers, consistent with the chants of millions of Arab Spring protesters, have concluded that the region's economic woes are largely symptomatic of deeper political problems. According to this view, political reform, up to and including regime overthrow, is a prerequisite of economic development. On the other hand, the prevailing modus operandi of the international development community, including institutions such as the World Bank or USAID, is not to undertake a confrontational approach demanding radical political reform, but instead to partner with the region's autocratic regimes to pursue marginal technocratic improvements to economic infrastructure, such as road infrastructure improvements. This course of action implicitly assumes that meaningful economic progress can be made without directly confronting the political status quo.
That assumption, however, has little causally identified empirical evidence to draw upon from within the region. On the contrary, the best empirical work in the region has come from the political science and political economy literatures, which identify causal links from authoritarian laws and practices to economic misery. Relevant to the issue of road infrastructure, those studies suggest that authoritarian laws and practices in the MENA region cause unemployment by depressing demand for labor. If true, this should imply that supply-side shocks to the labor market, such as are caused by road infrastructure shocks, should have large distributional effects but attenuated “net” consequences.
To shed light on these issues, I build a geospatial dataset of the West Bank, a territory notorious for its intractable political problems. Indeed, the political circumstances are so depressing to economic growth that Palestinian unemployment stands at 20 percent even before road infrastructure is interrupted by Israeli road obstacles. When obstacles are subsequently deployed, I show that unemployment rises in some neighborhoods while falling in others as firms substitute between different pools of labor.
The findings affirm the enduring influence of economic infrastructure, even in circumstances where politics are thought to be the primary cause of economic misfortune. Based on the findings, I should expect that if the United Nations were to lobby to remove Israeli obstacles, or similarly if international development institutions like the World Bank or USAID were to undertake marginal interventions to pave roads, add lanes, and so on, they should feel optimistic that such infrastructural interventions would have an impact on economic outcomes like unemployment. The results suggest, however, that the nature of that impact would be to create winners and losers of a similar order of magnitude, and to displace unemployment across neighborhoods. The “net” or overall impact of such interventions on unemployment—let alone welfare—is an open question. The findings therefore offer little support for the “win-win” rhetoric accompanying many infrastructural projects. Instead, the economic development community ought to expect that the demand-side causes of unemployment identified by the political literature will have consequences for the efficacy of infrastructural shocks, in particular attenuating the overall net impact while exacerbating spatio-distributional impacts. Economic infrastructure evidently matters in the Middle East, as it does in the more traditional stomping grounds of development economics (South Asia and sub-Saharan Africa). But the influence of this infrastructure on economic outcomes in the Middle East is complicated by the political milieu. Scholars may yet show that there exists a route to economic improvement in the MENA region that avoids political reform and the revolutionary violence that often attends it. But the burden of proof seems high, and time is running short.
Supplementary material
The supplementary material for this article can be found at https://doi.org/10.1017/psrm.2021.8.


