Introduction
Since time immemorial humans have relied on the use of natural resources such as water, forest products, grazing land, firewood and bushmeat. Bushmeat, derived from wild animals, is an important source of cheap protein for African and Latin American societies, and in some countries (e.g. Liberia) up to 75% of total meat consumed is derived from wild animals (Anstey, Reference Anstey1991; Barnett, Reference Barnett2000; Rao & McGowan, Reference Rao and McGowan2002). Extensive use of bushmeat has been documented from the tropical forests of West and Central Africa (Barnes, Reference Barnes2002; Fa et al., Reference Fa, Currie and Meeuwig2003; Wilkie et al., Reference Wilkie, Malcolm, Kate, Ernestine, Paul and Ricardo2005; Edderai & Dame, Reference Edderai and Dame2006). Although the issue has received less attention in the wildlife rich savannah and miombo woodlands of East and Southern Africa, studies suggest that illegal hunting has become a serious problem for wildlife managers because of growing demand for bushmeat, burgeoning human populations (the populations of Kenya and Tanzania increased from 6 and 8 million, respectively, in 1950 to 34 and 38 million, respectively, in 2005) and increasing commercialization of the bushmeat trade (Edroma & Kenyi, Reference Edroma and Kenyi1985; Dublin et al., Reference Dublin, Sinclair, Boutin, Anderson, Jago and Arcese1990; Campbell & Hofer, Reference Campbell, Hofer, Sinclair and Arcese1995; Barnett, Reference Barnett2000; UN, 2005). In Tanzania partially protected areas (IUCN category ≥ IV) appear to be particularly affected by illegal bushmeat hunting (Caro et al., Reference Caro, Pelkey, Borner, Campbell, Woodworth and Farm1998) combined with high rates of habitat degradation (Pelkey et al., Reference Pelkey, Stoner and Caro2000). Consumer preferences respond largely to meat prices (Wilkie & Godoy, Reference Wilkie and Godoy2001; Apaza et al., Reference Apaza, Wilkie, Byron, Huanca, Leonard and Perez2002) and increases in household income appear to drive a shift in preference from bushmeat to the meat of domesticated animals (Albrechtsen et al., Reference Albrechtsen, Fa, Barry and Macdonald2005), indicating that it is the poor that rely mostly on bushmeat. However, there is also an increasing trend for a preference for bushmeat by the affluent elite in urban areas (Barnett, Reference Barnett2000).
In addition to wildlife, fish is also a vital source of animal protein in Sub-Saharan Africa (FAO, 2004), in which the great lakes of East Africa, Lake Victoria, Tanganyika and Nyasa, play a key role. However, several studies report that catches are declining because of overexploitation, pollution and environmental degradation (e.g. through introduction of exotic species such as water hyacinth Eichhornia crassipes; Matsuishi et al., Reference Matsuishi, Muhoozi, Mkumbo, Budeba, Njiru and Asila2006; Balirwa, Reference Balirwa2007). On the Kenyan side of Lake Victoria the Nile perch Lates niloticus fishery declined from a peak of 115,000 tons in 1999 to 57,000 tons in 2004, mainly due to lack of enforcement of fishing regulations and lack of involvement of local stakeholders in fisheries management, leading to overexploitation (Njiru et al., Reference Njiru, Nzungi, Getabu, Wakwabi, Othina, Jembe and Wekesa2007). Similar declines from over-harvesting have also been noted for fish species such as Nile tilapia Oreochromis niloticus and the indigenous cyprinid (dagaa) Rastrineobola argentea (Matsuishi et al., Reference Matsuishi, Muhoozi, Mkumbo, Budeba, Njiru and Asila2006; Njiru et al., Reference Njiru, Nzungi, Getabu, Wakwabi, Othina, Jembe and Wekesa2007). The overexploitation of fish resources in Lake Victoria also has negative consequences for the many human communities along the shores of the lake, who are increasingly using smaller gill nets, and in some instances illegal and destructive fishing practices, to meet household needs (Balirwa, Reference Balirwa2007).
In West Africa fish and bushmeat exploitation is linked, with low regional supplies of fish causing an intensification of bushmeat hunting (Brashares et al., Reference Brashares, Arcese, Sam, Coppolillo, Sinclair and Balmford2004). However, the direction of the linkage is controversial (Rowcliffe et al., Reference Rowcliffe, Milner-Gulland and Cowlishaw2005; Wilkie et al., Reference Wilkie, Malcolm, Kate, Ernestine, Paul and Ricardo2005). These studies suggest that unsustainable fishing and deterioration of the resource base in Lake Victoria may have severe implications for local human communities and for wildlife within the bordering protected areas. There is therefore a need to assess the relationship between fish and bushmeat resources in the Lake region and their role in human welfare.
In this study we contribute to the analysis of how socio-economic factors affect the linkage between fish and bushmeat consumption by comparing villages that have access to animal protein both from the inland freshwater system of Lake Victoria and the savannah of Serengeti National Park, Tanzania. We focus on how the seasonal availability of high densities of migratory herbivores, the distance to the protein resources, income, household size and education affects the choices made by consumers about which type of animal protein they consume.
Study area
This study was conducted in the north-west of Serengeti National Park (Fig. 1) during March–December 2006. The 14,763 km2 Park, the largest in Tanzania, is bordered to the west by Ikorongo Game Reserve (c. 563 km2), Grumeti Game Reserve (c. 416 km2) and the Ikoma Open Area (c. 600 km2), which act as buffer zones between the Park and villages. The common large resident herbivores in the area include giraffe Giraffa camelopardalis, buffalo Syncerus caffer, topi Damaliscus korrigum and impala Aepyceros melampus. The western corridor (Fig. 1) of the Park is characterized by the annual wildebeest Connochates taurinus migration, which in June–August passes northwards through the partially protected village areas (Thirgood et al., Reference Thirgood, Mosser, Tham, Hopcraft, Mwangomo and Mlengeya2004). In addition to migratory herbivores there is also a resident population of wildebeest in the western corridor that move towards Lake Victoria during the wet season (December–May; Maddock, Reference Maddock, Sinclair and Norton-Griffiths1979). However, the population sizes of the resident herbivores in the reserves are relatively low, probably because of high levels of illegal bushmeat hunting (Campbell & Hofer, Reference Campbell, Hofer, Sinclair and Arcese1995; Rusch et al., Reference Rusch, Stokke, Røskaft, Mwakalebe, Wiik, Arnemo and Lyamuya2005).
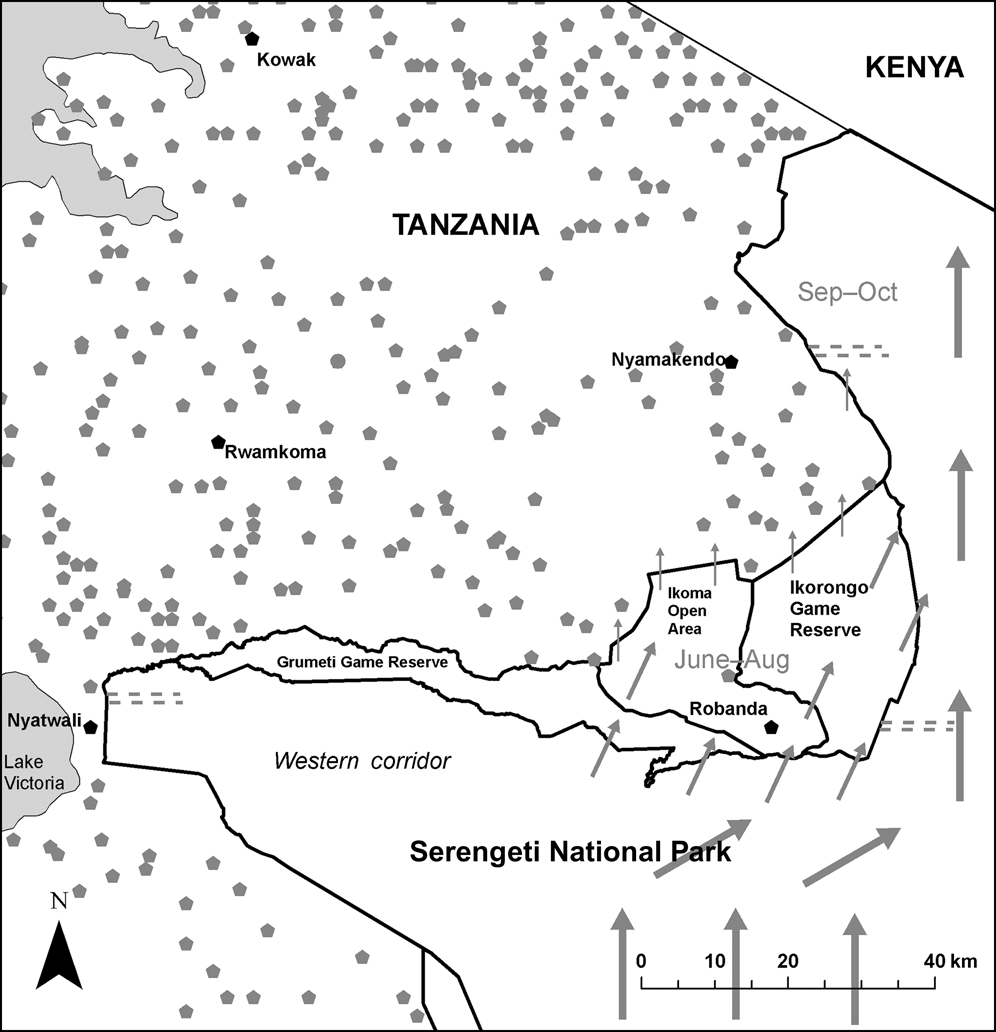
Fig. 1 Protected areas in the western Serengeti (with grey symbols representing villages) and the five study villages (black symbols). The transect locations close to Nyatwali, Nyamakendo and Robanda are shown as grey dashed lines. Arrows illustrate the various wildebeest migratory routes, with arrow size approximately proportional to wildebeest abundance. On their northward migration wildebeest use parts of the western corridor, as well as the partially protected and village areas, depending upon the rainfall pattern.
Human population density is high (70 people km-2) in the north-western Serengeti, with an annual growth rate of 2.5% over 1988–2002 (URT, 2002). The economy of local communities is mainly based on subsistence farming and livestock husbandry. However, erratic rainfall, poor soils and tsetse fly infestation makes farming and keeping livestock difficult, and alternative sources of protein are therefore vital. For the villages adjacent to Lake Victoria fishing is important, and fish species such as Nile perch, tilapia and the small indigenous cyprinid dominate the catch. Fishing is mainly with small gill nets from dugout canoes throughout the year. Fishing in Lake Victoria is not legally restricted and there is no limitation on the number of boats or gears used (Cowx et al., Reference Cowx, van der Knaap, Muhoozi and Othina2003). In addition to fish, many of the subsistence farmers and livestock keepers living around the Park also rely on bushmeat hunting for food security and income generation (Holmern et al., Reference Holmern, Røskaft, Mbaruka, Mkama and Muya2002; Loibooki et al., Reference Loibooki, Hofer, Campbell and East2002; Kaltenborn et al., Reference Kaltenborn, Nyahongo and Tingstad2005). Both fishing and hunting are solely male occupations (Arcese et al., Reference Arcese, Hando, Campbell, Sinclair and Arcese1995).
Outside the Serengeti National Park, within the bordering Ikorongo and Grumeti Game Reserves and the Ikoma Open Area, trophy hunting and some legal hunting by local residents occurs. Legal offtake is low because quotas are set conservatively (Holmern et al., Reference Holmern, Johannesen, Mbaruka, Mkama, Muya and Røskaft2004). Illegal bushmeat hunting in the area is widespread and hunters mainly originate from the local communities to the west. The majority of illegal hunters arrested in the protected areas come from villages within 45 km of the closest protected area (i.e. the Serengeti National Park or a Game Reserve) boundary (Campbell & Hofer, Reference Campbell, Hofer, Sinclair and Arcese1995; Holmern et al., Reference Holmern, Muya and Røskaft2007). The main hunting method is wire snares (Arcese et al., Reference Arcese, Hando, Campbell, Sinclair and Arcese1995; Holmern et al., Reference Holmern, Mkama, Muya and Røskaft2006). Bushmeat is commonly sun-dried before being transported by foot, and is used for home consumption, for sale to generate income and/or to barter for other commodities (Loibooki et al., Reference Loibooki, Hofer, Campbell and East2002; Kaltenborn et al., Reference Kaltenborn, Nyahongo and Tingstad2005). An estimated 53,000 people are involved in illegal hunting, including both hunters and porters who transport the meat out of the protected areas (Loibooki et al., Reference Loibooki, Hofer, Campbell and East2002). The annual offtake from the Serengeti ecosystem has been estimated at c. 160,000 animals annually or c. 11,950 t of meat (Hofer et al., Reference Hofer, Campbell, East, Huish, Taylor and Dunstone1996).
Methods
Data collection
Five villages were selected along a gradient of distance from the boundary of Serengeti National Park. Of these, Robanda, Nyamakendo and Nyatwali are within 10 km of the Park boundary, and Nyatwali is also near Lake Victoria (Fig. 1). Thirty households were randomly selected from the list of households in each village office. Household was defined as including all people living permanently there (where we used last name to identify temporary visitors). Every household was visited once per month (in March–December 2006) to encompass the peak of the migration period. Households were requested to produce data on the number of meals that consisted of meat, fish and vegetables during the week preceding the visit. Weekly visits to villages were rotational to avoid the biases of monthly salary dates, which normally occur within the last week of each month or the first week of the next month, during which household purchasing power may increase.
During the pre-testing of the questionnaire it was noted that most households were unable to remember the amount of meat (in kg) they had bought or consumed and in some cases butchers did not have weighing machines and relied on estimates. Moreover, in most local markets, fish were sold individually or as bulk, and sometimes sold per volume using specified containers. We therefore collected information solely on the number of meals of fish or meat. Several questions were asked before talking about meat consumption. This was important because of the sensitivity of this subject. We initially attempted to differentiate between legal meat and illegal bushmeat but found it was not possible because of deep reluctance among the respondents to talk about bushmeat hunting. However, a significant proportion of meat consumed in rural Africa is usually bushmeat (Barnett, Reference Barnett2000). Every household member was allowed to enter the discussion as a particular person may not remember the number and type of meals eaten in the previous 7 days and/or may not be at home every day. Children were encouraged to join the discussion because in most cases they were at home and partook in every meal. Relying partly on responses from children to obtain an unbiased result has been used previously (Haule et al., Reference Haule, Johnsen and Maganga2002). The questionnaire also included general information on the household size (number of people), age of respondents, sex, occupation status, education level, number of livestock (physically counted in the boma) and monthly household income (the average estimated from 3 consecutive months’ income).
To investigate the relationship between the number of meat meals consumed and influx of migratory herbivores two parallel 10 km transect lines (1 km apart) were established in each of the village areas of Robanda, Nyamakendo and Nyatwali (Fig 1). Transect counts were conducted once per month for 10 months, 3 hours after and before dawn and dusk, respectively. All large herbivores (the targeted species of illegal bushmeat hunting) sighted within 200 m either side of a vehicle were recorded by two observers for subsequent density calculation. We excluded elephants Loxodonta africana because they are not usually killed for bushmeat. For analysis the animals were separated into two groups according to their seasonal movement within the ecosystem. The migratory group included wildebeest, zebra Equus burchelli, eland Taurotragus oryx and Thomson's gazelle Gazella thomsoni; other herbivores were grouped as resident. All transects were driven from the Park boundary towards the interior of the Park.
Statistical analyses
Differences between samples were tested using non-parametric tests because of non-normal distributions, and we used the Pearson correlation coefficient to explore any correlations of household size and wealth (income, cattle and goats/sheep) on meat and fish consumption. We used linear mixed models to account for the spatial pseudo-replication of households within villages and to explore the variables influencing the number of household meat and fish meals, with village as a random effect (Crawley, Reference Crawley2002). The predictor variables were livestock numbers, distance to resource (in km), household size, monthly income and education level (none, primary, secondary/college). For the analysis of fish meals the distance to resource was calculated from the lake shore. Because the use of stepwise multiple regression in ecology has several drawbacks (Whittingham et al., Reference Whittingham, Stephens, Bradbury and Freckleton2006) we used an information theoretic approach that allows for several competing models to describe the data. We evaluated the strength of evidence for a model based on the Akaike Information Criterion corrected for small samples (AICc) following Burnham & Anderson (Reference Burnham and Anderson2002), where the most parsimonious model (i.e. lowest AICc) was selected as the best model. We computed Akaike weights (ωi) to compare the relative performance of models rather than their absolute AICc value. The Akaike weight indicates the probability that the model is the best given the data and the set of candidate models. Thus the strength of evidence in favour of one model (M1) over another (M2) is simply the ratio of their Akaike weights (AICcωratio = AICcωM1/AICcωM2). We also ranked the importance of variables by summing the Akaike weights (Burnham & Anderson, Reference Burnham and Anderson2002). Analyses were performed using SPSS v. 14.0 (SPSS, Chicago, USA) and R v. 2.3.0 (R Development Core Team, 2006).
Results
Generally, the five villages had similar socio-economic characteristics (Table 1). The number of meat meals were higher close to the Park boundary (Kruskal-Wallis H = 85.2, df = 4, P=0.0001) and villages close to Lake Victoria had the highest number of fish meals (Kruskal-Wallis H = 79.9, df = 4, P = 0.0001). Household size had a negative effect on fish consumption in Nyatwali (r = -0.372, n=30, P=0.043) but positively influenced consumption of fish in Rwamkoma (r=0.370, n = 30, P=0.040). In Nyamakendo meat consumption was positively correlated with number of livestock owned by the household (r=0.497, n=27, P=0.030). In Kowak there was a significant positive correlation between income and meat consumption (r=0.521, n=30, P=0.003). All other correlations of household size and household wealth (cash income, cattle, goats/sheep) with meat and fish consumption were non-significant.
Table 1 Household size and annual income, distance from the closest point on the Park boundary and Lake Victoria, and inhabitants' education level and occupation, in the five surveyed villages (Fig. 1).

Households close to the Park boundary but far from Lake Victoria consumed more meat and less fish during the influx of migratory herbivores (Fig. 2). Mean weekly household meat consumption in Robanda, Nyatwali and Nyamakendo increased as the densities of migratory herbivores increased (Robanda: r = 0.920, P < 0.001; Nyatwali: r = 0.711, P=0.021; Nyamakendo: r=0.953; Fig. 2 a–e), and fish consumption was negatively correlated with the densities of migratory herbivores close to Robanda and Nyamakendo (Robanda: r=-0.684, P=0.029; Nyamakendo: r=-0.684, P = 0.030) but not to Nyatwali (r p = 0.538, P = 0.109). In all three villages mean household fish consumption was uncorrelated with the densities of resident herbivores (Robanda: r=-0.289, P=0.418; Nyatwali: r=-0.293, P=0.412; Nyamakendo: r=0.260, P=0.464).
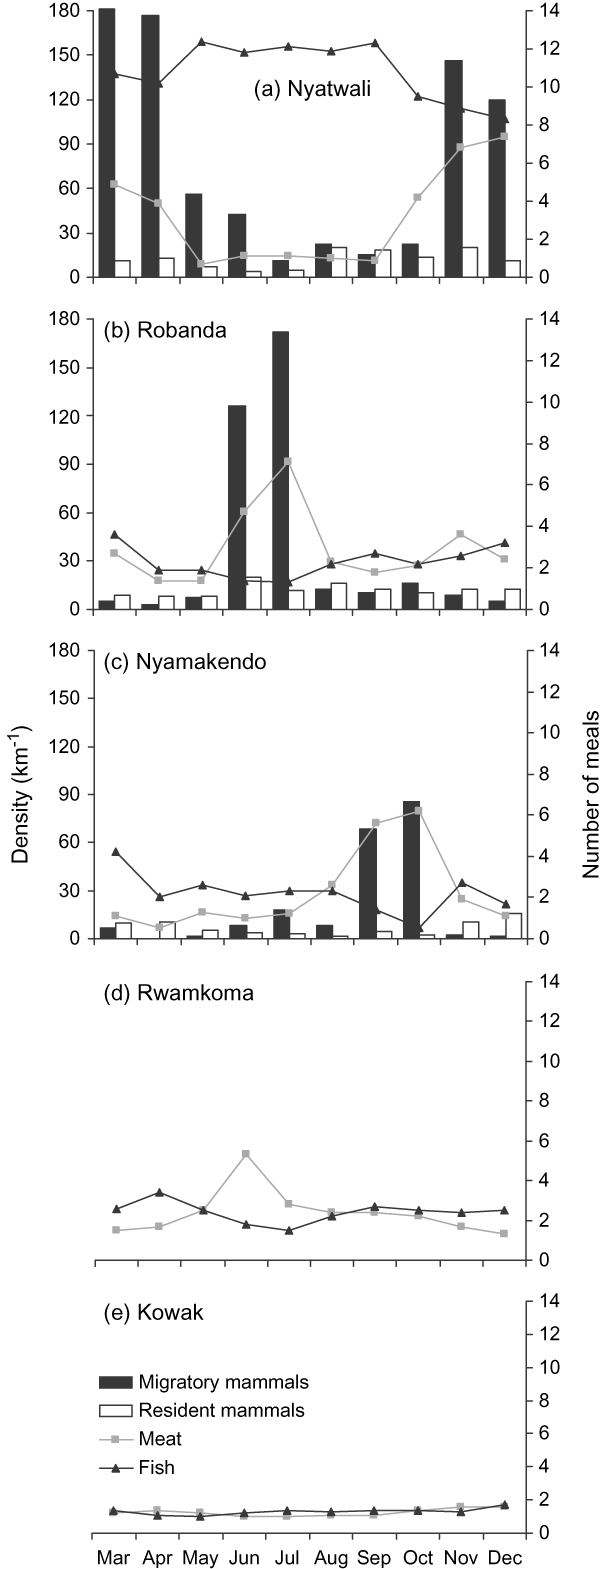
Fig. 2 Mean monthly migratory and resident herbivore densities and mean meat and fish meals consumed per week in the five surveyed villages (Fig. 1) during March–December 2006.
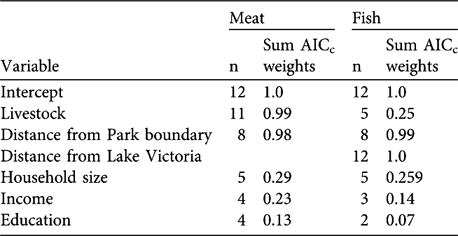
In the analysis of meat consumption two models had a Δ AICc < 2 (Table 2). The most parsimonious model included the variables livestock and distance to the National Park boundary; meat consumption increased with increasing livestock numbers and decreased with distance to the Park (Tables 2–3). The predictor variables in the most parsimonious model also ranked high in relative importance when we summed AICc weights over all models in which the variables appeared (Table 4). In the analysis of fish consumption there were also two models that had a Δ AICc < 2. The most parsimonious model included both distance to Lake Victoria and distance to the Park boundary. Both increasing distance from Lake Victoria and the Park boundary reduced the number of fish meals in households; these variables also ranked high in relative importance (Table 4).
Table 2 Set of 12 candidate models for explaining the number of meat and fish meals (during 10 months) in the five surveyed villages (Fig. 1). The models are ranked by the Akaike Information Criterion corrected for small samples (AICc). The most parsimonious model is at the top of each list. Analyses are based on a total of 147 households in the five villages.
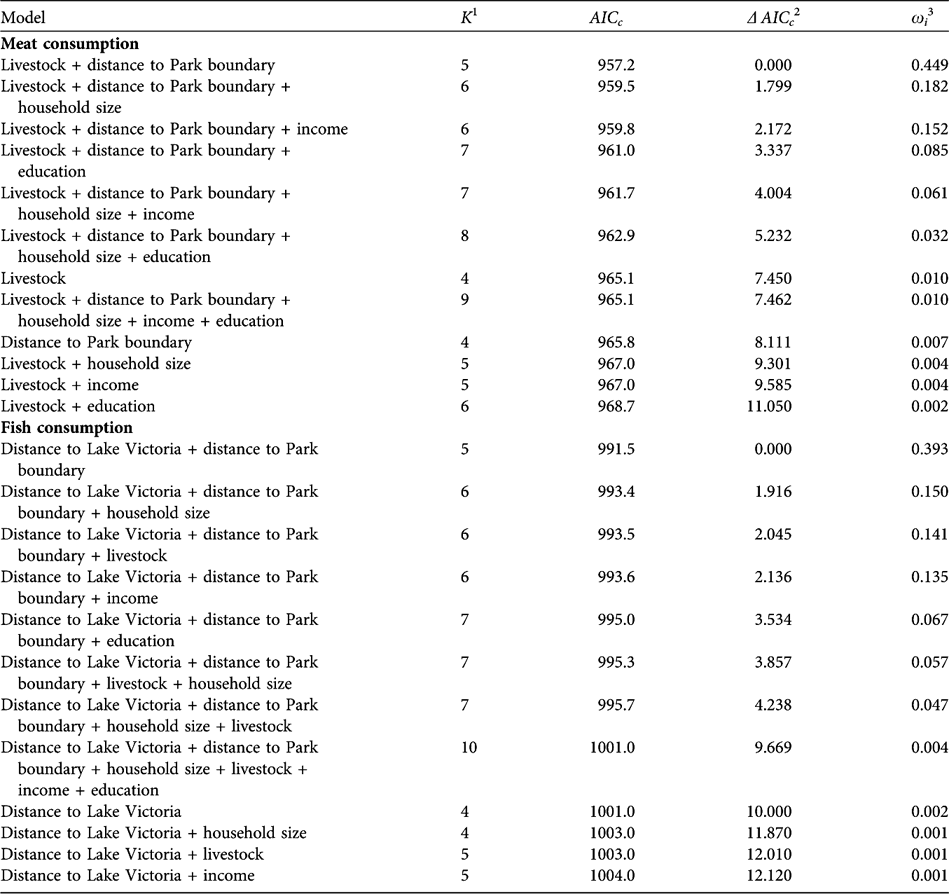
1 K, number of parameters
2 Δ AICc, difference in AICc between the best model and the actual model
3 ωi, Akaike weights
Table 3 Parameter estimates for the most parsimonious model of factors affecting the number of meat and fish meals. β, SE, t and P denote the regression coefficient, standard error, t-value and the significance level, respectively. For further details see Table 2.
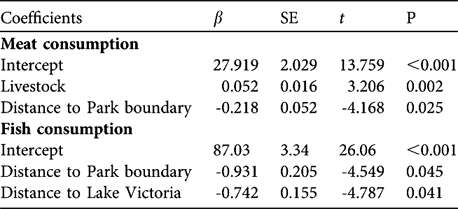
Table 4 Variables used in the linear-mixed models for meat and fish meals and their ranking according to their cumulative AICc weights. The ranking was based on the 12 models included in the candidate set (Table 2) and n denotes the number of models in which the respective variables appear. The sum of AICC weights was calculated across all models in the confidence set where the variable was present.
Discussion
The Serengeti ecosystem contains large populations of both migratory and resident mammalian herbivores, but the resident species are found at low densities close to human settlements (Campbell & Hofer, Reference Campbell, Hofer, Sinclair and Arcese1995). In the dry season (June–October) the wildlife migration is close to communities in the western Serengeti and it is therefore not surprising that the availability of migratory herbivores has a large impact on meat consumption levels. An exception to this pattern is the village of Nyatwali bordering Lake Victoria, where high consumption levels were observed mainly in the wet season (November–April), probably due to the seasonal movement of resident wildebeest inside the Serengeti National Park. Our results indicate that increased supply of fish did not seem to reduce consumption of meat when this was readily available and that income did not influence consumption levels. Our results also suggest that increased fish supply, by itself, is not likely to reduce bushmeat consumption if bushmeat is easily available.
Although our data cannot distinguish between legal and illegal sources of consumed meat, the positive correlation between influx of migratory herbivores and the mean number of meat meals consumed in the villages close to the National Park boundary suggest increased utilization of bushmeat during this period. This interpretation is further supported by other studies that show that rural residents rely to a large extent on bushmeat for most of their animal protein (Barnett, Reference Barnett2000; Fa et al., Reference Fa, Currie and Meeuwig2003; Albrechtsen et al., Reference Albrechtsen, Fa, Barry and Macdonald2005). One of the study villages (Robanda) is included in the Serengeti Region Conservation Program game cropping scheme but this operation has low quotas that are unlikely to have affected our results (Holmern et al., Reference Holmern, Røskaft, Mbaruka, Mkama and Muya2002, Reference Holmern, Johannesen, Mbaruka, Mkama, Muya and Røskaft2004). Because few residents have a licence to hunt we assume that the excess meat consumed in the villages close to the National Park during the influx of migration was illegally obtained. This is further supported by the observation of meat consumption at Kowak village, c. 80 km from the Park boundary, where meat consumption increased with household income and not movement of migratory herbivores.
The seasonal availability of herbivores also affects bushmeat prices, which almost halve when the migration passes through the village areas (Holmern et al., Reference Holmern, Røskaft, Mbaruka, Mkama and Muya2002). Bushmeat prices are unrelated to wildlife species and are primarily determined by the weight of the dry meat pieces that are the most common unit of trade (Holmern, Reference Holmern2000; Holmern et al., Reference Holmern, Røskaft, Mbaruka, Mkama and Muya2002). Although there is evidence for a preference for certain bushmeat species among different tribes (Ndibalema & Songorwa, Reference Ndibalema and Songorwa2007) the identification of species by meat taste is generally poor (Nyahongo et al., unpubl. data). The limited cash available among the poor people in this area, together with the fact that fish (in the villages distant from Lake Victoria) and domestic meat is more expensive than bushmeat, means that these alternatives cannot currently out-compete wildlife as the primary protein source.
Furthermore, access to meat or fish sources may depend on several other factors, such as having to circumvent impassable areas, the likelihood of being arrested, the distance to travel, and time to reach the profitable source area (Nyahongo et al., Reference Nyahongo, East, Mturi and Hofer2006). For example, the distance between Kowak village and the closest point on Lake Victoria is only 17.8 km but direct access is impassable because the area is covered by swamp, steep hills, gullies and thick acacia scrub. Thus, people take a longer route (the old Sirari-Musoma road, which is c. 60 km) to reach the closest fishing station, at Kinesi.
Mean household meat and fish consumption per month fluctuated with movement of migratory herbivores in or close to villages that were < 30 km from the Park. During the wildebeest migrations in the western Serengeti huge herds roam through village and agricultural lands and large numbers may be slaughtered. It is not surprising, therefore that there was higher household meat consumption during the influx of migratory herbivores close to Robanda, Nyatwali, Nyamakendo and Rwamkoma, with the greatest meat consumption occurring during the peak migration (Fig. 2). There are also strong traditional cultural motives for hunting in this region (Kaltenborn et al., Reference Kaltenborn, Nyahongo and Tingstad2005) that may also influence bushmeat consumption and resistance to the introduction of alternative animal protein sources. The consumption of fish was relatively low in these villages during the peak migration, suggesting that bushmeat and fish may complement each other.
To reduce dependence on bushmeat alternative sources of meat protein, together with income generating projects, need to be considered in both local and national development planning. The contribution of fish to household diet as a potential alternative to bushmeat needs to be considered and limitations on the processing of fresh fish and transportation to local markets removed. Industrial harvesting of fish from Lake Victoria needs to be examined as it may reduce availability of fish in local markets both in villages close to Lake Victoria and more distant villages, thus increasing the pressure and reliance on bushmeat. Policy makers need to understand these complex links and the need for coordinated management of these two ecologically different sources of animal protein.
Acknowledgements
This study was funded by NORAD through the Ministry of Natural Resources and Tourism, Tanzania, and is a part of the TAWIRI, NINA and NTNU project Biodiversity and the Human Wildlife Interface in the Western Serengeti. We acknowledge financial support from the Norwegian Fredskorpset and the Quota Programme scheme (NORAD). We also thank Tanzania National Parks for granting permission to work in Serengeti National Park. Finally, we thank anonymous reviewers for their useful comments, and village leaders, respondents and our field assistants for their help. Claudia Melis assisted with figures.
Biographical sketches
Julius Nyahongo is currently at Tanzania Wildlife Research Institute where his research focuses on human-wildlife interactions, with a particular emphasis on bushmeat hunting and carnivore conservation in the western Serengeti. Tomas Holmern is interested in human-wildlife interactions and has recently been carrying out research on bushmeat hunting and local law enforcement in the Serengeti. Bjørn Kaltenborn is a geographer and social scientist specializing in human-environment interactions. He has worked extensively with human-wildlife conflicts in the Nordic countries as well as in East Africa and South Asia. Eivin Røskaft is a behavioural ecologist interested in a wide range of bird and mammal species in Europe, North America and Africa, and in human-wildlife conflicts over the use of limited land.


