

DISCUSSION POINTS
• Situational scarcities of water and energy/water stress result from combinations of extreme climate variability, water-intensive energy and food production/food processing, reliance on energy-intensive water transport, and increasing populations.
• These challenges can be addressed with combinations of enhanced water and energy use efficiencies coupled with new materials, new technologies, and decentralized, energy-efficient unit operations that provide “fit-for-purpose” water.
• Innovative solutions may underpin new water-centric economic expansion, complementing the emerging economies of renewable energy.
Introduction—The origins of energy/water stress
Production of secure and sustainable sources of energy, clean (“fit-for-purpose”) water, and food for expanding U.S. and world populations, may be our most significant challenges in the 21st century and beyond. Meeting these challenges will require new understandings of complex interconnections: energy production and energy use; water availability, water storage, water use and reuse; and food production. New energy-efficient water purification/reuse technologies and water use policies are predicted to be the centerpiece of U.S. and worldwide initiatives that sustain and enhance economic activity, human health, and quality of life.
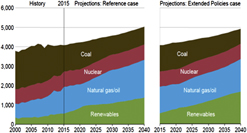
Our most important energy, food production, and water distribution systems were developed over the last 200 years with varying degrees of technological, operational, and policy isolation, sometimes with an assumption of unlimited energy and water resources.Reference Moniz, Knotek and Orr1–Reference Glennon11 Figure 1 demonstrates that this approach may not be sustainable. Here Global (Energy) Generation Units Associated with Water Stress are mapped and color-coded.Reference Evans12–Reference Gassert, Landis, Luck, Reig and Shiao15 This map is one of many that provide visualization of the interdependence of energy generation and water usage for government agencies and commercial entities, and would be even more dramatic if power plants below 100 MW had been considered. Such “stress maps” (e.g., those created by the World Resources Institute)Reference Gassert, Landis, Luck, Reig and Shiao15,Reference Imbrogno and Belfort16 increasingly factor into the strategic thinking of a variety of regional and global businesses, and local and regional governments. These are entities involved in energy extraction and energy usage/delivery to large constituencies. The continued profitability of these companies, and the responsiveness of governments to their citizens, depends on precise management of all resources, most particularly water.
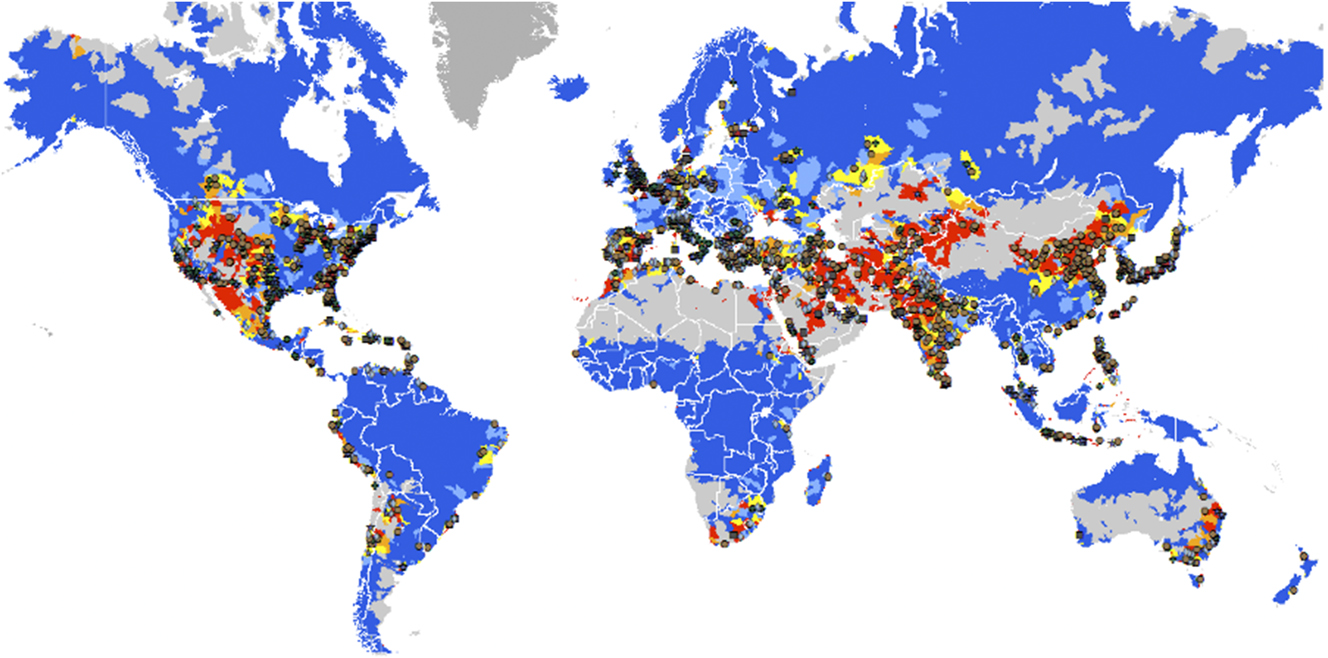
Figure 1. Global Generation Units with Water Stress—yellow, orange, and red correspond with medium, high, to extremely high stress levels. Notes: Includes thermal and hydro plants. For visualization purposes, plants with design capacity less than 100 MW are not shown. Source: Platts UDI Database 2012 and WRI Aqueduct data. Over 26,000 units are in areas of medium to extremely high water stress (from: Ref. Reference Evans12 “Resilience: Global Imperatives for 2013 and Beyond.” Sources: Peter C. Evans, Ph.D., Vice President at Center for Global Enterprise, General Electric; https://www.slideshare.net/Oxford99/mesh-evans-april-25-2013); See also Ref. Reference Bauer3: https://energy.gov/sites/prod/files/2014/09/f18/2014-09-05_Energy%20Water%20Nexus_SEAB%20Presentation.pdf, and Refs. 13–Reference Gassert, Landis, Luck, Reig and Shiao15.
The recently released Climate Science Special Report further amplifies on the likelihood of projected water shortages under different scenarios by the middle to end of the 21st century, differentiating between “meteorological drought” (precipitation deficit), “agricultural drought” (soil moisture deficit), and “hydrological drought” (deficit in runoff),Reference Wuebbles, Fahey, Hibbard, Dokken, Stewart and Maycock17 Each of these water deficits impact different constituencies, in different geographical regions and over different time and distance scales. Of particular note, however, is that almost all global regions are predicted to experience declines in soil moisture, critical for agriculture and for direct consumption by humans, even though some global regions are projected to see enhanced precipitation. Increases in average annual temperatures, which increases rates of evapotranspiration, are likely to offset moisture gains in regions with higher precipitation, and regions that show adequate soil moisture presently may see significant water stress. Thus, no region of the world is exempt from some of the situational scarcities associated with increased climate variability coupled with population growth, growth of energy use, and the growth of modern agriculture.Reference Moniz, Knotek and Orr1,Reference Bauer3,Reference Keairns, Darton and Irabien6,Reference Krane10 Without some significant changes in our collective approach to the Energy/Water/Food nexus, maps like those in Fig. 1, and the reality they reflect may be even more dramatic by 2050.
Worldwide energy usage is predicted to increase at least 40% by the year 2050 relative to 2010 usage, coupled with growth in world population to approximately 9 billion people.Reference Prabhu7–Reference Lal9,13 For the United States alone, the Energy Information Administration (USEIA) predicted in 2016 that electricity generation (a significant fraction of our energy use portfolio, ignoring transportation fuels) would increase to approximately 5 × 10¹² kilowatt hours (kW h) per year by mid-century (Fig. 2). This represents an increase in electrical energy generation of approximately 20% relative to present levels despite the fact that the efficiency of energy use has been increasing steadily in the last 40 years.14 In the last two decades, energy usage in the United States appears to be only weakly coupled to increases in gross domestic product.18 There is every expectation, however, that enhanced economic activity and population growth will continue to drive energy consumption upward. It is not clear that the energy needed for massive levels of water purification/reuse, the subject of this review, has been factored into these energy use estimates by USEIA and other agencies. Thus, the mid-century energy projections shown in Fig. 2 may be too low.

Figure 2. Projections for U.S. electricity generation by fuel as a function of year, in the Reference and Extended Policies cases, 2000–2040 (billion kilowatt hours)—Electricity generation by fuel in the Reference and Extended Policies cases, 2000–2040: AEO2016 National Energy Modeling System, runs REF2016.D032416A and TAXTENDED.D051216A. Source: Ref. 14.
From Fig. 2, we can infer the relative contributions of each energy source in the Extended Policies USEIA projections for the year 2040: coal (approximately 15%), natural gas (approximately 40%), nuclear (approximately 10%), and renewable energy sources such as wind and solar (approximately 35%). Unless zero- or low-carbon-footprint energy technologies are more widely adopted in the United States, water-intensive carbon-based energy sources may still provide more than 50% of the U.S. electrical energy portfolio by 2050.14
Carbon-based fuels, however, increasingly have to compete on the basis of cost and practicality with lower climate impact renewable energy sources.Reference Keairns, Darton and Irabien6,Reference Krane10,13,Reference Baker, Fowlie, Lemoine and Reynolds19 In another 2017 report, USEIA compared the levelized cost of electricity (LCOE) and the levelized avoided cost of electricity (LACE) for electricity generating technologies entering service in 2019, 2022, and 2040.20 It has been posited that comparing LACE with LCOE, projected over the lifespan of the generating technology, provides a means of deciding which technology platform provides the best economic value. Comparisons of LACE and LCOE for power plants entering operation in 2022 show that solar PV and wind generation, in some regions, will be able to compete with even natural gas generation for economic value, and are significantly better value than electricity generated from coal and nuclear energy. This difference becomes even more pronounced when projected to 2040. These projections would have been unlikely ten years ago, but the costs of solar PV and wind-generated electricity are dropping at dramatic rates as efficiencies continue to increase. Thus, the projected data in Fig. 2 may be somewhat pessimistic if costs of solar and wind energy continue to decrease. Disruptive changes in how our energy is produced, with significantly lower carbon utilization and water stress, is the clear goal of many of our worldwide G-20 partners and even some individual states within the United States.Reference Goldthau21,22
No matter what percentage of the U.S. energy portfolio shown in Fig. 2, carbon-based or nuclear energy sources are placing stress on existing water supplies.Reference Moniz, Knotek and Orr1,2,Reference Averyt, Macknick, Rogers, Madden, Fisher, Meldrum and Newmark23 Water is needed for extraction of energy-dense materials, e.g., coal, oil, shale gas, and uranium, and for processing these materials prior to use in power plants. Power plant cooling is also water intensive.Reference Averyt, Macknick, Rogers, Madden, Fisher, Meldrum and Newmark23–Reference McMahon and Price27 Recent reviews have tabulated the water consumption (in liters per gigajoule—L/GJ) for worldwide production of carbon-based and nuclear fuels: (i) traditional oil (3–7 L/GJ); (ii) oil from oil sands (70–1800 L/GJ); (iii) conventional natural gas (minimal water use); (iv) shale gas (36–54 L/GJ); (v) coal (5–70 L/GJ); and (vi) uranium (4–22 L/GJ).Reference Averyt, Macknick, Rogers, Madden, Fisher, Meldrum and Newmark23–Reference Sanders29 The water use for extraction of energy-dense fuels from sands and shales are especially striking and are of increasing importance as our dependence on these fuels increases. Processing of these materials to get them ready for use in power plants and electricity production can further double the water costs. The water costs for electricity production from both wind energy and conventional solar photovoltaics, while not zero, are typically a factor of up to 100× lower than for these other energy sources.Reference Averyt, Macknick, Rogers, Madden, Fisher, Meldrum and Newmark23–Reference Sanders29 Even for generation of electricity from concentrated solar thermal and photovoltaic energy conversion systems, water use can be minimized if closed loop operations are used.
Food production is also consequential for local and regional water supplies and can be extremely energy intensive. Challenges to food production have been among the most visible recent examples of water stress in arid and semi-arid environments.Reference Finley and Seiber30–Reference Tester and Langridge32 Plants use water to transport nutrients; however, large percentages of water are lost to evaporation or transpiration in outdoor crops. Thus, there are significant efforts to breed new varieties of food crops that use less water and are more draught-tolerant.Reference Finley and Seiber30–Reference Jacquemin, Bhatia, Singh and Wing33
Recent reviews have tabulated the amount of water and energy needed for food commodities, basic food products, and processed foods using today’s agricultural and food industry practices.Reference Finley and Seiber30 Example water and energy costs are shown in Fig. 3, adapted from the data compiled in Ref. Reference Finley and Seiber30. Not surprisingly, the more complex the food source organism (e.g., animal versus plant-based sources), and the more highly processed that food becomes before consumption, the more significant the energy and water costs are to produce food products. The fact that up to 30% of food in the United States is wasted makes these assessments even more sobering.Reference Keairns, Darton and Irabien6,Reference Lal9,Reference Finley and Seiber30
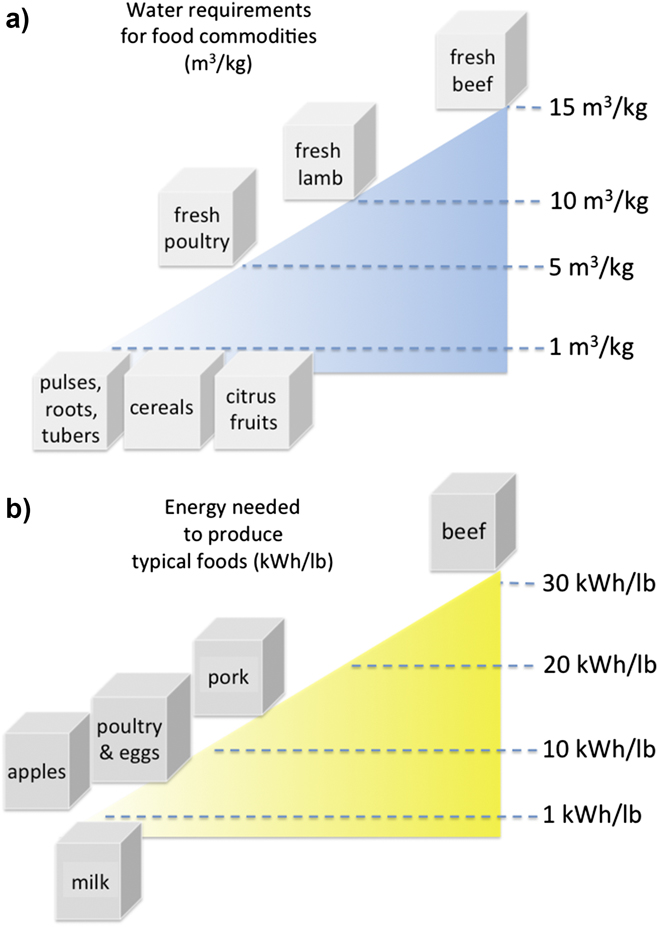
Figure 3. (a) Estimated water requirements for food commodities (m3/kg); (b) energy needed to produce typical foods (kW h/lb). Processing to form other more refined food products increases the water and energy costs even higher. Data used to construct this figure from Ref. Reference Finley and Seiber30.
Emerging segments of our agricultural economy may offer some relief from the energy/water costs to producing food. Controlled-environment agriculture (CEA—greenhouse agriculture) provides a much lower water and energy cost alternative to food production. CEA increasingly provides for production of segments of our food supply, often in sites that might be untenable for conventional agriculture.Reference Ishii, Sase, Moriyama, Okushima, Ikeguchi, Hayashi, Kurata, Kubota, Kacira and Giacomelli34–Reference Boscheri, Kacira, Patterson, Giacomelli, Sadler, Furfaro, Lobascio, Lamantea and Grizzaffi36 Whether food can be produced at massive scale using this approach, displacing large segments of conventional agriculture has to be proven. There is substantial optimism that CAE can be an important and energy/water efficient source of food for expanding populations.
Enhanced efficiencies for water use and reuse throughout the energy/water/food nexus, and especially by humans in large and small communities,Reference Prabhu7–Reference Lal9,Reference Larsen, Hoffmann, Luthi, Truffer and Maurer37 could make a significant impact on energy and water consumption and mitigate the periodic scarcities that are increasing. In the case of water use, only relatively isolated approaches have been taken until recently to provide “fit-for-purpose” water targeted to a particular function. For example, waste water streams have rarely been integrated into energy extraction, energy production, food production processes and have been rarely used for human consumption.Reference Averyt, Macknick, Rogers, Madden, Fisher, Meldrum and Newmark23,Reference Larsen, Hoffmann, Luthi, Truffer and Maurer37 This lack of integration arises in part because of geographic isolation of each process (e.g., agriculture is rarely co-located with energy extraction and energy production). The problem is further exacerbated by policy isolation where integrated use of resources may not be the primary consideration.Reference Glennon and Taylor38–Reference Eden, Scott, Lamberton, Megdal, Kenney and Wilkinson43
Understanding and optimizing the nexus of energy, water, and food is therefore at an acute stage in the U.S. funding and research-supporting agencies, such as the National Science Foundation (NSF), the U.S. Department of Energy (DOE), the U.S. Department of Agriculture (USDA), and the Bureau of Land Management (BLM), have initiated programs designed to produce an integrated approach to addressing these challenges. Recent workshops conducted on behalf of these agencies have shaped our perspective in this review.Reference Moniz, Knotek and Orr1–Reference Armstrong, Antin, Barnhart, Betterton, Giacomelli, Guerrero, Ogden, Patten, Poulton, Reynolds and Snyder5 The ongoing challenges facing the southwestern regions of the United States, specifically California, Arizona, New Mexico, and Texas, containing nearly 70 million inhabitants, also guide our approach.Reference Cayan, Das, Pierce, Barnett, Tyree and Gershunov40 This region of the United States has large municipalities that have grown significantly over the last 75 years, most of which are now experiencing some degree of “water stress.”Reference Megdal, Gerlak, Huang, Delano, Varady and Petersen-Perlman41–Reference Eden, Scott, Lamberton, Megdal, Kenney and Wilkinson43 The fact that robust agricultural economies have developed in the same region enhances the impact of this water stress. These agricultural enterprises require sometimes-unreliable surface and subsurface water sources and water sources transported long distances, often uphill. At the same time, this region has extraordinary low-carbon, low water use energy potential and an abundance of conventional energy sources, including nuclear energy, which could be used to mitigate some of this water stress. As will be discussed further below, the challenges and opportunities faced by this region of the United States are paralleled in other developed and developing countries, where situational scarcities, coupled with population growth and climate variability are contributing to a changing landscape at the nexus of Energy/Water/Food.
We also note the recent policy debates outside the United States surrounding the challenges and opportunities at the Energy/Water/Food nexus. These debates have resulted in complementary research initiatives in both developed and developing nations. Current discussions among the G-20 countries,Reference Goldthau21,22 for example, are likely to dictate worldwide approaches to providing secure and reliable energy and water sources. These discussions will incentivize policies that ensure that some countries will take the technological lead in addressing these challenges. Our global economies are tightly interconnected. Thus, changes to existing energy portfolios, and the development of new energy and clean water technologies in any of the G-20 countries will be guaranteed to have worldwide impact. These changes, whether we subscribe to the policies developed by the rest of the world or not, will therefore affect the competitiveness and readiness of the United States to address the challenges needed to ensure secure supplies of energy, water, and food. To reap the economic rewards of some of the technology and system-level solutions summarized below, the United States must remain engaged in these policy debates.Reference Goldthau21,22
Transporting water: an energy-intensive solution to situational scarcities
It could be argued that proximity to fresh water sources prior to the late 20th century was a strong determinant for population growth in certain regions of the globe and for economic and lifestyle vitality. In recent decades that correlation has weakened as urban populations have grown at the expense of rural communities.Reference Kummu, de Moel, Ward and Varis44 An intriguing study by Kummu et al. recently provided a granular global analysis of proximity to fresh water. The problem is described in terms of land distance to fresh water (dw land), population distance to fresh water (dw population), and the ratio of these two terms. This analysis shows that the southwestern United States, parts of northern and central Africa, parts of Central and South America, and parts of the Middle East are experiencing stress brought about by combinations of increased population density and the intrinsic distance to reliable water sources for human consumption, agriculture, etc. Transport of fresh water from distant sources can mitigate some of these scarcities in important ways, but with considerable energy costs.Reference Cayan, Das, Pierce, Barnett, Tyree and Gershunov40,Reference Megdal, Gerlak, Huang, Delano, Varady and Petersen-Perlman41,Reference Eden, Scott, Lamberton, Megdal, Kenney and Wilkinson43,Reference Fulton and Cooley45,Reference Copeland and Carter46
Two large and well-known U.S. responses to regional water scarcities, the California State Water Project (CSWP) and the Central Arizona Project (CAP—Fig. 4),47 are mega-projects that have underpinned some of the significant economic growth of the southwestern United States in the last 50 years.Reference Cayan, Das, Pierce, Barnett, Tyree and Gershunov40,Reference Megdal, Gerlak, Huang, Delano, Varady and Petersen-Perlman41,Reference Eden, Scott, Lamberton, Megdal, Kenney and Wilkinson43,Reference Fulton and Cooley45,Reference Copeland and Carter46 Stresses experienced recently by both projects are typical of the stresses being felt in most regions employing long distance water transport.Reference Wilson, Li, Ma, Smith and Wu48–Reference Sternberg50 Dramatic population increase and increased agricultural water use in this region have been coupled with decreasing reliability of CSWP and CAP water sources brought about by increases in climate variability. Initial water use policies at the genesis of these projects may have underappreciated the complex relationships between energy production and energy usage; the real energy and water costs of food production; and the costs of acceptable water availability and purity for human consumption in (“Sunbelt”) regions where growth is still a significant policy driver.Reference McMahon and Price27,Reference Finley and Seiber30,Reference Cayan, Das, Pierce, Barnett, Tyree and Gershunov40–Reference Eden, Scott, Lamberton, Megdal, Kenney and Wilkinson43,Reference Fulton and Cooley45,Reference Copeland and Carter46,Reference Weiser51,52
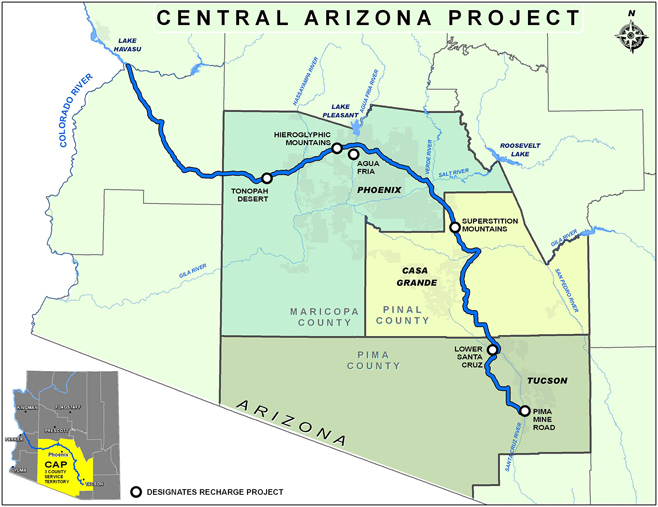
Figure 4. Map of the CAP that provides water supplies to central/southern Arizona from the Colorado River, whose flow levels are dependent upon snow pack and precipitation in the entire Colorado River Basin. The CAP pumps water uphill over 320 miles to the Phoenix and Tucson metropolitan areas, and to agricultural and Native American communities in between, with a total elevation gain of approximately 1600 ft (from Ref. 47: http://www.cap-az.com/about-us/system-map).
As is typical for a number of mega-water projects worldwide, both CWSP and CAP involve pumping water uphill over long distances. CWSP pumps water from northern to southern regions in California, with an elevation gain and loss of approximately 2000 feet.Reference Fulton and Cooley45,Reference Cohen and Nelson53 The CAP pumps water uphill from the Colorado River, over 320 miles to the Phoenix and Tucson metropolitan areas, and to agricultural and Native American communities in between.54 The CAP system has a total elevation gain of approximately 1600 feet from source to endpoint.Reference Eden, Scott, Lamberton, Megdal, Kenney and Wilkinson43,Reference White, Keeler, Wiek and Larson55
Simple estimates for the energy needed to lift one acre-foot of water (approximately 326,000 gallons; 1238 m3) by one foot suggest that approximately 1 kW h of electrical power will be required for each foot of elevation gain, assuming 100% pumping efficiency.Reference Peacock56 This suggests a minimum 1600 kW h for transport of one acre-foot of water along the CAP route and 2000 kW h per acre-foot for the CSWP. 2004 estimates for transporting water in the CSWP were actually 3000 kW h per acre-foot.Reference Cohen and Nelson53 At that time, it was estimated that water transport to southern California from northern California accounted for approximately 1/3 of the total household electrical power usage for that region of the state. Increases in pumping efficiencies may mitigate some of this energy usage, but water transport over long distances remains extremely energy intensive.
Figure 5 is a summary of more realistic estimates for energy usage in both pumping and water treatment in California in kW h per million gallons of water and is considered to be typical of energy consumption for movement and treatment of comparable water supplies.Reference Fulton and Cooley45,57–Reference Plappally and Lienhard59 This study shows that the biggest consumption of energy comes first from water transport and second from the purification of water sources with high total dissolved solids (e.g., desalination of ocean water, see below).
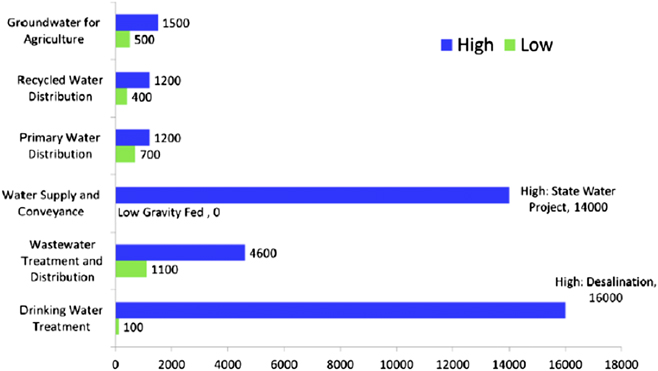
Figure 5. Typical energy intensities for water treatment and pumping operations in California (kW h per million gallons)—these are energy intensities considered to be typical for many water distribution/delivery systems. Source: Ref. 57 (Fig. 6): Primary reference: California Energy Commission, “California’s Water-Energy Relationship, Final Staff Report, CEC-700-2005-011-SF”, November 2005.
Unlike CSWP, approximately 90% of the electrical energy required for the CAP to pump water across the state of Arizona currently comes from essentially one source: the Navajo Generating Station (NGS) in northeastern Arizona,Reference Hurlbut, Haase, Turchi and Burman60 making it easier to understand the energy cost of transporting water. At present, nearly 3 million mega-watt hours (MW h) of NGS-generated electricity are used each year to pump approximately 1.6 M acre-feet of water from the Colorado River to central and southern Arizona.Reference Megdal, Gerlak, Huang, Delano, Varady and Petersen-Perlman41 NGS consists of 3 coal-fired plants producing approximately 2250 MW at peak power, burning approximately 8 M tons of low-sulfur coal (from the Kayenta Mine 78 miles from the power plants), emitting as much as 20 M metric tons of CO2 and other “greenhouse gases” per year. In addition, NGS uses approximately 32 M m3 of water per year for power plant cooling.Reference Averyt, Macknick, Rogers, Madden, Fisher, Meldrum and Newmark23,Reference Sanders29,Reference Hurlbut, Haase, Turchi and Burman60 In various studies, it has been estimated that NGS is one of the top-10 producers of CO2 emissions in the United States. The Kayenta Mine providing the fuel to that plant also uses a significant allotment of groundwater from the Navajo Aquifer as part of the coal mining process.
In light of the availability of alternate energy sources, it has been debated whether NGS operation makes sense economically and environmentally.Reference White, Keeler, Wiek and Larson55 The same amount of energy will still be required to pump water across Arizona, but natural gas-fired power plants, or renewable energy sources, closer to the CAP, may provide the energy required. As a complication, in this region of the United States, there has always been a close and extremely sensitive link between local and regional needs for water and energy and Native American communities. Some of these communities are dependent upon the revenue and jobs from coal mining, coal transport, and its use. The societal impact on these communities is likely to be severe if NGS closes, as seems likely, and coal from the Kayenta mine is no longer needed. Economic and environmental drivers, however, may make closure of NGS inevitable.
There are increasing questions about the sustainability of these large water transport projects in general. Both the CSWP and the CAP were initiated when snow pack in the mountains of California, Wyoming, Colorado, Utah, and New Mexico were at high levels, producing reservoir and Colorado River average water levels that seemed more than adequate to supply expanding urban and agricultural uses in regions far from these water sources. California and Arizona aquifers at this time were robust and offered adequate supplies of subsurface water to support growth of vibrant municipalities and robust agricultural enterprises.Reference Sanders29,Reference Megdal, Gerlak, Huang, Delano, Varady and Petersen-Perlman41,Reference Megdal, Eden and Shamir42,Reference White, Keeler, Wiek and Larson55
It is increasingly clear that the sources for water to be transported long distances in the western United States may not be as sustainable as once thought.Reference Cayan, Das, Pierce, Barnett, Tyree and Gershunov40,Reference Safeeq, Shukla, Arismendi, Grant, Lewis and Nolin49,Reference Sternberg50,Reference Ault, Mankin, Cook and Smerdon61 Recent prolonged drought conditions have impacted water sources in large segments of the western United States. Whether the climate variability that underpins these droughts has been enhanced by the energy use and CO2 emissions associated with transporting water long distances will be a point of debate for some time to come. If extreme situational scarcities of water occur in our future, however, they will impact both urban and agricultural economies, and human health and well-being in general.Reference Cayan, Das, Pierce, Barnett, Tyree and Gershunov40,Reference Ault, Mankin, Cook and Smerdon61–Reference Wilder, Liverman, Bellante and Osborne65
The United States is not alone in developing long distance water transport to alleviate situational scarcities in large regions. The most striking recent example is the South–North Water Transport Project (SNWTP) in China, which has just become operational. SNWTP transports up to 44 km3 of water per year from the Yangtze River Basin to the Yellow River Basin, over distances of up to 2000 km.Reference Wilson, Li, Ma, Smith and Wu48 As in the CSWP and CAP, the Eastern and Western Routes for SNWTP involve pumping water uphill; the most extreme elevation gains required are in the Western Route, and it can be surmised that this part of the SNWTP will be the most energy intensive. At present, most of that energy comes from carbon-based fuels, with all of the attendant environmental, public health and increased climate variability consequences of using that fuel source.Reference Magee and Brunn66
Conservation: energy-efficient alternatives to water transport and water reuse/purification
Communities that have resorted to energy-intensive water transport solutions to water scarcity will need to couple technological solutions to water purification/reuse with much stricter conservation of existing water supplies. Careful management of scare resources will be far less energy (and water) intensive, and more easily implemented in the short term than some of the technological solutions summarized below. New water use policies, coupled with significant conservation practices, may mitigate some of these problems without unduly affecting quality of life or economic vitality.Reference Megdal, Gerlak, Huang, Delano, Varady and Petersen-Perlman41,Reference Burnham, Ma, Endter-Wada and Bardsley62
The 2014 United Nations Report on Water and Energy67 provides a striking assessment of water usage (liters per capita per day L.p.c.d.) for a range of developing and developed countries. This report shows that water consumption in general increases with affluence. Not surprisingly, average water consumption in the United States (approximately 650 L.p.c.d.) is as much as a factor of 10× higher than the water usage of less developed countries.
There is growing proof, however, that water consumption does not need to increase with economic GDP. For example, municipalities such as New York City reduced their water consumption by more than 40% in the period from 1980 to 2010, with a considerable accompanying savings in energy and overall cost. Similar trends have been observed in Asian cities such as Singapore, Hong Kong, and Guangzhou where strict conservation measures are enforced. The fact that per capita water consumption in cities such as Tokyo and Osaka is nearly the same as in cities such as Shanghai, even though GDP per person is a factor of 7× higher for these large Japanese municipalities, suggests that water conservation need not be associated with lower standards of living and can significantly reduce energy costs for both water transport and water reuse and purification. Conservation will undoubtedly be the first tool of choice, and the most easily implemented, in the quest to provide expanded sources of water.
Materials, technologies, and unit operations associated with water reuse/purification
Even if strict conservation measures are adopted, large new water sources will still be needed for much of the United States, coupled with extremely energy efficient, economical, and publically acceptable water reuse/purification technology platforms. The workshops and reports referenced aboveReference Moniz, Knotek and Orr1–Reference Bauer3,Reference Armstrong, Antin, Barnhart, Betterton, Giacomelli, Guerrero, Ogden, Patten, Poulton, Reynolds and Snyder5 all have recommended basic (molecular level) understandings of water purification/reuse and the development of new technologies and systems that can mitigate water and energy stress and provide “adaptive capacity” to ensure a sustainable future.Reference Scott, Kurian, Wescoat, Kurian and Ardakanian68 We summarize here some of the best developed purification/reuse technologies and the challenges and knowledge gaps that must be addressed to enhance their effectiveness.
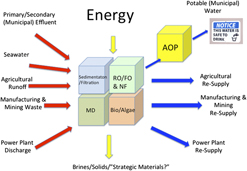
Figure 6 schematically summarizes some of the water sources and water uses that can be interlinked through systems and unit operations designed to provide fit-for-purpose water, either at large scale, or for “point-of-use” operations.Reference Shannon, Bohn, Elimelech, Georgiadis, Marinas and Mayes69–Reference Elimelech and Phillip72 This figure is organized to reflect the anticipated need for modularity in the purification strategies used. Depending upon the water source and the intended use, not all technologies may be needed for water purification, especially if high impurity levels can be tolerated in the end use. Comprehensive and detailed reviews of current water treatment technologies and unit operations are extensively covered in Refs. Reference Shannon, Bohn, Elimelech, Georgiadis, Marinas and Mayes69–Reference Elimelech and Phillip72.

Figure 6. Modular approaches to water reuse/purification (creation of “fit-for-purpose” water). Water sources and types of contaminants are shown at left (excluding water that has been stored/treated in aquifers, see text) and the intended uses to the right. Different combinations of conventional and nonconventional water purification systems may be required, including aerobic and anaerobic digestion, sedimentation/filtration, RO/FO, NF, MD and various forms of processing with biological systems (e.g., algae) which can take suboptimal water and produce fuels, food, and/or cleaner water. Advanced treatment (AOP) will be needed to degrade micropollutants to create water acceptable for human consumption. Decentralization, integration with low-carbon-footprint energy sources, and sensing networks will be a key feature of new approaches to create water for resilient communities.
Water sources can include: primary and secondary municipal effluent (including runoff from storm surge and catastrophic weather events); seawater (coastal communities); agricultural runoff and wastewater from manufacturing and mining; “produced waters” from energy extraction processes; and discharged water from power plants.Reference Shannon, Bohn, Elimelech, Georgiadis, Marinas and Mayes69,Reference Elimelech and Phillip72–Reference Meng, Chen and Sanders74 Depending upon the water source, initial purification stages may involve combinations of aerobic and anaerobic digestion, sedimentation, coagulation, and filtration of particulates and larger solids. This may generate water sources adequate for certain types of cooling in power plants, manufacturing, and certain agricultural applications.Reference Crittenden, Trussell, Hand, Howe and Tchobanogious70
Enhanced water purities are clearly needed for impurity-sensitive manufacturing, irrigating food crops; raising animals for food, and human consumption. In those cases, combinations of sorption, reverse osmosis (RO), forward osmosis (FO), microfiltration, ultrafiltration, and nanofiltration (NF), membrane distillation (MD), and bioremediation [e.g., algae bioreactors (ABRs)] may be productively used, once the water supply has reached “secondary effluent” quality.Reference Shannon, Bohn, Elimelech, Georgiadis, Marinas and Mayes69,Reference Crittenden, Trussell, Hand, Howe and Tchobanogious70,Reference Elimelech and Phillip72,Reference Lammers, Huesemann, Boeing, Anderson, Arnold, Bai, Bhole, Brhanavan, Brown, Brown, Brown, Chisholm, Downes, Fulbright, Ge, Holladay, Ketheesan, Khopkar, Koushik, Laur, Marrone, Mott, Nirmalakhandan, Ogden, Parsons, Polle, Ryan, Samocha, Sayre, Seger, Selvaratnam, Sui, Thomasson, Unc, Van Voorhies, Waller, Yao and Olivares75 For potable water production, these steps are increasingly followed by advanced treatment (oxidation) processes (AOPs), which further degrade emerging contaminants in water streams to levels deemed acceptable for human consumption.
Significant energy can be required to drive these purification and reuse processes; however, these energy costs are often much less than required for long distance transport of equivalent amounts of other water sources.Reference Stillwell and Webber76 Thus, water that might have been discharged in the past may now become a desirable new water source. This also means that concentrated waste streams will be collected, which might previously have been discharged in more dilute form. Considerations for environmentally responsible waste disposal will become a feature of these new purification/reuse modalities, and in some cases, recovery of strategic materials from waste streams.Reference Scherson and Criddle77,Reference Puyol, Batstone, Hulsen, Astals, Peces and Kromer78 This concept has been increasingly extended to what is termed “zero-liquid discharge” in industrial processes which attempt to capture and reuse their water streams.Reference Tong and Elimelech79
Water treatment and storage in aquifers
Before the application of the treatment modalities in Fig. 6, many water sources are being stored (and to some extent remediated via sorption processes) in aquifers, thus potentially becoming important secondary water sources.Reference Hamadeh, Sharma and Amy80 Waters produced from oil and gas extraction processes, from storm surge water, and water transported from sources with compositions that vary significantly from local sources can be deposited into partially or fully depleted aquifers before repumping to the surface for further treatment and use.Reference Meixner, Manning, Stonestrom, Allen, Ajami, Blasch, Brookfield, Castro, Clark, Gochis, Flints, Neff, Niraula, Rodell, Scanlon, Singha and Walvoord63,Reference Hamadeh, Sharma and Amy80–Reference Fournier, Keller, Geyer and Frew82 Equilibration with the aquifer soils may take up some of the unwanted contaminants via sorption and adjust pH and total dissolved solid levels.Reference Meixner, Manning, Stonestrom, Allen, Ajami, Blasch, Brookfield, Castro, Clark, Gochis, Flints, Neff, Niraula, Rodell, Scanlon, Singha and Walvoord63
There is significant uncertainty in the hydrology and the interfacial chemical processes that can be expected when using aquifers for storage and remediation. There is equal uncertainty as to how sustainable this practice is on a large scale and over long times.Reference Page, Vanderzalm, Dillon, Gonzalez and Barry81–Reference Niraula, Meixner, Dominguez, Bhattarai, Rodell, Ajami, Gochis and Castro84 It is recognized that adsorption and desorption interfacial chemistries of contaminant molecules and ions, in complex aqueous environments, is poorly understood.2,Reference Meixner, Manning, Stonestrom, Allen, Ajami, Blasch, Brookfield, Castro, Clark, Gochis, Flints, Neff, Niraula, Rodell, Scanlon, Singha and Walvoord63 We note that there is likely to be considerable overlap in the fundamental problems that underpin water remediation, and storage in aquifers, and new sorption, filtration and permeation-based purification technologies, especially for increasingly complex aqueous environments (see below).2
Recent studies have also predicted that energy consumption associated with moving water from impure sources to these aquifers for mitigation of contaminants may be excessive unless the recharge aquifer is lower in elevation than the contaminated water source.Reference Fournier, Keller, Geyer and Frew82 There will be clear trade-offs between energy use for aquifer storage and remediation, and energy use for immediate purification, as described below, without the long-term storage option.
Reverse osmosis
Membrane separation processes are well-recognized water purification technologies,Reference Imbrogno and Belfort16,Reference Elimelech and Phillip72,Reference Werber, Osuji and Elimelech85–Reference Lee, Elam and Darling88 and rely upon thin film (hybrid) materials whose average pore diameters, and pore size distribution, control the size selectivity for rejection of contaminants. RO is the most visible technology because of its use with salt and brackish water purification (desalination), at scales that have transformed the water landscape of several water-stressed regions throughout the world.Reference Imbrogno and Belfort16,Reference Werber, Osuji and Elimelech85,Reference Werber, Deshmukh and Elimelech86
It has been estimated that more than 18,000 RO plants are operating in 150 countries, annually producing roughly 38 billion m3 of purified water with an annual consumption of approximately 75 terawatt-hours of electricity.Reference Imbrogno and Belfort16,67,Reference Werber, Osuji and Elimelech85,Reference Werber, Deshmukh and Elimelech86,Reference Yechiel and Shevah89 In California alone, the largest RO desalination plant in the United States (Carlsbad, Ca.) recently came online with a capacity of 190,000 m3 [56,000 acre-feet (AFY)] per year and a median cost of approximately $2100 to $2500 per acre-foot, approximately 2× to 4× the cost of other water sources in that same region.Reference Fulton and Cooley45,Reference Cooley and Phurisamban90 The amount of either seawater or inland brackish waters to be treated by large-scale RO plants worldwide is expected to grow to at least 54 billion m3 per year by 2030.Reference Elimelech and Phillip72,Reference Werber, Osuji and Elimelech85 There are clear economic opportunities for countries and individual companies that develop the materials, technologies, and systems to handle water purification on this scale.
RO membranes control permeate flow and impurity (e.g., salt) rejection via solute diffusion in the free volume areas of the membrane. The volumetric flux (J w) of water through nonporous membranes can be approximately described as
 $${J_{\rm{w}}} = A\left( {\Delta P - \Delta \pi } \right)\quad ,$$
where A is the water permeability coefficient, an intrinsic property of the membrane controlled by composition; median pore size and distribution in pore size, and by membrane thickness; ΔP is the applied trans-membrane pressure gradient; Δπ is the opposing osmotic pressure difference across the membrane. Impurities are concentrated on the side of the membrane where ΔP exceeds Δπ and volumetric flow rate is directly related to the pressure differential.Reference Imbrogno and Belfort16,Reference Elimelech and Phillip72,Reference Werber, Osuji and Elimelech85–Reference Lee, Elam and Darling88 The energy required to achieve purification via RO (considering only the membrane itself) is a complex relationship between A, Δπ, and ΔP. Achieving realistic flows of permeate is determined by the composition of the feed solution [for salt water a total dissolved solid concentration of approximately 32,000 ppm (NaCl) is assumed], and the desired volume recovery percentage of purified water versus total intake volume. For seawater desalination, the energy required by early embodiments of RO technologies was excessive. Energy costs for RO have come down dramatically in the last two decades because of improvements in both membrane materials and system energy costs (e.g., implementation of centralized pumping and adoption of energy recovery devices). Primary energy costs for seawater desalination (SWRO—the most energy-intensive form of RO) have dropped from approximately 16 kW h/m3 to 2 kW h/m3 (for approximately 50% recovery of purified water), where the “thermodynamic limit” for seawater RO is assumed to be approximately 1 kW h/m3.Reference Imbrogno and Belfort16,Reference Elimelech and Phillip72,Reference Stillwell and Webber76,Reference Werber, Osuji and Elimelech85–Reference Lee, Elam and Darling88 System-level costs may bring the total energy cost to 3–4 kW h/m3.
To further reduce energy costs of seawater desalination novel RO operation modes, such as closed circuit desalination (CCD), and hybrid systems like osmotically assisted desalination, have emerged.Reference Prante, Ruskowitz, Childress and Achilli91–Reference Cath, Hancock, Lundin, Hoppe-Jones and Drewes94 In contrast to conventional RO that operates continuously and at fixed pressure, CCD operates in batch modes and the pressure continuously increases to follow the increase in osmotic pressure. CCD processes reduce energy consumption by up to 35% compared to conventional RO.
Dilution of a highly concentrated saline solution (such as seawater) with a low concentration saline solution (e.g., treated wastewater effluent) is the basis of osmotically assisted desalination. When a high salinity solution is separated from a low salinity solution via a semipermeable membrane, water spontaneously crosses the membrane from the feed solution to the draw solution, following the spontaneous osmotic pressure gradient. This process is called forward osmosis (FO).Reference Cath, Childress and Elimelech95 In pressure retarded osmosis (PRO), water passes through the membrane in the same direction as FO, but the high salinity solution is pressurized. As water crosses the membrane, it is moving from atmospheric pressure to an elevated pressure, effectively turning the chemical potential difference between the solutions into potential energy. Depressurizing the high salinity solution across a turbine can be used to generate electrical power from that potential energy.Reference Loeb and Mehta96
The augmentation of RO with FO and PRO has been shown to offer a promising route to water purification when collocation of desalination plants with wastewater treatment is possible.Reference Prante, Ruskowitz, Childress and Achilli91,Reference Cath, Hancock, Lundin, Hoppe-Jones and Drewes94,Reference Blandin, Verliefde, Tang and Le-Clech97,Reference Achilli, Prante, Hancock, Maxwell and Childress98 FO can be used as a pretreatment step to dilute seawater with water from the treated wastewater source, effectively reducing the osmotic pressure (and thus the energy requirement) of the RO feed water. In addition to reducing the energy requirement of seawater desalination via beneficial reuse, an FO–RO system provides two membrane barriers between the wastewater effluent and product water. This reduces fouling in the RO membrane because of dilution and lower required applied pressure. Similarly, if PRO is implemented after RO, the concentrated brine from RO is diluted to recover energy, which is then used to prepressurize the RO feed water.Reference Prante, Ruskowitz, Childress and Achilli91,Reference Cath, Hancock, Lundin, Hoppe-Jones and Drewes94
As RO and related membrane separation processes grow in use, enhanced energy efficiency, without loss of either permeation rates or selectivity, will be critical. As Figs. 1 and 2 attest, in the most desirable scenarios, the energy needed for large-scale water purification and reuse should come from low-carbon-footprint technologies that don’t further exacerbate the effects of climate variability and the creation and expansion of water scarcities.Reference Imbrogno and Belfort16,Reference Elimelech and Phillip72 Interestingly, current debate now appears to center on whether improvements in membrane permeability or improvements in membrane selectivity are preferred. These improvements are critical both to enhance efficacy of the treatment and to enhance overall energy efficiency. It has been hypothesized that higher permeabilities enable higher flow rates and lower energy costs for systems operating at scale. Improvements in selectivity (for water) enable enhanced rejection efficiencies for impurities.Reference Werber, Osuji and Elimelech85–Reference Park, Kamcev, Robeson, Elimelech and Freeman87,Reference Miller, Dreyer, Bielawski, Paul and Freeman99 Recent studies show that increases in RO membrane permeability, however, may produce only small increases in energy efficiency. Improvements in membrane selectivity appear to have a bigger impact on process efficiency.Reference Werber, Osuji and Elimelech85,Reference Werber, Deshmukh and Elimelech86 As more varied water sources are considered and end uses appear that require reliable rejection of contaminants, it is likely that membrane selectivity enhancements will be the primary target of materials research.
Further improvements in RO selectivity and energy efficiency will require a molecular-scale understanding and control of permeation, in scalable platforms, that is just beginning to emerge.Reference Werber, Osuji and Elimelech85,Reference Lee, Elam and Darling88,Reference Wang, Boutilier, Kidambi, Jang, Hadjiconstantinou and Karnik100 Future membrane materials will require optimized pore diameters/volumes and pore size distributions and will need to be extremely thin and mechanically robust. Design rules will need to be created to achieve molecule–scale interactions that optimize transport of the desired permeate (water) and rejection of impurities, without sacrifice in flow rates or energetic efficiencies.
Figure 7 provides a schematic view of some of the innovations that have been envisioned to achieve high levels of selectivity in emerging membrane materials.Reference Lee, Elam and Darling88 Many of these innovations involve introduction of nanometer-diameter pores with tailored internal chemical composition and electrostatics. These are designed at these length scales to reject selected impurities and pass water with reasonable flow rates.Reference Wang, Boutilier, Kidambi, Jang, Hadjiconstantinou and Karnik100 If the source water is a complex mixture of impurities, a series of such tailored nanochannel membranes, modular in nature to fit the water sources, may be required.
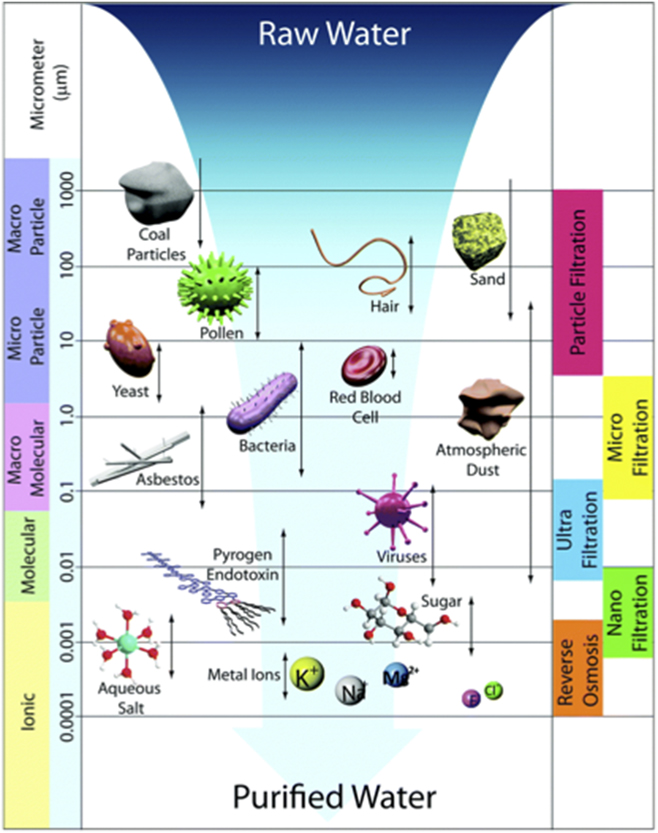
Figure 7. Schematic view of water purification from varied sources using membrane filtration and osmosis. Reprinted from Ref. Reference Lee, Elam and Darling88, Lee et al., Environmental Science: Water Research & Technology Royal Society of Chemistry, 2015, by permission.
The most well established RO membranes principally use materials that present hydrophilic pores for the separation process. More recent studies have shown that there are advantages in creating hybrid materials that present hydrophobic cores, or mixtures of hydrophilic and hydrophobic regions. As an example, new composites of polymeric and carbon nanotubes and/or graphene oxide “dopants,” or just graphene membranes alone, appear to provide for both high permeabilities and good selectivities for water purification.Reference Werber, Osuji and Elimelech85,Reference Park, Kamcev, Robeson, Elimelech and Freeman87,Reference Miller, Dreyer, Bielawski, Paul and Freeman99,Reference Wang, Boutilier, Kidambi, Jang, Hadjiconstantinou and Karnik100
The fouling of these membranes by nucleation/growth of salt deposits, and protein and lipid films, appears to be inevitable. Periodic backwashing and membrane reactivation is required, accompanied by additional energy consumption.Reference Werber, Osuji and Elimelech85 Improvements in membranes to mitigate these fouling processes will require a more detailed understanding of the interface science of these materials, especially in contact with complex solutions. A significant effort to develop new RO membrane materials, with precise nanometer design parameters and an increased resistance to fouling, is ongoing.Reference Werber, Deshmukh and Elimelech86–Reference Lee, Elam and Darling88,Reference Miller, Dreyer, Bielawski, Paul and Freeman99,Reference Lv, Zhang, He, Yang, Wu, Darling and Xu101
Filtration/nanofiltration
Filtration is often used in conjunction with RO purification systems or as a stand-alone method for water treatment.Reference Werber, Osuji and Elimelech85,Reference Bai, Liang, Crittenden, Qu, Ding, Ma, Du, Guo and Li102–Reference Mohammad, Teow, Ang, Chung, Oatley-Radcliffe and Hilal104 The overall challenges are much the same as for RO processes: rejection of impurities while sustaining high permeabilities and flow rates. Water permeability is controlled by solution viscosity, the pressure (and added energy) applied to drive water through the membrane, and the morphological, topological, and interfacial characteristics (e.g., formation of charged functional groups within the membrane nanopores—Fig. 8).Reference Werber, Osuji and Elimelech85,Reference Lee, Elam and Darling88 As the size of solutes being rejected gets smaller, porosity, pore radius in the membrane, pore size distribution, and membrane thickness become increasingly important. Along the walls of the nanopore, formation of interfacial excesses of ionic groups can impart ion-exchange-like properties to the membrane. In turn, this affords control over selectivity via changes in pH and ionic strength.Reference Werber, Deshmukh and Elimelech86,Reference Wang, Boutilier, Kidambi, Jang, Hadjiconstantinou and Karnik100
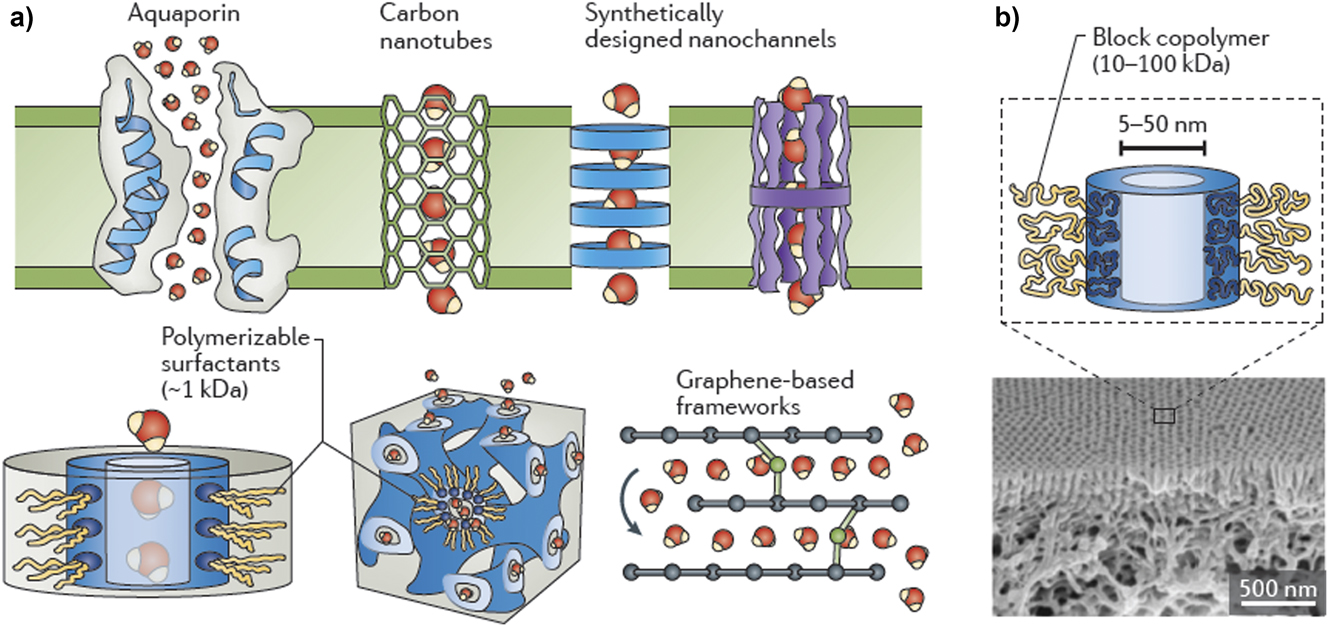
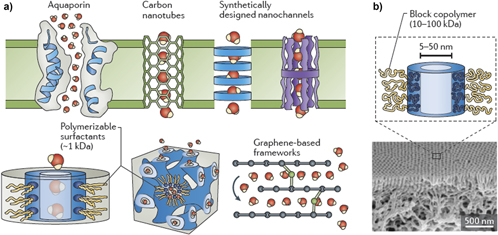
Figure 8. Schematic views of proposed nanochannels that might be introduced into emerging membranes for water purification, enabling unprecedented degrees of selectivity in these separation technologies. Key compositional, structural, and topological (interfacial) features that provide exceptional selectivity are achieved by molecular-scale control of the size and internal pore chemistry and electrostatics of these channels, with diameters typically well below 10 nm. Reproduced from Ref. Reference Werber, Osuji and Elimelech85, Werber et al. Nature Reviews Materials, 2016, by permission.
Original models for membranes designed to selectively purify water via filtration were developed for physically homogeneous membranes and presume uniform pore diameters throughout. Several different groups have recently shown that there may be distinct advantages to creation of anisotropic membranes, with pore sizes and selectivities that vary smoothly across the membrane.Reference Werber, Osuji and Elimelech85,Reference Lee, Elam and Darling88 Ideally, selectivities and permeabilities can be tuned and tailored for specific separations using rational design, and reasonable flow rates can be maintained.
Membrane distillation
Membrane distillation (MD) was the dominant water purification strategy prior to the widespread adoption of pressure-driven membrane purification processes.Reference Imbrogno and Belfort16 Distillation technologies typically use arrays of hydrophobic polymer fibers which separate the feed (impure) water stream and the distillate (product) stream, using a temperature gradient (ΔT) between the two aqueous phases; i.e., the membrane constitutes an “interphase boundary.”Reference Rao, Hiibel and Childress105–Reference Camacho, Dumee, Zhang, Li, Duke, Gomez and Gray108 The temperature differences between the feed (hot flow) and pure water (cold flow), and the temperature difference between the much thinner boundary layers on both the hot and cold sides of the membrane, control the vapor pressure differential for water across the membrane. The overall flux of pure water across the membrane is ultimately determined by these temperature differences, and the effective pore diameters and pore size distribution within the hydrophobic membrane.Reference Rao, Hiibel and Childress105–Reference Gustafson, Murphy and Achilli107
Finding waste heat sources that can reliably produce large temperature gradients across the membrane remains a challenge. Energy generation and water purification at scale need to be co-located, and intermittency of the heat source is problematic.Reference Rao, Hiibel and Childress105,Reference Camacho, Dumee, Zhang, Li, Duke, Gomez and Gray108,Reference Zhang, Li, Lv, Zhao and Qu109 Nevertheless, there are several emerging opportunities to couple the waste heat from future energy conversion systems (e.g., concentrator photovoltaic or photothermal energy conversion systems) that could be effectively integrated with water purification, especially for point-of-use applications.Reference Camacho, Dumee, Zhang, Li, Duke, Gomez and Gray108,Reference Miles, Cocilovo, Wheelwright, Pan, Tweet and Norwood110,Reference Stalcup, Angel, Strittmatter, Whiteside, Geary, Sodari, Rademacher, Didato, Ayala, Wiesenfarth, Bett and Muller111
One particularly intriguing example is the recent demonstration of the use of MD for water purification on parts of the Navajo Tribal Lands in Arizona.Reference Ravisankar Vishnu, Seaman, Mirchandani, Arnold Robert and Ela Wendell112 Nearly 40% of the people in this region lack easy access to potable water. MD purification of brackish ground water sources in remote locations, which may not be tied to electrical grids, appears to be a particularly important first demonstration of the integration of renewable energy conversion systems and water purification.
Bioreactors and scalable biological systems
There are concerns that some of the proposed technological solutions to provide fit-for-purpose water may be too energy intensive for many large-scale 24/7 water treatments. Intriguing alternative routes to food or biofuels involve the growth of micro-algae in contaminated water sources in either closed bioreactors (ABRs) or in open ponds.Reference Hamed113–Reference Jones, Ogden and Jia117 Micro-algae can be grown in less than optimal secondary effluent, or brackish waters. Depending upon the strain of algae used and the types of contaminants to be removed, ABRs can be used for the creation of high-grade fuels (high lipid content products that can be converted to energy-dense fuels),Reference Hamed113–Reference Jones, Ogden and Jia117 or high carotene content products that can be used as food for fish or shrimp. There is also increasing evidence that certain algae strains can be used to effectively sequester and/or degrade micropollutants, heavy metals, and anions/cations of concern from agricultural runoff.Reference Jones, Ogden and Jia117,Reference Ogden118 Urban wastewaters and agricultural runoff are particularly appealing for use in low-cost, easily scaled ABRs. The ability of micro-algae to remove “micropollutants” (small molecules with molecular weights below 300 gr/mole, not easily removed by osmosis or filtration/sedimentation), and to sequester heavy metals, is an increasingly attractive attribute for these biological systems. They are potentially self-perpetuating and have low energy costs to achieve reasonable levels of water purity.Reference Delrue, Alvarez-Diaz, Fon-Sing, Fleury and Sassi115
Advanced water treatment (AOPs)
Traditional water purification technologies, and even some of the more advanced membrane separation technologies, may not fully remove micropollutants to levels that are acceptable for human consumption or for use in industrial and agricultural processes that require high water purities.Reference Lee, Gerrity, Lee, Gamage, Pisarenko, Trenholm, Canonica, Snyder and von Gunten119–Reference Gerrity and Snyder124 Micropollutants include low molecular weight, low polarity pharmaceuticals, personal care products, industrial compounds, pesticides, hormones, and low molecular weight surfactants used in energy extraction. Their identities and concentrations vary substantially depending upon the water source. Several different AOPs have been developed over the last 20 years using extremely oxidizing reactants and are designed to degrade both residual pathogenic microorganisms and micropollutants.Reference Crittenden, Trussell, Hand, Howe and Tchobanogious70,Reference Lee, Gerrity, Lee, Gamage, Pisarenko, Trenholm, Canonica, Snyder and von Gunten119–Reference Crittenden, Trussell and Hand126 The desired outcome is degradation of the contaminant to a product which can be easily removed, and for which there are no health consequences. The less desired outcome, which may arise as new chemically stable micropollutants emerge in our water systems, is the difficult-to-remove degradation products, which have risks to health and safety, are created.Reference Lee, Gerrity, Lee, Gamage, Pisarenko, Trenholm, Canonica, Snyder and von Gunten119,Reference Park, Anumol, Daniels, Wu, Ziska and Snyder122,Reference Crittenden, Hu, Hand and Green127,Reference Xie, Meng, Sun, Niu, Jiang, Bottomley, Li, Chen and Crittenden128
AOPs typically involve generation of the strongest possible oxidizing conditions and use combinations of hydrogen peroxide (H2O2), ozone (O3), and ultraviolet (e.g., 254 nm) illumination (UV), to generate hydroxyl radicals (OH˙). Hydroxyl radicals easily cleave the most labile bonds in most small molecules and ideally degrade these molecules to smaller, and hopefully benign, molecular fragments.Reference Lee, Gerrity, Lee, Gamage, Pisarenko, Trenholm, Canonica, Snyder and von Gunten119,Reference Crittenden, Trussell and Hand126–Reference Xie, Meng, Sun, Niu, Jiang, Bottomley, Li, Chen and Crittenden128 The mechanisms for small molecule degradation are complex second-order chemical reactions (first order in OH˙, short-lived, and first order in the target molecule and degradation products). High concentrations of OH˙ must be sustained. The intermediate degradation products must remain near the oxidizing environment, which can be challenging to achieve. Ozone has limited water solubility and there are significant limitations in getting sufficient fluence of UV illumination into large-scale water flows; thereby further limiting the efficiency of the multistep reactions required for micropollutant degradation to a benign product.
Recent studies have selected key “surrogates” for a wide array of micropollutants and quantitatively evaluated the extent of their degradation through a variety of advanced treatment processes.Reference Lee, Gerrity, Lee, Gamage, Pisarenko, Trenholm, Canonica, Snyder and von Gunten119,Reference Park, Anumol, Daniels, Wu, Ziska and Snyder122 For example, Lee et al.Reference Lee, Gerrity, Lee, Gamage, Pisarenko, Trenholm, Canonica, Snyder and von Gunten119 evaluated the extent and energy consumption required for micropollutant abatement, using combinations of O3, H2O2, and UV illumination with encouraging results (Fig. 9). Energy consumption required to achieve between 80 and 100% degradation of low concentrations of these small molecules appear to be in the range 0.1–0.2 kW h/m3, i.e., approximately a factor of 10× lower than for SWRO, but only slightly lower than RO energy consumption for water sources with lower total dissolved solids.Reference Cath, Elimelech, McCutcheon, McGinnis, Achilli, Anastasio, Brady, Childress, Farr, Hancock, Lampi, Nghiem, Xie and Yip129
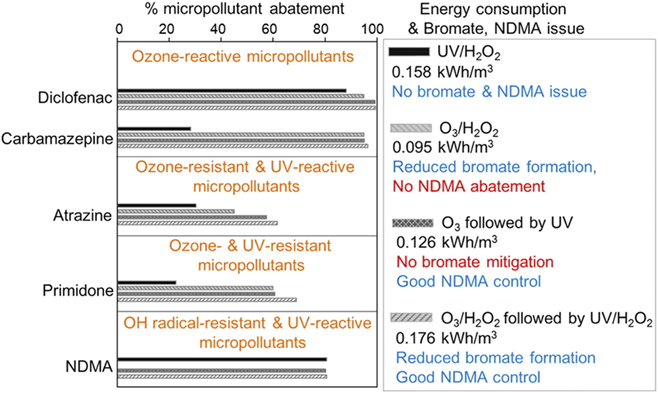
Figure 9. Estimates of micropollutant abatement, energy consumption (kW h/m3) to achieve that abatement, for complementary approaches using combinations of (i) low pressure UV illumination and H2O2; (ii) ozone (O3) and H2O2; (iii) O3 followed by UV illumination; and (iv) O3/H2O2 followed by UV/H2O2 treatment, for 5 typical micropollutants of possible concern in municipal effluent [diclofenac, carbamazepine, atrazine, primidone, and N-nitrosodimethylamine (NDMA)]. Possible issues with bromate formation or lack of control of NDMA are also shown in the comments. A total of 16 micropollutants were examined with comparable results for abatement, in 10 different secondary wastewater effluents. Reprinted from Ref. Reference Lee, Gerrity, Lee, Gamage, Pisarenko, Trenholm, Canonica, Snyder and von Gunten119, Lee et al. Environ. Sci. Technol., 2016 American Chemical Society by permission.
There are real opportunities to simultaneously improve the efficacy of AOPs and their energy efficiency. Electrochemical or photoelectrochemical processes can involve suspended photoactive metal oxide particles [e.g., TiO2—Fig. 10(a)] or monolithic high surface area photoactive metal oxide electrodes [e.g., Figure 10(b)].Reference Nosaka and Nosaka130–Reference Tada, Jin, Iwaszuk and Nolan133 Illumination of a metal oxide “anode” with blue/UV light (with energy above the oxide band gap energy) leads to formation of spatially separated electrical charges (holes and electrons). Hole capture can lead to OH˙ (or other strongly oxidizing species), whereas electron capture can lead to O2 reduction to form super oxide radicals (O2−˙). Either these reactive species, or their coupled products, can then assist in the degradation of micropollutants.Reference Tada, Jin, Iwaszuk and Nolan133,Reference Lee, Libera, Waldman, Ahmed, Avila, Elam and Darling134
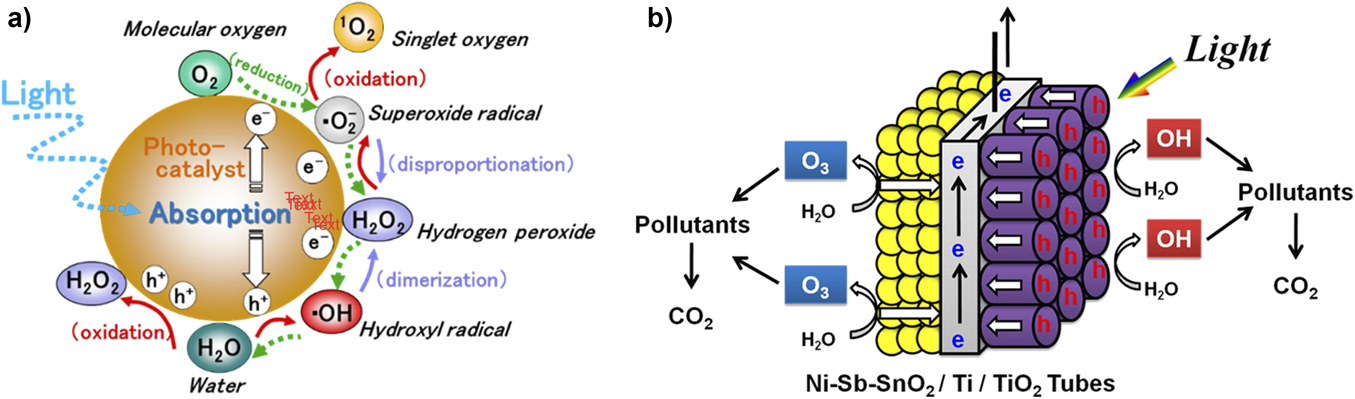
Figure 10. (a) Schematic views of pathways for photogeneration of reactive oxygen species, including OH˙, at the surface of a high band gap metal oxide catalyst, targeted for degradation of micropollutants. Following photoinduced charge separation, both oxidation and reduction can occur at the photocatalyst to generate OH˙ and related reactive species, to attack the most labile bonds in small molecule pollutants, ideally degrading them to environmentally benign products; (b) A schematic view of one of several proposed photocatalytic platforms; this one is based on bifacial thin film oxides, illuminated on one side, capable of generating highly reactive (oxidizing) species on both faces of the monolith. Source: Figure a is reprinted from Ref. Reference Nosaka and Nosaka130 (Nosaka et al., Chemical Reviews 2017, American Chemical Society by permission). Figure b is from Ref. Reference Yang, Choi and Park136 (ACS Appl. Mater. Interfaces, 2015, American Chemical Society by permission).
We note that the formation of OH˙ arises in electrochemical reaction pathways on the way to solar-assisted water splitting to form O2.Reference Fujishima, Zhang and Tryk131 When the goal is to create O2 from H2O, OH˙ is an expected (often adsorbed) intermediate but not the desired final product. In AOPs, adsorbed OH˙ is known to have the highest oxidative reactivity. Its effective concentration can be controlled by composition and energetics at the oxide/water interface.Reference Fujishima, Zhang and Tryk131,Reference Zigah, Rodriguez-Lopez and Bard135 It is conceivable that some of the most effective photoactive AOP catalysts, driving oxidation of micropollutants, will come from hybrid material sets previously explored in solar-assisted water splitting processes. Small adjustments to composition may yield large changes in both dark and photocatalytic oxidation chemistries.Reference Xie, Meng, Sun, Niu, Jiang, Bottomley, Li, Chen and Crittenden128,Reference Yang, Choi and Park136,Reference Mehrjouei, Mueller and Moeller137
Sorption as an alternative to membrane-based or AOP-based water treatment
An alternative approach to advanced water treatment is sorption on high surface area activated carbon (or activated bio-char) and related biomimetic dispersions of materials with high affinities for heavy metals and/or small molecules (emerging contaminants) and degradation products from AOPs that are not fully degraded to benign states.Reference Inyang and Dickenson138–Reference Juwarkar, Nair, Dubey, Singh and Devotta141 Production of activated carbon sources, with high surface area, can be quite energy intensive at scale, but the sorptive properties of these materials are compelling. Surface functional groups introduced as a result of activation have high affinity for heavy metals, and organic contaminants like those discussed above are retained by a combination of pore-filling, partitioning, and electrostatic and dispersive force interactions, with extremely good removal efficiencies for these contaminants. As with any sorption process, however, including sorption processes for water stored and treated in aquifers, sorption capacity is determined by the surface area of the activated carbon source, and saturation can be quickly reached, especially with extremely contaminated water sources. Reactivation of the high surface carbon source is possible, but energy intensive. Cheaper precursors to activated carbon, e.g., bio-chars are being explored, and may be the preferred approach to creation of potable water in certain regions.Reference Inyang and Dickenson138
Sensor networks, smart (big) data, and system controls
Energy production, manufacturing, mining, and agricultural processes which attempt to reuse water have relatively straightforward sensing and system control problems to solve.Reference Sweeney and Kabouris142–Reference Bourgeois, Burgess and Stuetz144 The contaminants to be removed before reuse are typically well characterized. Their concentrations typically vary temporally or geographically in predictable ways. Specific sensors with the requisite sensitivity, selectivity, and reliability can be integrated into a control network that can optimize both the process in question and the decision making needed to sustain that process for long periods.
Centralized water distribution systems that deal with only a few, predictable water sources have also implemented continuous monitoring processes and data management. This affords delivery of reliable water supplies to large urban and rural populations.Reference Bourgeois, Burgess and Stuetz144 Quite often, these centralized water treatment facilities have instituted both in-line sensing for specific contaminants and routine laboratory analyses that use combinations of chromatography, mass spectrometry, and atomic spectroscopies to quantify contaminant levels for both source and product waters where temporal fluctuations are of lesser significance.
When widely varied water sources must be reused and purified significantly, greater challenges may arise in both sensing contaminants and in forming integrated sensor networks. These challenges are linked to decision-making and water use policy.Reference Hutchins, McGrane, Miller, Hagen-Zanker, Kjeldsen, Dadson and Rowland145,Reference Eggimann, Mutzner, Wani, Schneider, Spuhler, de Vitry, Beutler and Maurer146 A multitude of inexpensive lab-on-chip sensing platforms have been developed and targeted to specific analytes using quite selective and sensitive transducer layersReference Sweeney and Kabouris142; however, there are relatively few examples where such sensors have been integrated into widely dispersed networks which are capable of round-the-clock monitoring of contaminants which range from disease-causing microorganisms, heavy metals, surfactants from energy extraction, to small molecule contaminants that may be found in urban and agricultural water sources.Reference Loeb, Hofmann and Kim123,Reference Gerrity and Snyder124 Sensor platforms in these complex water systems will need to provide for selective detection of perhaps 10–25 contaminants simultaneously and will need to be designed to resist fouling which leads to loss of both sensitivity and selective responses. They will also need to be networked (e.g., RF or optical telecommunications) into data centers capable of analyzing and curating data from >103 to 104 sensors simultaneously.Reference Sweeney and Kabouris142,Reference Yu, Anumol, Park, Pepper, Scheideler and Snyder143,Reference Eggimann, Mutzner, Wani, Schneider, Spuhler, de Vitry, Beutler and Maurer146 That data needs to be presented in formats that provide for ease of decision making and crisis management.Reference Eggimann, Mutzner, Wani, Schneider, Spuhler, de Vitry, Beutler and Maurer146 Such networks will be part of the push to form “precision communities.” Public services, now provided in various hybrids of analog and digital data and controls, are predicted to be parts of feedback loops which automatically optimize energy and water availability and consumption.Reference Scott, Kurian, Wescoat, Kurian and Ardakanian68
Policy/public acceptance
Public perceptions of the quality and availability of water being produced from these disparate sources will be critical to the adoption of new water management, reuse, and purification strategies. New technologies may be developed that produce high purity water for human consumption with more than adequate sensing technologies and networks. If these developments are not accompanied by new understandings of how public perception of water quality and reliability are formed, they may not be adopted at all.4,Reference Eggimann, Mutzner, Wani, Schneider, Spuhler, de Vitry, Beutler and Maurer146,Reference Libralato, Volpi Ghirardini and Avezzu147
There have been significant studies of risk perception in water supplies, especially for urban consumption.Reference Scott, Kurian, Wescoat, Kurian and Ardakanian68,Reference Libralato, Volpi Ghirardini and Avezzu147 In some communities, such as Singapore, which has no reliable clean water source, considerable progress has been made both practically and theoretically in providing clean water from municipal waste and in creating public confidence in that “NEWater” source.Reference Lee and Tan148 In the near future, an equal effort is likely to be needed on a massive scale in a number of other developed or developing societies, including the United States. Understanding and affecting public perception of reused/purified water will need to be tightly coupled to basic and applied research in water treatment, storage, and fit-for-purpose purification.
Regional test beds
The outcomes of several of the recent NSF- and DOE-sponsored workshops have consistently pointed out the need for regional test beds where new water purification and energy conversion/storage technologies and unit operations could be tested in an integrated fashion, in some cases, coupled to food production.Reference Moniz, Knotek and Orr1 An example of such a test bed is the Water, Energy, and Sustainable Technology (WEST) Center at the University of Arizona (http://west.arizona.edu/). WEST arose from an unusual partnership between UA, Pima County, and the City of Tucson Waste Water Treatment and Research Facilities. WEST provides an open environment where new water purification technologies are compared, both with regard to degree of water purity produced and with respect to energy consumption required to achieve a desired purity. Water purification occurs with flow volumes that make it possible to evaluate technologies operating at scales that can be extrapolated to facilities that need to operate at massive scales.
CEA platforms as described above provide another straightforward means to control energy creation and energy consumption,Reference Benatto, Corazza, Roth, Schutte, Rengenstein, Gevorgyan and Krebs149–Reference Corrado, Leow, Osborn, Carbone, Hellier, Short, Alers and Carter153 water reuse and purification, and quantitative assessments of crop yield and food purity and quality, and several examples are appearing world-wide which successfully integrate these new modalities.Reference Ishii, Sase, Moriyama, Okushima, Ikeguchi, Hayashi, Kurata, Kubota, Kacira and Giacomelli34,Reference Forberich, Guo, Bronnbauer and Brabec150,Reference Tilman, Cassman, Matson, Naylor and Polasky154
A large step above conventional greenhouse agriculture, entities such as Biosphere 2, near Tucson, Arizona (Fig. 11) are of interest as mesoscale test beds. Biosphere 2 was originally created to determine whether human life could be sustained for up to two years in an otherwise sealed environment.Reference Allen and Nelson155 All of the energy, water, and food requirements for several humans were provided, either grown inside the large sealed environment with several different microclimates, or through the use of conjoined and quantifiable energy and water sources. The scientific mission for Biosphere 2 would likely be approached differently today, but it has become clear that entities like Biosphere 2 have the potential to address some of the big questions summarized in this article. Biosphere 2 has all the complexities of large human habitats, sized and isolated enough to allow for optimization of energy, water, and environmental variables that would otherwise be impossible to control.

Figure 11. The University of Arizona’s Biosphere 2 provides the possibility for controlled-environment studies of the interactions between energy and water and ultimately, food. The entire enclosure is large enough to provide the complexities of a real community, while remaining small enough to provide for control of the most critical variables. As an example, a portion of Biosphere 2 now houses the LEO, an NSF-funded project creating three identical sloped landscapes (30-m length, 11-m width, 1 m depth) filled with 500 metric tons of crushed basalt and approximately 1800 sensors. Water chemistry, carbon levels, and energy cycling processes, and the physical and chemical evolution of the landscape at submeter to whole-landscape scales, are monitored as the landscape evolves and plant life is introduced. http://biosphere2.org/.
The most prominent recent example of what can be done in experimental environment of this type is the NSF-funded Landscape Evolution Observatory (LEO).Reference Tucson156–Reference Pangle, DeLong, Abramson, Adams, Barron-Gafford, Breshears, Brooks, Chorover, Dietrich, Dontsova, Durcik, Espeleta, Ferre, Ferriere, Henderson, Hunt, Huxman, Millar, Murphy, Niu, Pavao-Zuckerman, Pelletier, Rasmussen, Ruiz, Saleska, Schaap, Sibayan, Troch, Tuller, van Haren and Zeng158 Inside a portion of the Biosphere environment, three identical sloped landscapes have been created (30-m length, 11-m width, 1 m depth) filled with 500 metric tons of pristine proto-soil (crushed basalt), subjected to “weather-like” events over a period of up to 10 years. Approximately 1800 embedded sensors provide round-the-clock monitoring of water chemistry, carbon levels, and energy cycling processes. The physical and chemical evolution of the landscape is monitored at submeter to mesoscopic length scales, as the landscape evolves and plant life is introduced. We can easily imagine the extrapolation of projects such as this to quantify the exact energies needed to sustain fit-for-purpose water and human-consumable plant and animal life at scales that matter.
Summary and conclusions
Accommodating up to 11 billion people on this planet by mid-century will be critically dependent upon our ability to mitigate climate variability and the energy/water stress that has arisen from increased energy use, especially from water-intensive energy sources. We must understand the origins of water stress and the links between energy production and use, food production and consumption, and pathways to create fit-for-purpose water with distributed, energy-efficient technologies. To do this nationally and globally will require the integration of science and technology, public acceptance, and policy/decision making, on a scale that we have yet to collectively achieve. After consideration of the features of the Energy/Water/Food nexus summarized above the anticipated 2040–2050 U.S. energy usage summarized in Fig. 2 (and by inference global energy use) may be underestimated. Given the energy consumption currently needed to produce “clean” water from suboptimal sources, and given that suboptimal water sources are going to be (or already are) a primary source of water for a large segment of the U.S. (and world) populations, we may collectively need even more energy by mid-century than initially projected. This will certainly exacerbate the water stress already present in the production and use of that energy.
Thus, there will be clear advantages to enhanced conservation measures (our first line of attack) and in developing and adopting only the most energy-efficient means to create suitable water sources. These are likely to be the desired policy direction which are economically most sound and are likely to lead to enhanced security of our energy, water, and food sources. As has been the case for the development of low-carbon-footprint energy conversion technologies, extraordinary levels of innovation will be required. This level of innovation, no matter where in the world it originates, will yield new avenues for economic development and resilient communities.
Acknowledgments
We would like to acknowledge the inspiration, and the organizational and logistical support provided by a large group of University of Arizona faculty and staff who helped to make the original Energy, Water, Food workshop at Biosphere 2 possible: Parker Antin, Ardeth Barnhart, Eric Betterton, Gene Giacomelli, Lucio Guerrero, Kim Patten, Mary Poulton, Stanley Reynolds, and Dan Moseke. The participants in this workshop, who came from a variety of national and international universities, government laboratories and industries, listed in Ref. Reference Armstrong, Antin, Barnhart, Betterton, Giacomelli, Guerrero, Ogden, Patten, Poulton, Reynolds and Snyder5, likewise played a key role in creating the perspective for this review. Our perspective was also shaped by the January 2017 DOE workshop, “Basic Research Needs for Energy and Water: Science to Enable Energy-Efficient Clean Water and Water-efficient Energy—Department of Energy—Office of Science.”2
Critical discussions with Mike Knotek, Bill Tumas, David Ginley, David Cahen, Elizabeth Kocs, and Antonio Terrasi helped to shape this review, along with the participation of NA in the “Materials for Energy and Sustainability” school and the “EPS-SIF International School on Energy,” both in Erice, Italy in 2016.
The National Science Foundation, CHE-1539597, provided financial support for the original Energy Water Food workshop.