


Crossref Citations
This article has been cited by the following publications. This list is generated based on data provided by Crossref.
Ghosh, Aritra
2020.
Potential of building integrated and attached/applied photovoltaic (BIPV/BAPV) for adaptive less energy-hungry building’s skin: A comprehensive review.
Journal of Cleaner Production,
Vol. 276,
Issue. ,
p.
123343.
Tayagaki, Takeshi
Shimura, Haruya
Sasaki, Ayumi
and
Yoshita, Masahiro
2021.
Comparative Study of Power Generation in Curved Photovoltaic Modules of Series- and Parallel-Connected Solar Cells.
IEEE Journal of Photovoltaics,
Vol. 11,
Issue. 3,
p.
708.
Victoria, Marta
Haegel, Nancy
Peters, Ian Marius
Sinton, Ron
Jäger-Waldau, Arnulf
del Cañizo, Carlos
Breyer, Christian
Stocks, Matthew
Blakers, Andrew
Kaizuka, Izumi
Komoto, Keiichi
and
Smets, Arno
2021.
Solar photovoltaics is ready to power a sustainable future.
Joule,
Vol. 5,
Issue. 5,
p.
1041.
Mariani, Paolo
Agresti, Antonio
Vesce, Luigi
Pescetelli, Sara
Palma, Alessandro Lorenzo
Tomarchio, Flavia
Karagiannidis, Panagiotis
Ferrari, Andrea C.
and
Di Carlo, Aldo
2021.
Graphene-Based Interconnects for Stable Dye-Sensitized Solar Modules.
ACS Applied Energy Materials,
Vol. 4,
Issue. 1,
p.
98.
Peters, I.M.
Breyer, C.
Jaffer, S.A.
Kurtz, S.
Reindl, T.
Sinton, R.
and
Vetter, M.
2021.
The role of batteries in meeting the PV terawatt challenge.
Joule,
Vol. 5,
Issue. 6,
p.
1353.
Peters, Ian Marius
Hauch, Jens
Brabec, Christoph
and
Sinha, Parikhit
2021.
The value of stability in photovoltaics.
Joule,
Vol. 5,
Issue. 12,
p.
3137.
Wylie, Zachery R.
Ruffolo, Peter
Campagna, Rory M.
and
Christians, Jeffrey A.
2021.
Measuring Phase Changes to Predict Halide Perovskite Solar Cell Degradation.
p.
0226.
Shi, Yang
Wang, Qingyang
Zeng, Jian
Yao, Yingxue
and
Chen, Renkun
2021.
Boiling with ultralow superheat using confined liquid film.
Applied Thermal Engineering,
Vol. 184,
Issue. ,
p.
116356.
Schuster, Christian Stefano
Crupi, Isodiana
Halme, Janne
Koç, Mehmet
Mendes, Manuel João
Peters, Ian Marius
and
Yerci, Selçuk
2021.
Handbook of Climate Change Mitigation and Adaptation.
p.
1.
Gordon, Jeffrey M.
Fasquelle, Thomas
Nadal, Elie
and
Vossier, Alexis
2021.
Providing large-scale electricity demand with photovoltaics and molten-salt storage.
Renewable and Sustainable Energy Reviews,
Vol. 135,
Issue. ,
p.
110261.
Huang, Yi-Teng
Kavanagh, Seán R
Scanlon, David O
Walsh, Aron
and
Hoye, Robert L Z
2021.
Perovskite-inspired materials for photovoltaics and beyond—from design to devices.
Nanotechnology,
Vol. 32,
Issue. 13,
p.
132004.
Carrod, Andrew J.
Gray, Victor
and
Börjesson, Karl
2022.
Recent advances in triplet–triplet annihilation upconversion and singlet fission, towards solar energy applications.
Energy & Environmental Science,
Vol. 15,
Issue. 12,
p.
4982.
Goyal, Naveen
and
Rai, Rajeev Kumar
2022.
Metal-Organic Frameworks (MOFs) as Catalysts.
p.
731.
Schuster, Christian Stefano
Koc, Mehmet
and
Yerci, Selcuk
2022.
Analytic modelling of multi-junction solar cells via multi-diodes.
Renewable Energy,
Vol. 184,
Issue. ,
p.
1033.
Schuster, Christian Stefano
Crupi, Isodiana
Halme, Janne
Koç, Mehmet
Mendes, Manuel João
Peters, Ian Marius
and
Yerci, Selçuk
2022.
Handbook of Climate Change Mitigation and Adaptation.
p.
1165.
Kazmerski, Lawrence L.
2022.
Comprehensive Renewable Energy.
p.
8.
Wiedner, Eric S.
Appel, Aaron M.
Raugei, Simone
Shaw, Wendy J.
and
Bullock, R. Morris
2022.
Molecular Catalysts with Diphosphine Ligands Containing Pendant Amines.
Chemical Reviews,
Vol. 122,
Issue. 14,
p.
12427.
Le Ferrand, Hortense
and
Meiksin, Judy
2023.
Celebrating 50 years of MRS!.
MRS Bulletin,
Vol. 48,
Issue. 4,
p.
423.
Firetto, Carla M.
Starrett, Emily
and
Jordan, Michelle E.
2023.
Embracing a culture of talk: STEM teachers’ engagement in small-group discussions about photovoltaics.
International Journal of STEM Education,
Vol. 10,
Issue. 1,
Echevarria, Angel
Rivera-Matos, Yiamar
Irshad, Nafeesa
Gregory, Christopher
Castro-Sitiriche, Marcel J.
King, Richard R.
and
Miller, Clark A.
2023.
Unleashing Sociotechnical Imaginaries to Advance Just and Sustainable Energy Transitions: The Case of Solar Energy in Puerto Rico.
IEEE Transactions on Technology and Society,
Vol. 4,
Issue. 3,
p.
255.
Richard E. Smalley, in 2003, defined the Terawatt (TW) Challenge as “Adapting our energy infrastructure to simultaneously address diminishing oil resources and rising levels of atmospheric CO2.” Smalley, best known for the discovery of C60, for which he received the 1996 Nobel Prize in Chemistry, continued to address the challenges of anthropomorphic and natural global energy flowsReference Smalley1,Reference Smalley2 until he passed away in 2005.
Smalley challenged the world to transform the energy sector. He envisioned electricity transmitted by high-voltage direct current (DC) lines from massively deployed solar plants in sunny areas and remotely sited nuclear plants. He also envisioned using advanced batteries for local storage of energy. To meet the needs of ∼1010 people in a world with a dwindling oil supply, Smalley asserted that the world would need to transform its fossil-fuel-driven 14-TW (average power) energy used in 2003 to a largely renewable-energy-driven 30–60 TW (average power) in 2050. This would be possible only if solar-electricity costs could be drastically reduced. The challenges associated with this transition have been called the “Terawatt Challenge.”
Nobel Laureate Richard E. Smalley described “The Terawatt Challenge” as the need to develop a new power source capable of increasing “our energy output by a minimum factor of two, the generally agreed-upon number, certainly by the middle of the century, but preferably well before that.” Credit: Brookhaven National Laboratory.
Fifteen years later, solar-module costs have been reduced tenfold, and annual deployment of solar photovoltaic (PV) modules has grown by a factor of 100. The installation rate for PV has increased from an average of ∼1 gigawatt (GW)/year in 2004 to ∼100 GW/year in 2018, with a total of 500 GW capacity installed worldwide, producing 2% of the planet’s electricity.
As global solar-generating capacity approaches 1 TW, we revisit Smalley’s TW Challenge to identify what has changed. We quantify the TW Challenge for a baseline scenario that extrapolates current trends. We also envision two other bracketing scenarios: one showing the most efficient and the other an inefficient system depending on the use of electrification and storage. We show that the energy choices we make today will dramatically affect the magnitude of future global energy requirements.
In the 16 years since Smalley posed his TW Challenge, some things have evolved as he predicted. The world’s population has grown, and evidence for climate change is becoming clearer, increasing the urgency of the challenge. However, a few things would have surprised Smalley. Notably, instead of fossil fuel production decreasing, the United States now produces more oil and gas than in Smalley’s day, and OPEC (Organization of Petroleum Exporting Countries) is actively curtailing oil production to increase prices. Although an oil shortage could still develop, today’s TW Challenge is no longer motivated by a shortage of oil, as in Smalley’s day, but rather by an increased urgency to reduce greenhouse gas emissions in response to visible changes in global climate.
Smalley also would have been surprised at how quickly PV deployment has increased,Reference Creutzig, Agoston, Goldschmidt, Luderer, Nemet and Pietzcker3 and that the price of solar panels since his article was published has dropped by a factor of 10. Global solar electricity generation rose from 4.1 TWh in 2005 to 263 TWh in 2015 (a 64-fold increase, corresponding to 50% annual growth). The same 64-fold growth between 2015 and 2025 would result in >16,000 TWh of solar electricity in 2025, which is more than half of the anticipated total global electricity demand (31,000 TWh) in 2025. This demonstrated growth capability positions solar electricity to play the central role that Smalley envisioned. Wind energy also has matured, increasing from 104 TWh in 2005 to 834 TWh in 2015 (eightfold growth). A summary of Smalley’s analysis relative to the current status is provided in Table I.
Table I. Key elements/conclusions of Smalley’s analysisReference Smalley1,Reference Smalley2 and current status.
In light of these changes and, more importantly, as more than 60 countriesFootnote * and some US statesFootnote † have committed to transitioning to net zero-carbon emissions, it is useful to revisit Smalley’s TW Challenge. Doing so can guide prioritization of research, policy, and commercial investments by better understanding how choices in electrification and storage will affect the total energy-system efficiency and the related investment needed for low-carbon technologies.
Defining scenarios
The world has begun an energy transition; it is naturally useful to consider how this transition could evolve. Many research groups and organizationsFootnote ‡ have analyzed future energy scenarios using detailed models with extensive inputs befitting the complex and interacting energy landscape. All of these studies provide value to understanding future energy scenarios, but each makes many assumptions that can affect the conclusions of the modeling, often making it difficult to understand why the studies reach somewhat different conclusions.Reference Breyer, Bogdanov, Gulagi, Aghahosseini, Barbosa, Koskinen, Barasa, Caldera, Afanasyeva, Child, Farfan and Vainikka4–Reference Jacobson and Delucchi6 Here, we present a complementary approach that identifies and applies a very small number of key assumptions, exploring their effects at the global level, following Smalley’s approach.
Global annual energy needs can be calculated by estimating the average annual energy demand per person and multiplying this by the world’s population. We use population projections by the UN and othersReference Gerland, Raftery, Ševcíková, Li, Gu, Spoorenberg, Alkema, Fosdick, Chunn, Lalic, Bay, Buettner, Heilig and Wilmoth7 of 10 billion people by 2050. (See supplementary content online.) Estimating the global average energy intensity (i.e., energy consumption per capita) in 2050 is more challenging. As the energy system is transformed to reduce greenhouse gas emissions, the associated innovations may either increase or decrease energy demand.
A transformed energy infrastructure in 2050 will be a complex mixture of many energy-generating technologies, with a range of efficiencies and convenience. To facilitate discussion of this complex topic, we consider a baseline Scenario A that extrapolates current trends, and two hypothetical scenarios, B and C, that bracket our future energy trajectory, constructed to be the most and least efficient systems we envision to be tenable. Scenario B will provide a lower limit by assuming an optimally efficient system using electrification. Scenario C will provide the upper limit by including the need to extensively store energy from the variable solar and wind energy sources. Scenario B was easily chosen as the most efficient scenario we could envision. Scenario C was more difficult to select because we could always envision a way to be less efficient. Scenario C was chosen to describe a world that retains our current infrastructure, including not only our internal-combustion-engine (ICE) cars, but also our gas stoves and fireplaces. However, instead of using fossil fuels, Scenario C envisions today’s infrastructure driven by hydrocarbons synthesized from direct-air-capture carbon dioxide and renewable electricity.
We first consider the historical data for energy intensity, and then analyze the impacts of electrification and storage on energy delivery efficiency to understand how these will affect energy intensity. We then calculate the anticipated energy demand for each scenario.
Energy intensity
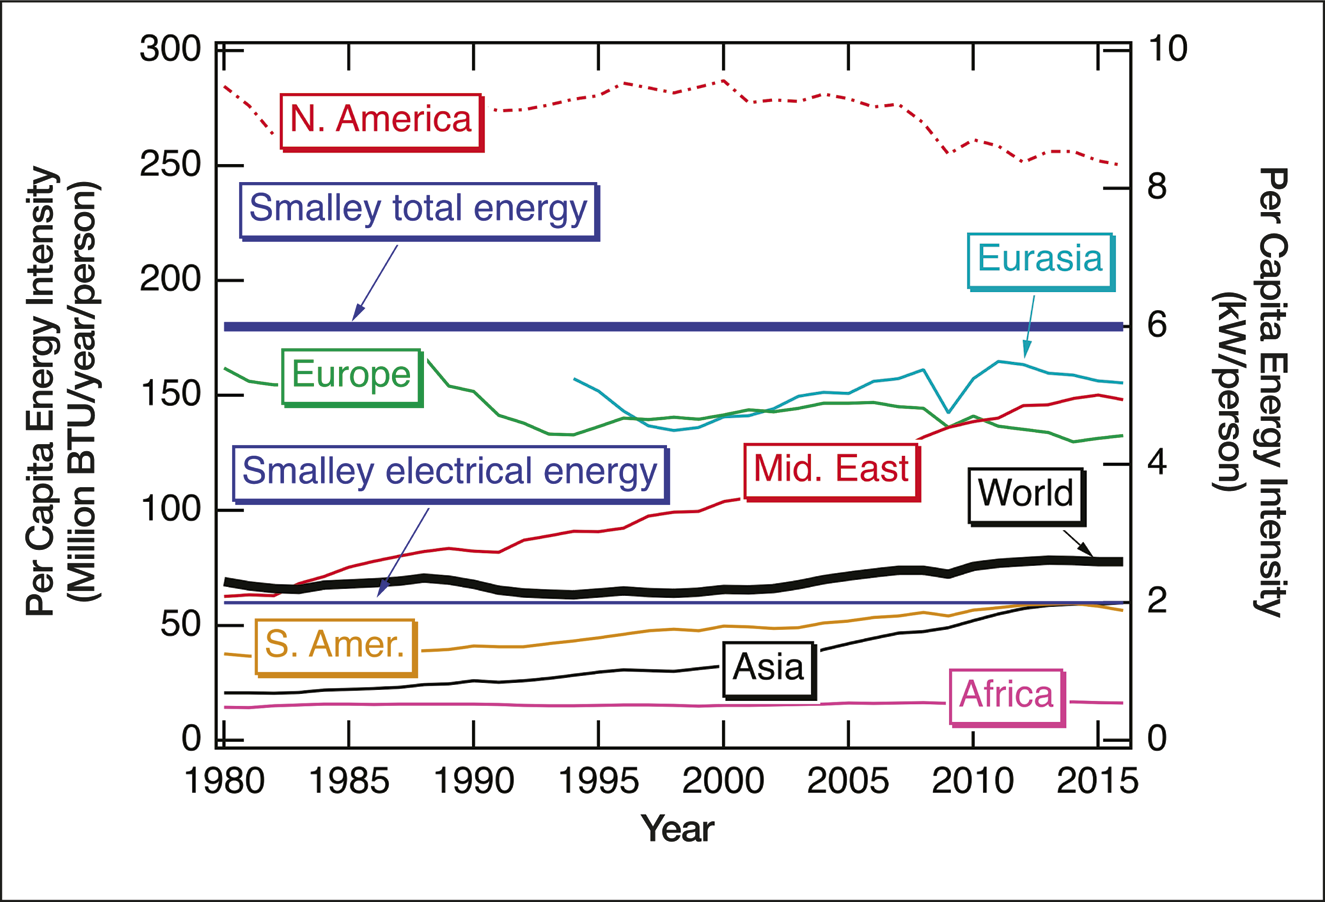
Energy intensity is defined as the energy needed per capita (i.e., the average power that a person uses for all aspects of life). Historical data for energy intensity for the world overall, as well as for individual continents, are shown in Figure 1. The range of energy intensities has historically been bounded by North America as the highest and Africa as the lowest energy intensity. The Middle East and Asia have both doubled their use of energy per person in recent decades. There has been some improvement in energy efficiency in North America and Europe.
Figure 1. Average energy intensity for the world and the continents in units of BTU/year/person (left axis) and average power consumption in units of kW/person (right axis). Data source: US Energy Information Administration. Smalley’s estimate of 60 TW energy for 10 billion people is shown by the bold blue line, and the corresponding electricity requirement by the thinner blue line.
Even with our existing energy system, one can consider a range of levels at which the world’s energy intensity could be stabilized. A high level of 8 kW/person would reflect a high degree of development and consumption. Alternatively, it may be possible to achieve comfortable living at a value between 4 kW/person and 5 kW/person, as is currently the case for Europe. Smalley suggested that 10 billion people would require 60 TW total average power or 20 TW of electrical average power. The latter corresponds to 2 kW/person average electrical power.Reference Smalley2
Prediction of the energy intensity in the coming decades has higher uncertainty than population growth, but a simple extrapolation of the data in Figure 1 results in a prediction of 3.2 ± 0.5 kW/person by 2050. In addition to economic development around the world, we expect that the energy intensity will be affected by transitioning the energy system to a low-carbon system, possibly increasing or decreasing the overall energy intensity substantially through use of inherently inefficient energy-storage or adoption of energy-efficient technology, respectively. Therefore, we next discuss opportunities to reduce the energy intensity by using electrification as well as developments that could increase the overall energy intensity (e.g., using seasonal energy storage) as the energy transition proceeds.
Increased efficiency from electrification
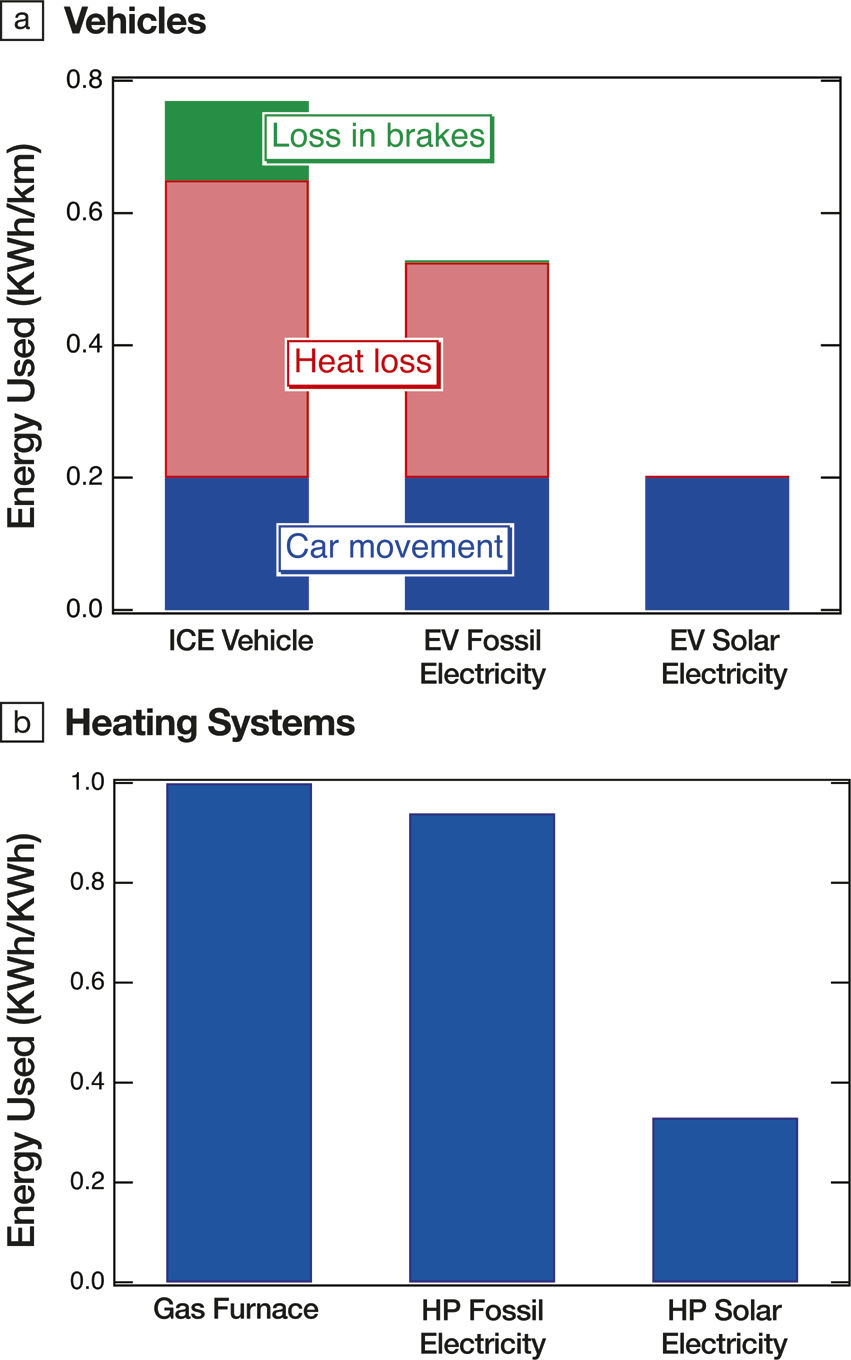
Electrification of the transport sector can play a significant role in reducing energy use. Figure 2a compares the energy use of electric vehicles (EVs) with that of conventional ICE vehicles. EV energy use is subcategorized by the power source: electricity from fossil fuels or from solar. The rightmost bar shows the solar energy in kWh that is needed to drive an EV 1 km. This value (0.2 kWh/km) is the median rating for the current top 15 EVs in the US market. The middle bar shows the equivalent fossil fuel energy needed, which increases to 0.53 kWh/km because of the efficiency (38%) of current fossil fuel power plants. The leftmost bar indicates the equivalent gasoline energy needed for a combustion engine. The median value for 2018 US vehicles is 27 mpg or ∼0.8 kWh/km. ICE vehicles suffer from lower thermal efficiency and higher energy loss from braking compared with EVs. In combination, EVs directly charged with solar electricity require less than one-third the energy required by combustion vehicles. The efficiency improvement is significantly less if the electricity is produced from fossil fuels.
Figure 2. (a) Energy (kWh) used to drive 1 km by an average 2018 US internal-combustion-engine (ICE) vehicle (left bar), by an electric vehicle (EV) with regenerative braking charged by electricity generated from fossil fuels (middle bar), and for an EV charged directly by solar-generated (or wind-generated) electricity (right bar). (b) Energy used for heating: a 100% efficient gas furnace compared with a heat pump (HP), with a coefficient of performance equal to three, driven by fossil-generated and solar-generated (or wind-generated) electricity. Supporting data can be found on US Department of Energy websites and in the British Petroleum Statistical Review of World Energy.
Energy use can also be reduced by electrifying heating systems. In Figure 2b, we compare different types of heating systems, indicating the kWh equivalents of chemical or electrical energy needed to deliver 1 kWh of heat (kWh/kWh). The left bar shows the chemical energy needed for a 100% efficient gas furnace (typical furnaces are 70–80% efficient, high-end furnaces can be above 90%). The middle bar indicates the energy needed for a heat pump using fossil fuel electricity generated by a 38% efficient power plant. The assumed coefficient of performance (COP) for the heat pump, the ratio of delivered heat energy (output) to electrical energy (input), is assumed to be three. Based on our survey of different types of electric heat pumps, a COP of three is a good average under common working conditions.Reference Hawlader, Chou and Ullah8 The right bar shows the equivalent solar electricity needed to drive the same heat pump. As with transportation, the comparison shows that the amount of solar energy needed is roughly one-third of the equivalent chemical energy for heating purposes.
Decreased efficiency from need to store energy
In a fossil-fuel-free world, the need to balance supply and demand for electrical energy at all hours of the day is likely the biggest barrier to using variable sources such as solar and wind electricity to meet the TW Challenge. Intercontinental transmission lines could address both the diurnal variation, by connecting locations with different longitudes, and seasonal variations, by connecting the Northern and Southern Hemispheres. These would require substantial infrastructure investments and would be politically challenging.
To minimize the need for energy storage, it is better to use as much electricity as possible at the time of generation. For thermal applications, rather than storing solar electricity in batteries during the day to run heating or cooling at night, the energy is used directly to generate a heated or cooled medium that is stored until after sunset. Such infrastructure is common today in locations with substantial cooling loads and electricity rates that vary with the time of day. Similarly, EVs may be charged directly when electricity is available instead of storing the electricity in a separate battery and then transferring that electrical charge to the EV battery. Some energy uses—such as generation of ammonia, hydrogen, plastics precursors, and other chemicals—directly result in energy products that are easily stored. A smart grid could also increase the fraction of electricity that is used directly.
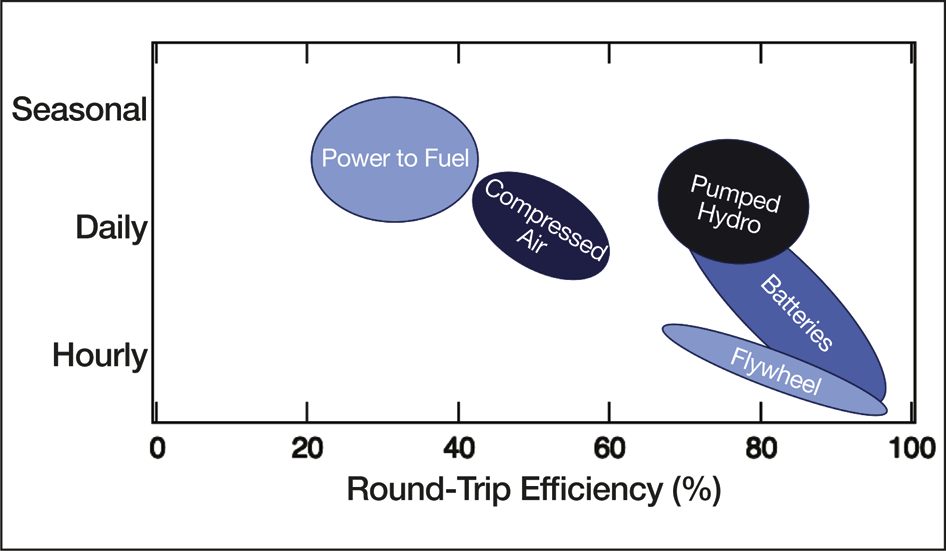
However, some amount of variability will need to be balanced with storage to allow for readily available energy use. Short-term electricity storage in flywheels, supercapacitors, or batteries can be quite efficient, but long-term storage options tend to fare worse. Figure 3 summarizes typical round-trip (electricity-to-storage-to-electricity) efficiencies for a few long- and short-term storage technologies, illustrating this trend. The bubbles in Figure 3 are placed to reflect the round-trip efficiency and estimates of the practical time of storage based on both energy-loss rates and large-scale storage feasibility.
Figure 3. Practical storage durations mapped versus round-trip electricity-to-storage-to-electricity efficiencies for several storage technologies. The color saturation of each bubble reflects the technology maturity (cumulative deployment).
Terawatt scenarios: Placing bounds on the TW Challenge
Based on this analysis, the magnitude of the TW Challenge will likely be within a lower limit associated with complete electrification and direct energy use (Scenario B), and the need to extensively store energy from variable solar and wind energy sources (Scenario C). Lower and upper bounds can be established by assessing these two idealized but very different pathways to low-carbon energy systems. Practicality suggests that the world will choose a hybrid approach, likely with elements of each of these and other scenarios; however, defining these bracketing, even if unrealistic, scenarios will help clarify the ramifications of the choices we make. The scenarios are summarized in Table II.
Table II. Definition of scenarios and associated size of the TW Challenge.
*The photovoltaic (PV) needed calculation assumes 50% of energy is derived from PV, with a 16% global average capacity factor consistent with EIA 2015 values. The units are the TW for the DC capacity ratings of the plants. “Capacity factor” is the energy delivered relative to what could have been delivered if the plant ran continuously at its rated power.
We estimate the magnitude of the TW Challenge using the three scenarios described in Table II, focusing, for simplicity, on estimates for 2050. Similar to Smalley, we assume a global population of 10 billion.Reference Gerland, Raftery, Ševcíková, Li, Gu, Spoorenberg, Alkema, Fosdick, Chunn, Lalic, Bay, Buettner, Heilig and Wilmoth7 From Figure 1, we predict that the energy intensity will be 3.2 ± 0.5 kW/person for the business-as-usual baseline case (Scenario A). Thus, for the baseline TW Challenge in 2050, we obtain 32 ± 5 TW average power. If we assume that 50% of that energy will be supplied by PV, with a 16% capacity factor consistent with US Energy Information Administration (EIA) data from 2015, we estimate that 100 TW of PV modules will be required.
Table II also summarizes estimates of the TW Challenge if the energy system would be transformed into the most efficient (Scenario B) or least efficient (Scenario C) scenarios. If we assume under Scenario B that today’s energy (e.g., coal and natural gas) used for electricity generation is replaced with the energy of the generated electricity and all other energy use is reduced to one-third based on full electrification (Figure 2), only 37% of the baseline energy would be required.
On the other hand, if we use all future installations of renewable electricity to turn carbon dioxide and water into hydrocarbons, and use those in today’s infrastructure instead of fossil fuels, we will need more energy. According to the IEA World Energy Outlook 2019, approximately 80% of energy was derived from coal, oil, and gas in 2017. If the process for converting renewable electricity to hydrocarbons is 50% efficient, then the energy needed to supply those hydrocarbons would be double that (160% of the baseline), increasing the total energy demand to 180% of the baseline. The basis for the 50% efficiency estimate is described in the supplementary material. There is high uncertainty in this estimate, as existing air-to-fuel demonstration projects are still on a small scale and mostly use natural gas for part of the process. The near-term efficiency for conversion of CO2 to hydrocarbons from renewable energy is likely to be much lower than 50%, while there is potential to increase the efficiency above 70% in the long term.Reference Graves, Ebbesen, Mogensen and Lackner9 Other long-term storage options are available, including hydrogen. We found 50% (±20%) round-trip efficiency to be a plausible assumption. If the 50% efficiency were replaced with a 30% efficiency, the 180 TW would increase to almost 300 TW.
In Table II, estimates for the three TW Challenge scenarios in which solar meets 50% of the energy demand range from 12 TW to 58 TW average power or 37 TW to 180 TW of DC capacity. The possibility of reducing the TW Challenge by almost a factor of five provides strong motivation to develop a more efficient energy system, including aggressively electrifying our energy system and, at the same time, identifying opportunities to deliver renewable energy directly to the end application.
Implications for the photovoltaic industry
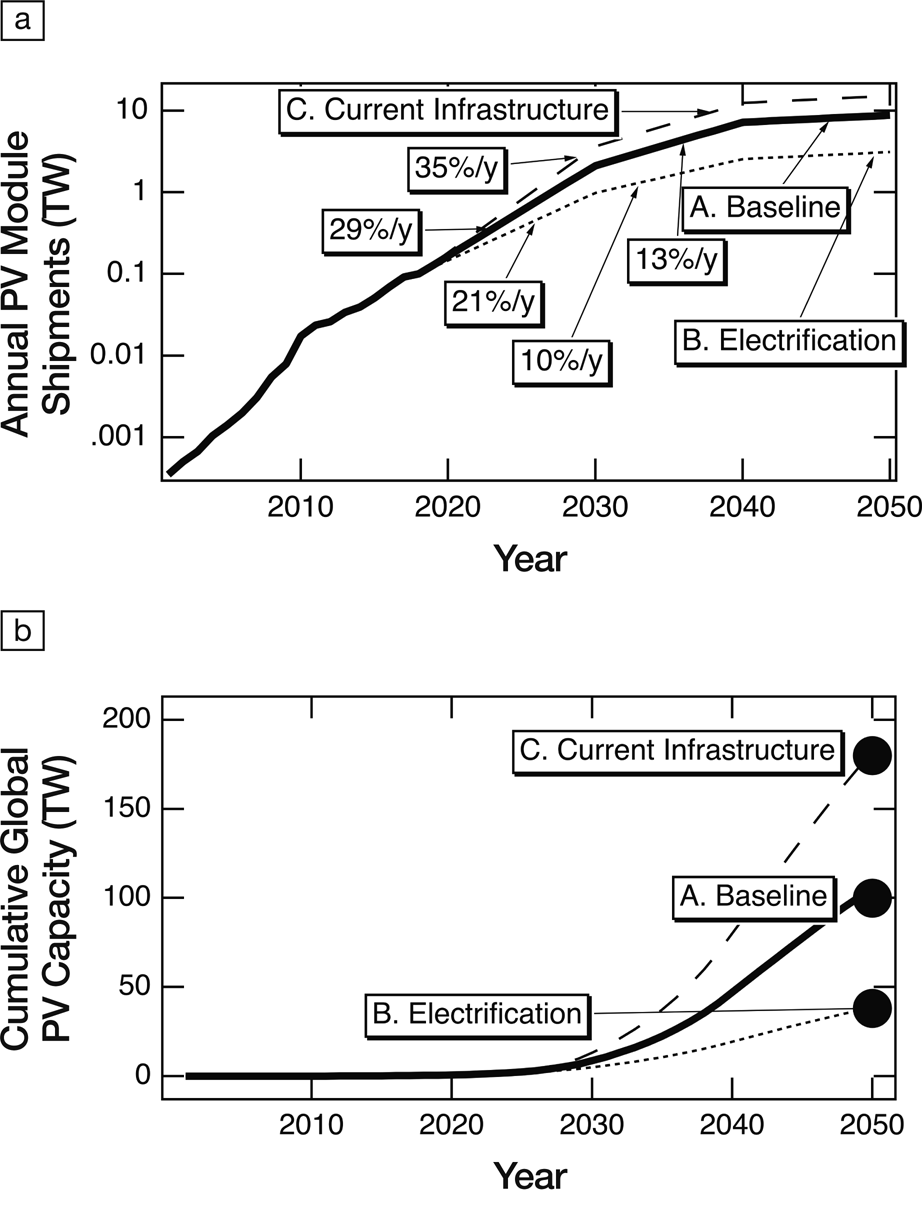
An obvious question is whether the solar industry is positioned to deliver on this challenge. While both solar thermal and solar PV technologies can contribute, here we focus on the PV industry because it is better established. From 2001 to 2015, PV shipments increased by a factor of 145, which is equivalent to an average increase of ∼43%/year. Figure 4 shows PV growth scenarios that would extend historical growth to meet each of the scenarios described in Table II, with the least-efficient scenario using 35%/year growth until 2030, followed by a more moderate 13%/year growth rate from 2030 to 2040, and 2%/year between 2040 and 2050. The other scenarios could be met with lower growth rates, as presented in Figure 4.
Figure 4. Historical and projected photovoltaic (PV) growth scenarios for (a) annual shipments and (b) cumulative global capacity that could meet the TW Challenge estimated for the three scenarios, which use 35%, 29%, or 21%/year, respectively, until 2030 and lower rates later.
Each curve is a continuation of previous (demonstrated) growth rates, but would require massive capital input that may be difficult to mobilize in the described time frame, especially since many governments have phased out the programs that stimulated the PV market. Materials supply rates for PV manufacturing would need to increase by a factor of 30–200 over current levels, which, in turn, would require modifications to PV module design, such as a reduction of silver usage to avoid materials shortages.
Conclusion
As the world embarks on a major energy transition, difficult decisions will need to be made about investments in research, infrastructure development, and product deployment for energy generation and usage. It is too early to predict which transportation technologies will dominate in 2050, but decisions are already being made to simultaneously develop the infrastructure to support EV, fuel-cell vehicles, and natural-gas vehicles. Similarly, we may choose to invest in a smart grid that is effective at balancing supply and demand for electricity by primarily controlling loads rather than generators and in the reduction of factory capital costs to enable factories to be cost-effective, even when they operate intermittently. On the other hand, if we choose a path that relies on large-scale seasonal storage, the TW Challenge may be highly dependent on the efficiency of the seasonal storage, motivating major research investment for improving that efficiency. As we make these choices, it is useful to consider how each choice and proposed pathway will affect the overall challenge.
Although Smalley did not anticipate the resurgence of the US oil and gas recovery nor the rapid growth of EVs, his perspective in 2003–2005 was visionary. Sixteen years later, we now estimate that continuing on our current trajectory will require 32 TW ± 5 TW of average global power in 2050. If solar supplied 50% of this, it would require a total installation of ∼100 TW of solar panels, based on a 16% capacity factor. A decision to prioritize pathways using electrification and avoiding the need for long-term storage could cut that number by almost a factor of three, while using hydrocarbon synthesis from air to power our current infrastructure (or other scenarios requiring substantial long-term storage) could increase it by almost a factor of two. Whether the world will need ∼37 TW or ∼180 TW of solar will likely depend on successful implementation of electrification and direct delivery of energy to the end application, reducing the need for storage and optimizing overall system design. The PV industry could supply any of these levels by 2050 if historical growth rates can continue, but will require massive capital investment and addressing materials shortages, especially if the need for storage increases the total energy needed. As the situation comes into sharper focus 15 years later, we see that the magnitude of the challenge depends strongly on our choices for electrification and storage.
This work was authored in part by the National Renewable Energy Laboratory, operated by Alliance for Sustainable Energy, LLC, for the US Department of Energy (DOE) under Contract No. DE-AC36-08GO28308. The views expressed in the article do not necessarily represent the views of the DOE or the US Government. The US Government retains and the publisher, by accepting the article for publication, acknowledges that the US Government retains a nonexclusive, paid-up, irrevocable, worldwide license to publish or reproduce the published form of this work, or allow others to do so, for US Government purposes.