


Introduction
The mineral beraunite was discovered by Breithaupt (Reference Breithaupt1840, Reference Breithaupt1841) on specimens that originated from the Hrbek iron ore mine at Svatá Dobrotivá (Sankt Benigna) in Central Bohemia, nowadays the Czech Republic. In the decades following, similar hydrated basic iron phosphates were classified as either red beraunite or green dufrénite (‘kraurite’). The development of structural analysis by X-ray diffraction since the beginning of the 20th Century resulted in a significant advance in mineralogy. Systematic study of basic phosphates has shown that some green acicular phases considered as dufrénite have an X-ray pattern identical to the mineral beraunite. Chemical analyses of this green beraunite have proven the presence of significant amounts of divalent iron, which has not been reported previously (Frondel, Reference Frondel1949; Moore, Reference Moore1970). Both mixed-valence and trivalent beraunites were considered to be varieties of the same mineral species. On the basis of the refinement of the crystal structure, Moore and Kampf (Reference Moore and Kampf1992) proposed a trivial name (i.e. ‘beraunite’) for the ‘reduced’ (green), and the same name with the prefix ‘oxy-’ (i.e. ‘oxyberaunite’) for ‘oxidised’ (red/orange) end-members. These observations were followed up by Chukanov et al. (Reference Chukanov, Aksenov, Rastsvetaeva, Schäfer, Pekov, Belakovskiy, Scholz, de Oliveira and Britvin2017), who introduced the name ‘eleonorite’ for the Fe3+ dominant phase and suggested using the name beraunite for the mixed-valence iron end-member.
A recent investigation of the original ‘beraunite’ material stored in collections of the Freiberg University of Mining and Technology, Germany, proved the identity of this mineral with ‘eleonorite’. The name ‘eleonorite’ has been discredited and the formula of beraunite as Fe3+6(PO4)4O(OH)4⋅6H2O was approved by proposal IMA 21-D (Miyawaki et al., Reference Miyawaki, Hatert, Pasero and Mills2021) of the Commission on New Minerals, Nomenclature and Classification of the International Mineralogical Association (IMA–CNMNC). To avoid duplicity of the mineral name ‘beraunite’, the end-member with mixed iron valence has been redefined and renamed. From several studied specimens of green-coloured ‘beraunites’ (e.g. Blaton, Belgium; Svappavaara, Sweden; Hagendorf-Süd, Germany; Krásno and Morašice, Czech Republic), a sample originating from the Gravel Hill mine, Perranzabuloe, Cornwall, England, was chosen to define ferroberaunite. The reasons are excellent single-crystal X-ray data and the relative chemical purity, i.e. the absence of common isomorphic elements such as Al, Zn and Mn.
The mineral is named ferroberaunite after its composition, i.e. the presence of divalent iron in the M1 site of the beraunite structure. The name is consistent with the name of the related mineral zincoberaunite, ZnFe3+5(PO4)4(OH)5⋅6H2O (Chukanov et al., Reference Chukanov, Pekov, Grey, Price, Britvin, Krzhizhanovskaya, Kampf, Dünkel, Keck, Belakovskiy and MacRae2016). The name ferroberaunite was previously used by Golley and Williams (Reference Golley and Williams1995) as a beraunite variety name referring to minerals from the Gravel Hill mine. The mineral symbol based on Warr (Reference Warr2021) is Fbru. The mineral, mineral name and mineral symbol were approved by the IMA–CNMNC prior to publication (|IMA2021-036, Tvrdý et al., Reference Tvrdý, Plášil, Sejkora, Škoda, Vrtiška, Dolníček, Petr and Veselovský2021). The holotype specimen is housed in the mineralogical collection of the Department of Mineralogy and Petrology of the National Museum, Prague, Czech Republic, catalogue number P1P 11/2021.
Occurrence
The ferroberaunite specimen was collected around 2016 in the abandoned Gravel Hill mine, Perranzabuloe, Cornwall, England (50°22’27.0”N, 5°08’42.0”W). The mining at the Gravel Hill mine (formerly known as Penhale Iron mine, or Cliff Iron mine) culminated in the 18–19th Centuries. The mine was located on the western end of the Perran Iron Lode, represented here by two layers of oxide iron ore deposited in sedimentary rocks of the Middle Devonian age. The layers are 5 and 13 m thick and are separated by a 14 m thick barren horizon. The ores were formed by oxidation of primary siderite, which is probably of a low-temperature sedimentary- or volcanic-exhalative origin (Scrivener et al., Reference Scrivener, Grant, Hollick and Smith2006). The total production of the mine is estimated at more than 35,000 tons of iron ore (Cantrill et al., Reference Cantrill, Sherlock and Dewey1919; Dines, Reference Dines1956).
Ferroberaunite crystallised under supergene conditions in fissures and cavities of ‘limonite’ iron ore. Cavities are up to 8 cm × 4 cm × 1 cm in size and are often coated with manganese oxides. The occurrence has been known since 1986 and is reported to have been the first discovery of beraunite/ferroberaunite and strunzite/ferrostrunzite in Great Britain (Weiss, Reference Weiss1989, Reference Weiss2019). Other phosphate minerals reported to occur at the Gravel Hill mine include corkite, diadochite, fluorapatite, phosphosiderite, rockbridgeite, strengite and whitmoreite (Golley and Williams, Reference Golley and Williams1995).
Appearance, physical properties and optical data
The holotype specimen of ferroberaunite is a 4 cm × 4 cm × 3 cm fragment of fine-grained limonitised quartz of ochre-brown colour. No associated phosphates are present.
On the holotype specimen, ferroberaunite occurs in long prismatic, acicular to lath-like crystals up to 400 μm long, growing irregularly on matrix or forming radial to spherical aggregates; parallel intergrowths are common (Figs 1, 2). The crystals are flattened on {100} and elongated along the b axis, with wedge-shaped terminations. The crystal forms assigned to the orientation given by Marzoni Fecia di Cossato et al. (Reference Marzoni Fecia di Cossato, Orlandi and Pasero1989) for manganese-rich beraunite from Mangualde, Portugal, comparing with our observation of morphology and powder X-ray diffraction data are {100}, {201}, {20$\bar{1}$ }, {112} and {$\bar{1}$
 1$\bar{2}$
 } (Fig. 3); twinning is on {100} (from morphology).

Fig. 1. Ferroberaunite in olive-green acicular crystals on ‘limonite’ matrix; holotype specimen (catalogue number P1P 11/2021). FOV 2 mm across. Photo by L. Vrtiška.
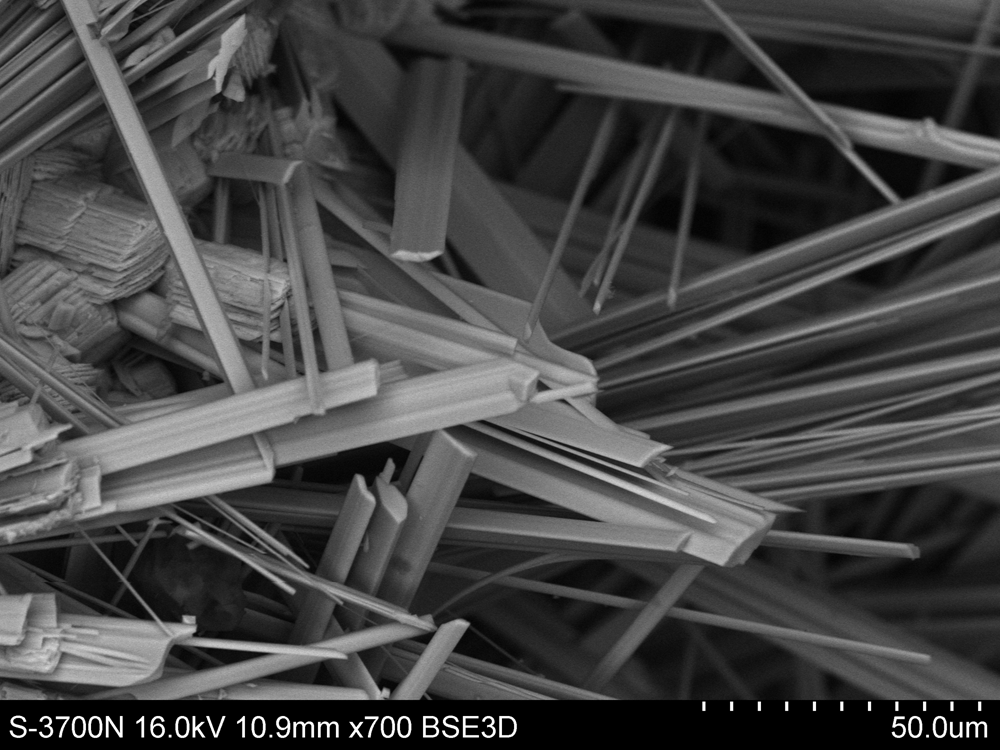
Fig. 2. Scanning electron microscopy image of the holotype ferroberaunite specimen. Thin needles and packets of multiple twins also occur among the predominant lath-like crystals. Graphic scale. Photo by L. Vrtiška.

Fig. 3. Drawing of flattened (top) and columnar (bottom) ferroberaunite crystals.
The mineral is dark green to olive green, transparent to translucent, with a pale olive-green streak; the mineral is non-fluorescent. It has a vitreous lustre, pearly on cleavages. The cleavage is very good parallel to {100}. The crystals are brittle with uneven fracture; the Mohs hardness is assumed to be 3–4. The density 2.94(2) g⋅cm–3 was determined by the flotation method using the Mohr-Westphal scale and two different mixtures of liquids (diiodomethane and acetone; 1,1,2,2-tetrabromoethane and dioxane). The calculated density based on the empirical formula and unit-cell parameters from single-crystal diffraction is 2.907 g⋅cm–3. Ferroberaunite dissolves easily in HCl (35%), slowly in H3PO4 (85%); it does not dissolve in HNO3 (65%; room temperature; 24 hours observation).
The optical properties of ferroberaunite were measured at a wavelength of 589 nm using a microrefractometer spindle-stage (Department of Geological Sciences, Masaryk University in Brno). The extinction is parallel to the elongation. The mineral is biaxial (–), α = 1.736(2), β = 1.765(3), γ = 1.786(5), 2Vmeas. = 68(3)° and 2Vcalc. = 79°. Dispersion of optical axes is strong, r > v. The orientation is Y = b; X ≈ a, Z ≈ c. Pleochroism is strong, X = bluish green >> Z = green > Y = yellow. The Gladstone–Dale compatibility using revised constants in table 7 of Mandarino (Reference Mandarino1981) is excellent; 0.038 for empirical formula and measured density, and 0.027 for empirical formula and density calculated from the single-crystal cell.
Chemical composition
The composition of ferroberaunite was determined on polished and carbon-coated fragments mounted in an epoxy cylinder using a Cameca SX 100 electron microprobe (Department of Mineralogy and Petrology, National Museum Prague). The instrument was operated in wavelength-dispersive mode at an accelerating voltage of 15 kV, beam current of 5 nA, with a beam diameter of 7 μm. The following X-ray lines and standards were selected; Kα lines: P, Ca (apatite), Al (Al2O3), Mn (rhodonite) and Fe (hematite). Contents of Na, Mg, Si, K, S, Cl, Ti, Co, V, Cu, F, Cr, N, As, Mo, Sn, Ba, Y, W, Bi, U, Pb and Th were below detection limits (~0.05–0.10 wt.%). Counting times were 10–20 s on peak and half of this time for each background position. The raw intensities were converted to the concentrations automatically using the PAP (Pouchou and Pichoir, Reference Pouchou, Pichoir and Armstrong1985) matrix-correction procedure.
Analytical data for ferroberaunite are given in Table 1. In addition to iron, the holotype specimen contains minor amounts of Al (0.04 atoms per formula unit), Mn (0.02 apfu) and Ca (0.01 apfu). The empirical formula of ferroberaunite calculated on the basis of P = 4 apfu is: (Fe2+0.75Ca0.01Mn0.02Fe3+0.22)Σ1.00(Fe3+4.88Al0.04)Σ4.92(PO4)4O0.11(OH)4.76⋅6H2O. The ideal formula is Fe2+Fe3+5(PO4)4(OH)5⋅6H2O, which requires FeO 7.91, Fe2O3 43.97, P2O5 31.26, H2O 16.86, total 100 wt.%.
Table 1. Chemical data (in wt %) for ferroberaunite (N = 6).

* FeO calculated based on an assumption of 0.75 apfu Fe2+ in the M1 position.
** H2O could not be analysed directly because of the minute amount of material available, and was calculated on the basis of 6 H2O, from the ideal composition of beraunite-related minerals and on the basis of neutral charge balance (OH).
S.D. – standard deviation.
Raman spectroscopy
The Raman spectrum of ferroberaunite (Fig. 4) was collected in the range 3600–50 cm–1 using a DXR dispersive Raman Spectrometer (Thermo Scientific) mounted on a confocal Olympus microscope. The Raman signal was excited by an unpolarised 633 nm He–Ne gas laser and detected by a CCD detector (size 1650 × 200 pixels, Peltier cooled to –60°C, quantum efficiency 50% and dynamic range 360–1100 nm). The experimental parameters were: 100× objective, 10 s exposure time, 1800 exposures, 50 μm pinhole spectrograph aperture and 3 mW laser power level (estimated resolution 6.4–13.3 cm–1, estimated spot size 0.8 μm). The spectra were acquired repeatedly from different grains in order to obtain a representative spectrum with the best signal-to-noise ratio. The possible thermal damage of the measured point was excluded by visual inspection of the exposed surface after measurement, observing possible decay of spectral features at the start of excitation, and checking for thermal downshift of Raman lines. The instrument was set up by a software-controlled calibration procedure using multiple neon emission lines (wavelength calibration), multiple polystyrene Raman bands (laser-frequency calibration) and standardised white-light sources (intensity calibration). Spectral manipulations were performed using the Omnic 9 software (Thermo Scientific).

Fig. 4. Raman spectrum of ferroberaunite (split at 2000 cm–1).
The Raman spectrum shows bands induced by vibrations of OH units and water molecules, as well as (PO4)3– tetrahedral and Fe–O octahedral units, similar to other hydrated hydroxyphosphates (e.g. Frost et al., Reference Frost, López, Scholz, Xi and Lana2014, Reference Frost, Scholz and López2016). The high-energy region over 1300 cm–1 is characterised by vibrations of OH ions and hydrogen-bonded water molecules. There occur two significant bands assigned to the ν O–H stretching (3561 cm–1) and to the H–O–H ν2 (δ) bending of water molecules (the broad peak at 1613 cm–1). The next group of bands is connected with stretching vibrations of (PO4)3– units, namely to the ν3 antisymmetric (maxima at 1137 and 1051 cm–1) and ν1 symmetric (1014 cm–1) modes. The Raman bands at 681, 624 and 574 cm–1 could be attributed to ν4 (δ) (PO4)3– out-of-plane bending vibrations. Bands of the ν2 (δ) in-plane bending vibrations of the same unit appear at lower wavelengths (470 and 434 cm–1). Further bands could be attributed to vibrations of Fe-centred octahedra in the crystal structure of ferroberaunite. Bands of Fe–O stretching (most likely at 399–294 cm–1) and O–Fe–O symmetric bending (most likely at 232 and 201 cm–1) overlap with the manifestations of external and lattice vibrations, which continue until the end of the spectrum with the maxima at 232, 201, 128 and 87 cm–1.
X-ray photoelectron spectroscopy
Relative proportions of divalent and trivalent iron were estimated by the X-ray photoelectron spectroscopy (XPS) measurements carried out with the PHI 5000 VersaProbe II XPS system (Physical Electronics; Regional Centre of Advanced Technologies and Materials, Palacký University Olomouc) using a monochromatic AlKα source (15 kV and 50 W) and photon energy of 1486.7 eV. All the spectra were measured in a vacuum of 1.1×10⁻⁷ Pa and at a temperature of 21°C. The analysed area on the sample was a spot 100 μm in diameter. The survey spectra were measured with a pass energy of 187.850 eV and electronvolt step of 0.8 eV, whereas the high-resolution spectra were measured with a pass energy of 23.500 eV and electronvolt step of 0.2 eV. Dual-beam charge compensation was used for all measurements. All binding energy values were referenced to the carbon peak C1s at 284.80 eV. Data were analysed with MultiPak (Ulvac-PHI, Inc.) software version 9.9.0.8 using Gaussian–Lorentzian function with iterated Shirley routine background subtraction (Shirley, Reference Shirley1972).
Generally, p orbitals exhibit spin-orbit splitting in XPS. The spin-orbit splitting is projected as a doublet in the XPS spectrum (Briggs, Reference Briggs, Briggs and Grant2003). In the Fe 2p region, there is significant splitting of the Fe 2p3/2 and Fe 2p1/2 components (~13 eV) with the ratio 2:1, respectively. Another spectral features in this region are shake-up lines caused by a finite probability that the ion will be left in an excited state a few electronvolts above the ground state. This leads to the formation of satellite peaks (Moulder et al., Reference Moulder, Stickle, Sobol and Bomben1995). As the fitting procedure of the Fe 2p region is very complex, the simplifying practice used for the natural mineral phases by Kloprogge and Wood (Reference Kloprogge and Wood2020) was chosen.
To estimate the valence states of iron, an empirical approach comparing Fe 2p3/2 spectra with standards was used, which avoids having to describe the peak shapes analytically (e.g. Rhodes, Reference Rhodes2021). Holotype ferroberaunite was compared with the spectra of beraunite, vivianite and childrenite (Table 2). High-resolution spectra for the 707–717 eV binding energy section decomposed to three main peaks for Fe 2p3/2 are shown in Fig. 5. Although the determination of the iron oxidation state is complicated, the ratio Fe2+ : (Fe2++Fe3+) can be estimated from the relative area of the peak Fe 2p3/2(1) and the corresponding regression curve. The observed value of ~12% Fe2+ corresponds to 0.72 apfu in the ferroberaunite formula.

Fig. 5. Comparison of high resolution Fe 2p3/2 XPS spectrum of ferroberaunite with patterns of ferric (beraunite/‘eleonorite’) and ferrous phosphates (vivianite and childrenite). The spectra are vertically shifted. The numbering of peaks corresponds to Table 2; the peaks Fe2p3/2(1) used to estimate a relative content of Fe2+ are highlighted.
Table 2. Estimation of a relative content of Fe2+ based on the area of the peak Fe 2p3/2(1).

* Holotype specimen; ** neotype specimen (sample NM; Vrtiška et al., Reference Vrtiška, Tvrdý, Plášil, Sejkora, Škoda, Chukanov, Massanek, Filip, Dolníček and Veselovský2022); *** probably partly oxidised.
X-ray diffraction data and crystal structure
Powder X-ray diffraction data for ferroberaunite were recorded at room temperature using a Bruker D8 Advance diffractometer equipped with solid-state LynxEye detector and secondary monochromator producing CuKα radiation (Department of Mineralogy and Petrology, National Museum, Prague). The instrument was operating at 40 kV and 40 mA. In order to minimise the background, the powder samples were placed (without any liquid) on the surface of a flat silicon wafer. The powder pattern was collected in the Bragg–Brentano geometry in the range 3–70°2θ, step 0.01° and counting time of 20 s per step (total duration of the experiment ≈ 30 hours). The positions and intensities of diffractions were found and refined using the Pearson VII profile-shape function of the ZDS program package (Ondruš, Reference Ondruš1993). Powder diffraction data are given in Table 3; the unit-cell parameters were refined by the least-squares algorithm implemented by Burnham (Reference Burnham1962) as: a = 20.833(4) Å, b = 5.1562(13) Å, c = 19.232(7) Å, β = 93.30(4)° and V = 2062.5(9) Å3.
Table 3. Powder diffraction data (d in Å) for ferroberaunite*.

*The strongest peaks are reported in bold.
a = 20.833(4) Å, b = 5.1562(13) Å, c = 19.232(7) Å, β = 93.30(4)° and V = 2062.5(9) Å3.
For the single-crystal diffraction experiment, a long-prismatic crystal was separated under a polarising microscope and mounted on a glass fibre. The diffraction experiment (see Table 4 for details) was performed at room temperature with a Rigaku SuperNova single-crystal diffractometer equipped with the Atlas S2 CCD detector and a microfocus MoKα source (Institute of Physics, CAS, Prague). Data reduction was performed using CrysAlisPro Version 1.171.39.46 (Rigaku, Reference Rigaku2019). The data were corrected for the Lorentz factor and polarisation effects. An absorption correction (empirical scaling using spherical harmonics) was applied in Jana2020 (Petříček et al., Reference Petříček, Dušek and Palatinus2020). A single-crystal X-ray experiment revealed a monoclinic unit cell: a = 20.8708(3), b = 5.1590(8), c = 19.2263(3) Å, β = 93.3186(17)°, V = 2066.7(3) Å3 and Z = 4.
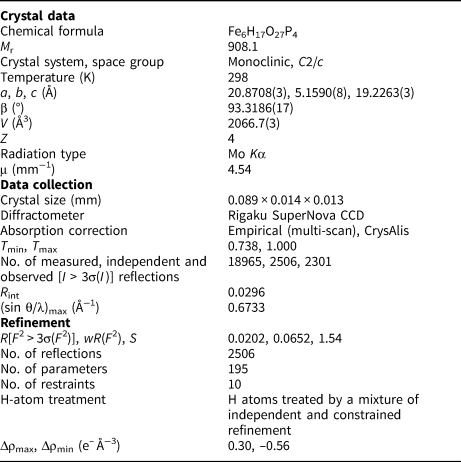
Table 4. Details for the data collection and refinement of the structure of ferroberaunite.
The structure of ferroberaunite was solved from the X-ray data using the intrinsic phasing algorithm of the SHELXT program (Sheldrick, Reference Sheldrick2015) in the monoclinic space-group C2/c. A centrosymmetric space-group was indicated from the reflection statistics (observed, |E 2–1| = 1.006; expected centrosymmetric = 0.968 vs. non-centrosymmetric 0.736). The refinement was performed using the full-matrix least-squares algorithm of the Jana2020 program (Petříček et al., Reference Petříček, Dušek and Palatinus2020). It revealed the same general model as provided for the beraunite-related structures (Fanfani and Zanazzi, Reference Fanfani and Zanazzi1967; Moore and Kampf, Reference Moore and Kampf1992; Chukanov et al., Reference Chukanov, Aksenov, Rastsvetaeva, Schäfer, Pekov, Belakovskiy, Scholz, de Oliveira and Britvin2017; Aksenov et al., Reference Aksenov, Chukanov, Göttlicher, Hochleitner, Zarubina and Rastsvetaeva2018; Tvrdý et al., Reference Tvrdý, Plášil and Škoda2020). The refinement converged smoothly, including H-atom sites located by Fourier syntheses (H atoms refined using soft constrains on the O–H distances and U iso of the H atoms were set at 1.2 times that of the corresponding donor O atom), to the final R = 0.0203 for 2301 unique reflections of I > 3σ(I) with a goodness of fit = 1.35; the highest peak that resides in the electron density was 0.37 e– Å–3, only. The details for the refinement are given in Table 4. Atom coordinates, atomic displacement parameters and site occupancies are given in Table 5, selected interatomic distances in Table 6 and bond-valence analysis in Table 7. The crystallographic information files have been deposited with the Principal Editor of Mineralogical Magazine and are available as Supplementary material (see below).
Table 5. Atom coordinates and displacement parameters (as isotropic or equivalent; in Å2) for the structure of ferroberaunite.
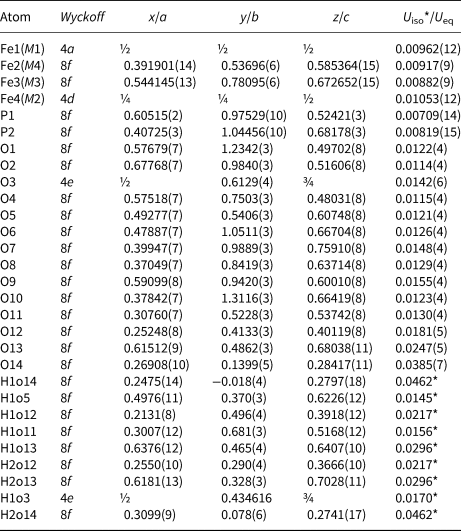
M1–M4 denotes metal cation site labelling, according to Moore and Kampf (Reference Moore and Kampf1992).
Table 6. Selected interatomic distances (in Å) and polyhedral measures for ferroberaunite.

Symmetry codes: (i) –x+1, –y+1, –z+1; (ii) x, y–1, z; (iii) –x+1, –y+2, –z+1; (iv) –x+1, y, –z+3/2; (v) x–½, y–½, z; (vi) –x+½, –y+½, –z+1. ECoN – effective coordination number (Hoppe, Reference Hoppe1979); distortion – octahedral distortion (Brown and Shannon, Reference Brown and Shannon1973).
Table 7. Bond-valence analysis for the structure of ferroberaunite (values in valence units, vu).*

*Bond-valence parameters were taken from Gagné and Hawthorne (Reference Gagné and Hawthorne2015). ΣBV–H = summation of bond valences without considering H bonds; ΣBV+H = summation of bond valences with H bonds considered.
Ferroberaunite possesses some structural elements common to basic phosphates of ferrous and ferric iron (Moore, Reference Moore1969, Reference Moore1970). Distinct fundamental building blocks are trimers of face-shared M1- and M4-octahedra, where the inner [M1O4(OH1)2]-octahedron occupies the 4a-site and the outer [M4O4(OH1)(OH2)]-octahedra occupy 8f-sites, for the C2/c structures (Fig. 6). The trimers are further linked via two isolated [P1O4]-tetrahedra along the b direction. Along the c direction they are connected by corner-sharing with [M3O3(OH)2(H2O)]-octahedra and [P2O4]-tetrahedra, which results in heteropolyhedral layers (Fig. 7). These layers are then linked via M2-octahedra forming a framework containing wide channels running parallel to b and hosting H2O. The seven structural blocks of these octahedra (triplets with corner shared octahedra) are referred to as the h-clusters by Moore (Reference Moore1969, Reference Moore1970).

Fig. 6. Octahedral trimer in ferroberaunite. M1 is occupied by Fe2+ and M4 by Fe3+. P tetrahedrons are purple and H atoms grey.

Fig. 7. Crystal structure of ferroberaunite viewed perpendicular to the crystal elongation. The heteropolyhedral slabs are connected by the M2-octahedra; water molecules located in channels are hydrogen-bonded (dashed lines). P tetrahedrons are purple, O atoms red and H atoms grey. The unit cell edges are outlined in black.
The distinction between beraunite (formerly ‘eleonorite’; IMA 21-D, Miyawaki et al., Reference Miyawaki, Hatert, Pasero and Mills2021) and ferroberaunite is the occupancy of the M1 site. Whereas for beraunite, M1 is populated by trivalent iron cation, ferroberaunite contains divalent iron at M1. This has been proved unambiguously by the results of the bond-valence analysis (Table 7), consistent with a site occupancy of 75% Fe2+ and 25% of Fe3+. The formula of ferroberaunite, reflecting the occupancy of the M1 site as suggested by the bond-valence analysis and which is in line with the results from electron microprobe spectroscopy, is (Fe2+0.75Fe3+0.25)Fe3+5(PO4)4(OH)5(H2O)6; this formula is not electroneutral, having +0.25 charge. The exact mechanism of the charge-balance is probably via OH↔O substitution. In the case of ferroberaunite, its resolution is far beyond the capabilities of the current X-ray data. The ideal, electroneutral formula for ferroberaunite is Fe2+Fe3+5(PO4)4(OH)5(H2O)6, Z = 4 and D calc = 2.919 g⋅cm–3.
Discussion
The crystal structure of minerals of the beraunite–ferroberaunite series has been investigated by several authors. Fanfani and Zanazzi (Reference Fanfani and Zanazzi1967) studied, using the Weissenberg method, a crystal of ‘red’ beraunite from the Eleonore iron mine near Giessen, Germany. For this sample, the authors determined by microchemical analysis (colorimetric test), somewhat surprisingly, a ratio of divalent to trivalent iron of 1 : 5.9 and a formula corresponding to the present-day ferroberaunite. Nevertheless, the refined bond lengths within the Fe-octahedra unambiguously show iron as trivalent (Fe1 = 2.96 valence units (vu), Fe2 = 3.43 vu, Fe3 = 3.15 vu, Fe4 = 2.99 vu; using bond-valence parameters given for Fe3+ by Gagné and Hawthorne, Reference Gagné and Hawthorne2015). Subsequently, Moore (Reference Moore1970) published refined unit-cell data derived from a powder image of ‘green beraunite’ (i.e. ferroberaunite) from the Palermo No. 1 Pegmatite, New Hampshire, USA. In the Mn-rich ‘red’ beraunite from Mangualde, Portugal, Marzoni Fecia di Cossato et al. (Reference Marzoni Fecia di Cossato, Orlandi and Pasero1989) hypothesised the presence of exclusively trivalent iron and the dominance of divalent manganese at the M2 site; these conclusions were discussed subsequently by Moore and Kampf (Reference Moore and Kampf1992) and Aksenov et al. (Reference Aksenov, Chukanov, Göttlicher, Hochleitner, Zarubina and Rastsvetaeva2018). In this site, divalent manganese cannot be present, based on refined bond lengths (Mn2 = 2.97 vu; using bond-valence parameters given for Mn3+ by Gagné and Hawthorne, Reference Gagné and Hawthorne2015), and the rest of the sites assigned to Fe are dominated by trivalent iron (Fe1 = 2.77 vu, ~ 24% Fe2+ and 77% Fe3+; Fe3 = 3.10 vu; and Fe4 = 3.01 vu; using bond-valence parameters given by Gagné and Hawthorne, Reference Gagné and Hawthorne2015). Moore and Kampf (Reference Moore and Kampf1992) analysed the published structural data and compared it with new measurements on ‘green beraunite’ from Mullica Hill, New Jersey, USA. There is little doubt that they analysed what is approved now as ferroberaunite (Fe1 = 2.30 vu, ~70% Fe2+ and 30% Fe3+; Fe2 = 3.40 vu; Fe3 = 3.15 vu; Fe4 = 2.99 vu; using bond-valence parameters given by Gagné and Hawthorne, Reference Gagné and Hawthorne2015).
Further structural data are later reported by Chukanov et al. (Reference Chukanov, Aksenov, Rastsvetaeva, Schäfer, Pekov, Belakovskiy, Scholz, de Oliveira and Britvin2017) for beraunite (‘eleonorite’) and by Aksenov et al. (Reference Aksenov, Chukanov, Göttlicher, Hochleitner, Zarubina and Rastsvetaeva2018) for Mn-rich beraunite (‘eleonorite’). In the case of the sample studied by Aksenov et al. (Reference Aksenov, Chukanov, Göttlicher, Hochleitner, Zarubina and Rastsvetaeva2018), the authors concluded that all octahedral sites are occupied dominantly by trivalent iron, Mn2+ is present in an amount of only 0.28 apfu in M1 and its excess (~0.3 apfu) is disordered between M2–M4 sites with different Fe3+: Mn2+ ratios.
‘Eleonorite’, re-established by Chukanov et al. (Reference Chukanov, Aksenov, Rastsvetaeva, Schäfer, Pekov, Belakovskiy, Scholz, de Oliveira and Britvin2017), is a mineral with the Fe3+ dominating over all the octahedral metal sites in the structure. The structure model of Chukanov et al. (Reference Chukanov, Aksenov, Rastsvetaeva, Schäfer, Pekov, Belakovskiy, Scholz, de Oliveira and Britvin2017) corresponds to an average structure of the centrosymmetric monoclinic space group C2/m. This model comprises a partially occupied OH1 site (50% O and 50% OH). This means there must also be an H site with 50% occupancy. The OH1 site is related to the M1-octahedron, which hosts Fe3+ in the case of beraunite (‘eleonorite’ of Chukanov et al., Reference Chukanov, Aksenov, Rastsvetaeva, Schäfer, Pekov, Belakovskiy, Scholz, de Oliveira and Britvin2017). The structure model for beraunite proposed by Vrtiška et al. (Reference Vrtiška, Tvrdý, Plášil, Sejkora, Škoda, Chukanov, Massanek, Filip, Dolníček and Veselovský2022) adopts a non-centrosymmetric monoclinic space group Cc, with the fully occupied H site linked to the O5_2 site of the M1-octahedron, equivalent to the O5(1–x, 1–y, 1–z) site in ferroberaunite (Fig. 6). Such a model provides a non-averaged structure with one of the vertices of the M1-octahedron deprotonated, resulting in the formula Fe3+6(PO4)4O(OH)4⋅6H2O. In contrast to the centrosymmetric structure of ferroberaunite, Fe2+Fe3+5(PO4)4O(OH)5⋅6H2O, two of the M1-octahedral vertices (represented by the symmetrically related O5 atoms) are linked to H atoms of the OH groups.
Conclusions
The redefinition of beraunite and the approval of the new mineral name ferroberaunite should correctly clarify the status of these structurally and chemically close, but distinct, mineral phases. Ferroberaunite is a Fe2+ analogue of zincoberaunite (Zn dominant in the M1 site) and beraunite (Fe3+ dominant in the M1 site), and isostructural with the hydrated iron-aluminium basic phosphate tvrdýite (Table 8). The identification of these minerals is possible only by both chemical and structural analyses. For Fe2+/Fe3+ dominant phases, the rule ‘dark green ferroberaunite’ and ‘red-brown beraunite’ generally applies.
Table 8. Comparative data for ferroberaunite and related minerals; unit-cell parameters on the basis of single-crystal data.

Supplementary material
To view supplementary material for this article, please visit https://doi.org/10.1180/mgm.2022.15
Acknowledgements
We thank Stuart Mills and editorial board members for handling of the manuscript. The paper benefited from constructive comments of Anthony Kampf, Oleg Siidra and Martin Števko. The work was supported financially by the Ministry of Culture of the Czech Republic (long-term project DKRVO 2019-2023/1.II.d National Museum, 00023272), the Grant Agency of the Masaryk University Brno, Czech Republic (Project MUNI/A/1387/2018), the Czech Ministry of Education, Youth and Sports (Project No. SOLID21 CZ.02.1.01/0.0/0.0/16_019/0000760, Institute of Physics ASCR), and Strategic Research Plan of the Czech Geological Survey (DKRVO 2018-2022).


 Open access