


Introduction
Living cells are by nature transparent. Microscopy techniques overcome this problem by transforming the optical properties of the sample into an observable contrast (phase contrast, differential interference contrast [DIC]) or by using fluorescent dyes. The latter technique, however, presents major limitations such as phototoxicity and the interference of markers with the biological processes they target, while the less perturbing classic label-free techniques, such as DIC, provide images of poor contrast and resolution.
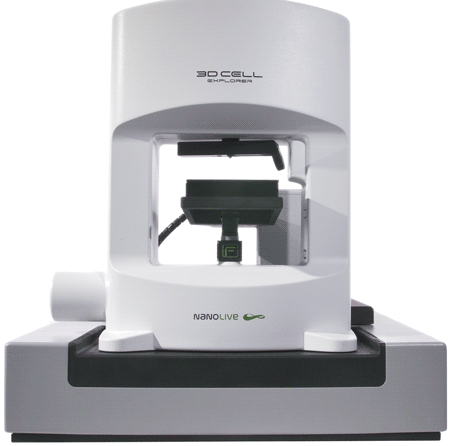
In this context, holotomographic microscopy (HTM) [Reference Choi1] is of great interest since it generates rich and detailed label-free images while using a very low-power light source, hence inducing no detectable phototoxicity [Reference Sandoz2]. At its core, the device is based on quantitative phase microscopy [Reference Cuche3]. A laser diode generates a partially coherent light beam (520 nm), which is split in two to create a Mach–Zehnder interferometer setup [Reference Zetie4]. One of the beams, the “object beam,” interacts with the sample before being collected by a 60× objective, while the second beam remains unperturbed and serves as a reference. The interference of the two beams (object and reference) creates a hologram that is recorded on a complementary metal oxide semiconductor (CMOS) camera. The CX-A HTM presented here (Figure 1) uses this holographic approach and combines it with rotational scanning [Reference Choi1] (Figure 1a). The collection of quantitative phase information is synthesized [Reference Bao5–Reference Cotte7] in order to reconstruct a full 3D refractive index (RI) tomogram. Stability of the HTM performance is ensured by continuous optimal calibration monitoring during an acquisition experiment, which makes it possible to accommodate sample changes such as evaporation of the mounting medium.

Figure 1: Design of the CX-A. (a) The CX-A holotomographic optical setup allows for hologram recording at 360° around the sample using a 45° incident laser. This setup is combined with epifluorescence. (b) and (c) The CX-A consists of a 3D Cell Explorer-fluo microscope unit mounted on an automated stage platform.
Thanks to its rotating illumination (Figure 1a), the CX-A allows unique characterizations of a cell population and its cellular and organelle details through their RI distribution in space and time with unmatched resolution and contrast. Bringing such HTM performance to an automated setup required two challenges to be overcome. The first challenge was to automate the HTM acquisition process while maintaining perfect device calibration and imaging focus, to ensure HTM was compatible with microscopic screening or grid scanning for the acquisition of large fields of view. The second challenge was to create an automated image-analysis platform able to segment and quantify every single cell present in label-free images without tedious setup processes.
Therefore, the CX-A combines a holotomographic microscope and an epifluorescence system mounted on an automated stage (Figures 1b and 1c). The synchronization of the various parts is ensured by the CX-A software, EVE. This software allows the setup of acquisition protocols and offers users the ability to visualize their data. Moreover, it contains a new quantification platform called EVE Analytics (EA), which allows for the segmentation and quantitative analysis of cells acquired with HTM. EA uses artificial intelligence (AI)-aided signal preparation and advanced object detection techniques to create a seamless image-analysis experience with almost no setup time. The CX-A is, therefore, a new tool of choice for biologists interested in drug research, systems biology, or fundamental cell biology, to mention a few areas of research. We will describe here the key features of the CX-A, in the context of example applications, from compound screening to cell population growth and death.
Methods
Cell culture
3T3-derived pre-adipocytes were cultured in DMEM complemented with 10% FBS, 1% Pen/Strep, 1% L-glutamine, and 1% nonessential amino acids. Fifty thousand cells were seeded for 24 h on glass bottom FluoroDishes of 25 mm and 0.17 mm thickness (World Precision Instruments Inc., Sarasota, FL).
Imaging
At its core, the imaging solution is based on quantitative phase microscopy [Reference Bon8]. A laser diode generates a partially coherent light beam (wavelength of λ = 520 nm: Class 1 low-power laser, sample exposure 0.2 mW/mm2) used to illuminate the sample before being collected by a 60× air objective (NA = 0.8). The holographic data are recorded on a CMOS camera, and individual quantitative phase information is digitally extracted and then further numerically assembled to form a 3D refractive index (RI) tomogram [Reference Bon8]. HTM, in combination with epifluorescence, was performed on the CX-A (Nanolive, Tolochenaz, Switzerland).
Live cell imaging
Physiological conditions for live cell imaging were maintained with a top-stage incubator (manufactured by TOKAI HIT, Shizuoka-ken, Japan). A constant temperature of 37°C and humidity saturation, as well as 5% CO2, were achieved throughout the image acquisitions.
Image processing
Acquired 3D volumes were all subjected to maximum projections along the z-axis, from -2 μm to +6 μm with respect to the focal plane, in order to obtain the 2D images displayed in Figures 4–6. This processing was provided by the export function of the EVE software. Quantitative cell analyses provided in Figure 6 were made using EA.
Results and Discussion
EVE supports three major functions: i) setting up acquisition protocols, ii) monitoring of data acquisition, and iii) quantitative image analysis. The acquisition process is compatible with single- or multiple-well plates. For each well, it is possible to perform single field of view or grid-scan acquisitions of up to 100 tiles, organized as squares, providing access to large fields of view of up to 1 mm. The user must specify the time-lapse frequency and length of the acquisition. Thanks to the absence of phototoxicity [Reference Sandoz2] and to state-of-the-art environment control, the length of the time-lapse experiment is limited only by biological factors such as cell crowding, as the device can maintain cells in tissue culture incubator conditions. At the end of the acquisition, the user can proceed with image analysis, and image data can be exported in a variety of formats.
Focus stability is essential when imaging multiple positions, such as screening experiments in a multi-well setup. An autofocus method was created to fit the specific optical constraints of HTM. The strategy relies on the identification of the plane along the z-axis that contains the sharpest content based on the digital processing of hologram acquisitions (Figure 2a). If this position is different compared to the current z position, the stage is adjusted accordingly (Figure 2b).

Figure 2: The CX-A maintains perfect focus with a proprietary autofocus strategy. a. Autofocus setup sequence. b. The autofocus strategy is to seek the sharpest signal by digital hologram processing and to adjust the stage position accordingly.
Figure 3 shows the HTM imaging of specific drug effects applied at various concentrations (Figure 3a), which allows for a new type of screening approach, where complex phenotypic variations can be detected with high resolution and contrast (Figures 3a and 3b). These features are unique but qualitative, and, so, to fully unleash the potential of HTM, quantitative image analysis is essential.

Figure 3: Multi-well experiment with the CX-A. (a) Multi-well, time-lapse acquisition allows for drug screening (b) without sacrificing image quality, which gives simultaneous access to (c) a wealth of subcellular details.
The strength of HTM is the ability to catch multiple biological structures [Reference Sandoz2] at once (Figure 3c). This strength, however, becomes a weakness when it comes to segmenting cells. Ease of segmentation and quality of images are exclusive, as it is easier to segment a blob with no internal signal variations than a very complex cellular object displaying a structured, heterogeneous signal [Reference Meijering9]. How can unstained cells with complex texture and a signal that is orders of magnitude more heterogenous than a cellular fluorescent signal be analyzed? EA is the answer.
Segmenting cells in microscopic images relies on one simple concept: observable cells must display a signal that is higher than background. Creating such contrast has always been the challenge of microscopy, and current cell detection strategies have often been developed based on fluorescent nuclear stains such as DAPI [Reference Devices13], Hoechst [Reference Martin14], and others [Reference Wong15]. Fixed cells stained with DAPI are a gold standard for nuclear detection and are broadly used in endpoint investigations, especially in high-throughput screens, for the detection of millions of single-cell objects [Reference Frechin10]. The reason is simple: with these easy-to-use and bright dyes, a simple intensity thresholding allows differentiation of true signal from background, leading to quick and reliable identification of unique nuclei as distinct objects [Reference Meijering9].
However, the use of DAPI requires sample fixation and is incompatible with live cell imaging [Reference Kapuscinski11], and using other nuclear dyes that are more tolerated by living cells is also problematic [Reference Bucevičius12–Reference Martin14]. Nuclear probes often interfere with DNA, which perturbs fundamental processes like replication and transcription [Reference Wong15] of the genetic material. Moreover, while being excited, nuclear compounds generate a massive phototoxic stress [Reference Singh16] where it hurts the most: in the genome [Reference Evanko17–Reference Wäldchen19].
Most of today's image-based investigations require the segmentation of thousands of entire cells [Reference Singh16,Reference Boutros20]. Chemical compounds like CellTrace VioletTM, cholera toxin B, or other similar “cell outliners” [Reference Specht21] can provide a cytosolic fluorescent stain that provides a signal with enough intensity to be differentiated from the background. However, due to the heterogeneous nature of the material they stain (the cell's dry mass), their signal may show spatial and temporal variations making simple thresholding a challenge. In addition, the complex curvature of cell edges makes it difficult to distinguish the boundaries of touching cells, resulting in under-segmentation problems such as two or more cells being recognized as one, which presents a more complex problem, similar to the challenge posed by touching nuclei [Reference Winter22].
This explains why, in the case of entire cells, an object segmentation strategy, like the one applied for a simple signal generated by a stained nucleus, fails. The solution for segmenting an entire fluorescent cell is to use primary nuclei detection to anchor (or seed) a secondary step for the detection of a cell [Reference Meijering9]. Such a secondary step relies on the propagation of the segmentation of the primary object until the propagated object touches another propagated object, or until a local drop in signal signifies the limit of the object [Reference Jones23]. When coupled to local thresholding methods, this approach can segment very fine details, making propagation strategies the current gold standard for full cell detection [Reference Jones23].
However, segmentation finesse comes at a cost. Firstly, it requires more work from the user when using cell segmentation software [Reference Carpenter24]. Secondly, and more importantly, staining cells generates major perturbations of the living sample [Reference Minamikawa25] and increases the risk of chemically perturbing the observed processes while generating both primary and secondary phototoxicity [Reference Evanko17,18].
To circumvent these problems, we have developed a new segmentation technique that relies solely on the RI signal of cells, using proprietary AI for signal preparation together with advanced thresholding methods. EA can detect the fine details of cellular objects that display complex subcellular details without using stains.
3T3-derived pre-adipocytes were imaged for 2 hours at a frequency of 1 image every 4 minutes using HTM and epifluorescence simultaneously. Figure 4 shows the first timepoint of this time-lapse experiment. HTM allows the acquisition of an image of the cell's RI distribution in 3D. We subsequently projected it along the z-axis, and this image was segmented using the EA segmentation tool (Figure 4a). EA segmentation captures very fine details of the cellular boundaries, as shown in the Figure 4a insets, and is especially good at capturing live membrane protrusions such as filopodia, lamellipodia, and dendrites.
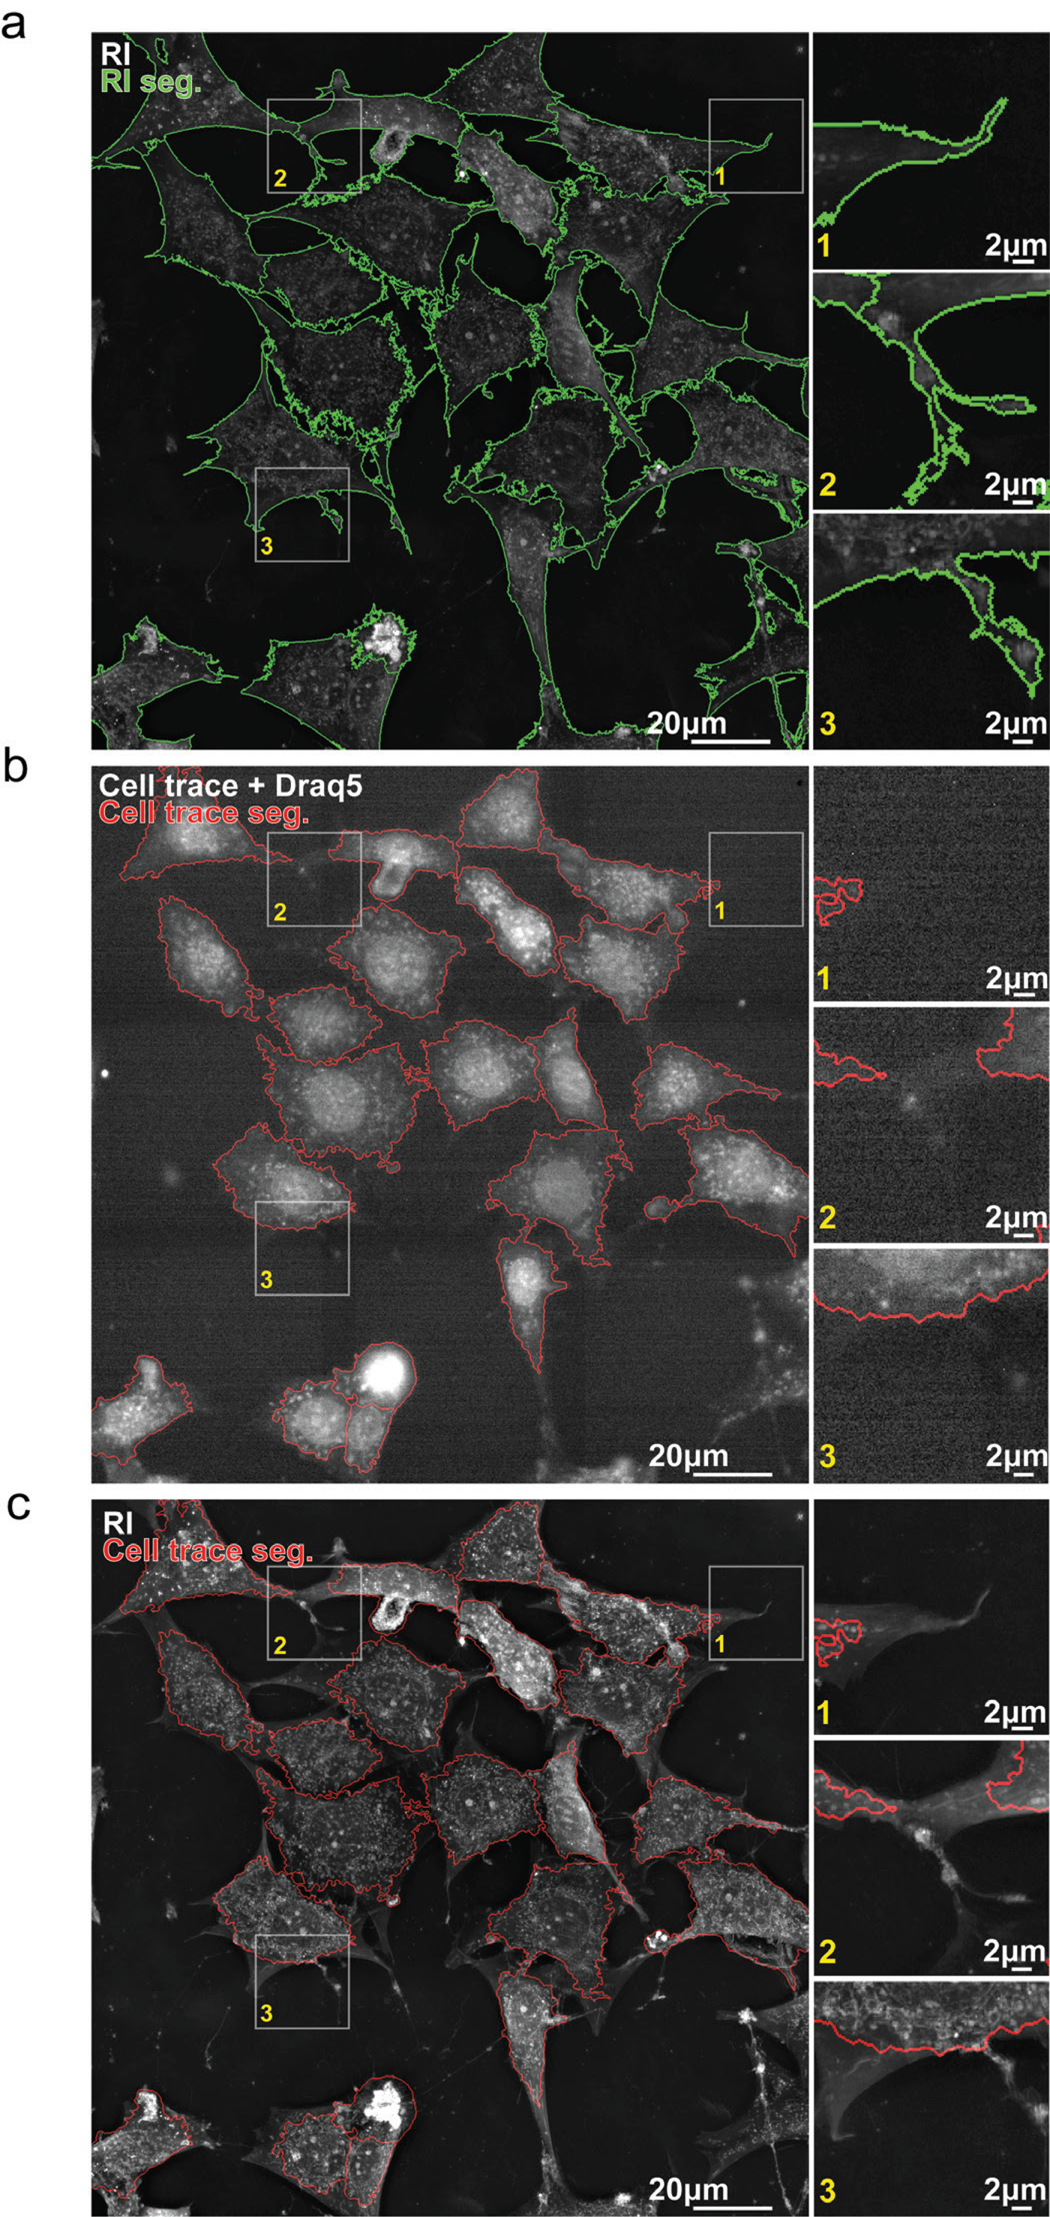
Figure 4: Segmentation of live cells using refractive index or low fluorescence signal. (a) Segmentation outlines (green) of 3T3-derived pre-adipocytes (preA) overlaid on the refractive index (RI) signal. Cell segmentations were computed with EVE Analytics (EA) using the RI signal. (b) Segmentation outlines (red) of preA overlaid on the far-red fluorescent signal emitted by Draq5 and CellTrace VioletTM after low-power excitation (laser intensity: 10%, exposure time: 200 ms) (low D+C). Cell segmentations were computed with CellProfiler4 (CP4) using low D+C signal. (c) Segmentation outlines of (b) overlayed on RI signal show that large parts of cells are missed using the low D+C signal for live cell segmentation.
The cells were also stained using Draq5 and CellTrace VioletTM. Draq5 is a modified anthraquinone that easily permeates the cell and interacts with double-stranded DNA through weak stacking and hydrogen bonding [Reference Gholivand26]. Draq5 is a reference for live fluorescent imaging of cell nuclei, as it is reportedly less toxic for genetic processes than Hoechst, for example [Reference Bucevičius12,Reference Singh16,Reference Purschke27], and it generates less phototoxicity due to its excitation at long wavelengths. CellTrace VioletTM is an improved carboxyfluorescein succinimidyl ester (CFSE)-based dye that diffuses into cells to be processed by esterases. This modification allows the fluorescent compound to covalently bind to intracellular amines, providing a stable, non-specific fluorescent staining of whole cells. CellTrace VioletTM is less toxic for staining live cells thanks to a low impact on cell proliferation [Reference Tempany28] and its relative low phototoxicity.
Draq5 and CellTrace VioletTM were used at respective concentrations of 1:4000 and 1:1000 for 15 minutes. Cells were then washed 30 minutes prior to image acquisition. This alliance of cell dyes, used at a low concentration and emitting in the same fluorescent channel, proved to be the only solution for the cells to be able to sustain the epifluorescence acquisition regime described above (2 hours; 1 image per 4 minutes), with a laser excitation set at 10% and 200 ms of exposure. Altogether, this fluorescent staining protocol and acquisition regime is called “low D+C.”
An increase in dye concentration, staining time, laser power, exposure time, or acquisition frequency resulted in cell death before the completion of 2 hours of acquisition. Exchanging either Draq5 for Hoechst or similar blue nuclear dyes, or CellTrace VioletTM for another CFSE dye, led to premature cell death. This is explained both by the higher cellular toxicity of the alternative compounds and the greater generation of phototoxicity using blue dyes, which require UV excitation. We voluntarily did not use any chemical mitigation strategy for dealing with phototoxicity. The use of antioxidants such as vitamin C, vitamin E phosphate, Trolox, or glutathione are far from neutral and perturb cells [Reference Clément29–Reference Giordano32].
We developed the best CellProfiler 4 (CP4) [Reference Carpenter24] pipeline we could in order to segment the same cells as those segmented with EA, using the low D+C fluorescent signal (Figure 4b). Thanks to the alliance of Draq5 and CellTrace VioletTM, well-defined nuclei could be detected and further analyzed within a less intense cytosolic signal (Figure 4b, red outlines). Overlaying the low D+C outlines on the RI signal shows how much detail of the cell's morphology was missed using live fluo-imaging compared to RI-based segmentation. Someone not familiar with live cell imaging could be forgiven for thinking that the fluorescent signal is of poor quality compared to the sharp immuno- or chemical staining one can obtain with fixed samples. We agree, fluorescence imaging works best on fixed cells.
Let's evaluate these new image-analysis capabilities in a concrete scenario. We have seen that the CX-A allows screening of multi-well plates. It also allows acquisition of large fields of view for studying single cells in their population context over very long time-lapse experiments. Again, efficient autofocus is essential to ensure that the same z position, with a precision of less than a micrometer, is kept over distances of up to a millimeter apart in the case of a 10 × 10 gridscan. Figure 5 shows that it is possible to image mammalian cells over multiple days with perfect focus. Coupled with EA we demonstrate in Figure 5 that single cells in such an advanced time-lapse imaging scenario are well-segmented from the beginning to the end of the time-lapse experiment with no loss of objects due to image stitching.

Figure 5: Long time-lapse imaging with the CX-A and robust cell segmentation. (a) Image acquisition stays in focus over days. (b) EVE Analytics precisely segments single cells over a range of cell densities. (c) Insets 1 and 2 show details of cell segmentations using the CX-A and EVE Analytics after 12 and 84 hours of acquisition.
Besides HTM, the CX-A is equipped with an epi-fluorescence system. This allows investigation of the effect of fluorescence imaging on live cell growth dynamics in a quantitative manner using HTM as a reference, since this technology does not generate phototoxic stress. We prepared 3T3-derived pre-adipocytes as follows: 1) grown without any treatment as a control; 2) grown with MitoTracker but without fluorescence excitation; 3) grown with MitoTracker and 200 ms of 1% fluorescence exposure; and 4) grown with MitoTracker and 5% of the maximal excitation provided by the CoolLED fluorescence unit.
The investigation revealed a swift phototoxic effect even at low excitation power (Figure 6a, blue and brown frames). It is worth noting that such CoolLED powers are the standard in the field of mitochondria imaging. The presence of MitoTracker alone within cells is able to arrest cell growth and trigger apoptosis after 10.5 hours of imaging (Figure 6a, green frames) without killing all cells. Altogether the quantified data depict interesting phenomena. While the control cells show an increase in size with spreading and accumulation of dry mass, the addition of MitoTracker stops cell growth and spreading, but dry mass accumulates (Figure 6b). When the MitoTracker fluorophore is excited at 1% power, cells shrink, but the dry mass of cells is stable, indicating that the cell death we observe does not involve massive leakage of material from the cells. However, at 5% power cells shrink much faster and their dry mass decreases quickly, indicating a loss of membrane integrity. Altogether, these dynamics indicate two types of cell death, one more controlled and lengthy, corresponding to typical apoptosis (Figure 6c), while the other is sudden and destructive, corresponding more to necroptosis (Figure 6d) [Reference Galluzzi33].

Figure 6: Quantitative study of the impact of phototoxicity on mammalian cell growth dynamics using label-free holotomographic microscopy. (a) Cell segmentations are displayed in multicolor overlay. Control 3T3-derived pre-adipocytes (yellow frame), treated with MitoTracker in the absence (green frame) or presence of fluorescence excitation (excitation power 1% [blue frame] or 5% [brown frame]) show either perfect growth (yellow frame), or apoptosis after 10h30m (green frame), 7h30m (blue frame), and 2h30m (brown frame) of exposure to a CoolLED light source. (b) Regular plotting of the average and standard deviation of single-cell area, compactness, and dry mass for the control 3T3-derived pre-adipocytes (control, yellow line), or treated with MitoTracker, without fluorescence excitation (MitoTracker only, green line) or with fluorescence excitation (excitation power 1% [blue line] or 5% [brown line]). (c) Refractive index image of a cell undergoing a typical apoptotic cell death found in the condition MitoTracker + excitation power 1%. (d) Refractive index image of a cell undergoing a typical necrotic cell death found in the condition MitoTracker + excitation power 5%.
Conclusion
The CX-A device is the first system to automate HTM microscopy. Moreover, its new software environment allows for unique quantifications using a proprietary label-free cell segmentation environment called EA. EA uses AI-aided signal analysis and advanced object detection techniques to create a simple but powerful quantification pipeline. Thus, users of EA have access to a set of advanced algorithms without a long setup time. Finally, EA is remarkable by its existence in a global context where similar performances would only be provided by heavy deep-learning (DL) approaches. DL techniques come with major limitations: absence of globally applicable models, high demands on training and validation of data, and vast possibilities for setups, which effectively make DL and more generally AI-aided approaches impossible to generalize, keeping them away from widespread use [Reference Meijering34]. With its capacity to capture many biological structures simultaneously with high spatial and temporal resolution and fine contrast, the CX-A opens new possibilities for quantifying fine phenotypes after drug treatment, modeling complex system dynamics, or capturing unknown fundamental cellular behaviors.


