


Introduction
Magnetic skyrmions are whirl-like spin textures, which are foreseen as elementary building blocks in future low-power storage and logic devices (Nagaosa & Tokura, Reference Nagaosa and Tokura2013; Fert et al., Reference Fert, Reyren and Cros2017). Magnetic skyrmions were first observed at low temperature in bulk crystals of B20 compounds (Mühlbauer et al., Reference Mühlbauer, Binz, Jonietz, Pfleiderer, Rosch, Neubauer, Georgii and Böni2009; Yu et al., Reference Yu, Onose, Kanazawa, Park, Han, Matsui, Nagaosa and Tokura2010), as a result of the Dzyaloshinskii–Moriya interaction (DMI) (Dzyaloshinsky, Reference Dzyaloshinsky1958; Moriya, Reference Moriya1960). Subsequently, stacks of thin layers of heavy metals and ferromagnets with the DMI at their interfaces (Bogdanov & Rößler, Reference Bogdanov and Rößler2001) have been shown to host magnetic skyrmions at room temperature (Jiang et al., Reference Jiang, Upadhyaya, Zhang, Yu, Jungfleisch, Fradin, Pearson, Tserkovnyak, Wang, Heinonen, te Velthuis and Hoffmann2015; Boulle et al., Reference Boulle, Vogel, Yang, Pizzini, de Souza Chaves, Locatelli, Mentes, Sala, Buda-Prejbeanu, Klein, Belmeguenai, Roussigné, Stashkevich, Chérif, Aballe, Foerster, Chshiev, Auffret, Miron and Gaudin2016; Moreau-Luchaire et al., Reference Moreau-Luchaire, Moutafis, Reyren, Sampaio, Vaz, Van Horne, Bouzehouane, Garcia, Deranlot, Warnicke, Wohlhüter, George, Weigand, Raabe, Cros and Fert2016; Woo et al., Reference Woo, Litzius, Krüger, Im, Caretta, Richter, Mann, Krone, Reeve, Weigand, Agrawal, Lemesh, Mawass, Fischer, Kläui and Beach2016). Magnetic interactions in such stacks can be tuned by changing the compositions of the layers, thereby providing control over magnetic skyrmion size and density (Soumyanarayanan et al., Reference Soumyanarayanan, Raju, Gonzalez Oyarce, Tan, Im, Petrovic, Ho, Khoo, Tran, Gan, Ernult and Panagopoulos2017). High-density storage applications require small magnetic objects and magnetic skyrmions that are as small as 10 nm have been reported (Büttner et al., Reference Büttner, Lemesh and Beach2018; Caretta et al., Reference Caretta, Mann, Büttner, Ueda, Pfau, Günther, Hessing, Churikova, Klose, Schneider, Engel, Marcus, Bono, Bagschik, Eisebitt and Beach2018). Magnetic imaging techniques with high spatial resolution and sensitivity are, therefore, required to investigate small magnetic skyrmions.
Several different magnetic imaging techniques have been used to study multilayer samples, including scanning transmission X-ray microscopy (Moreau-Luchaire et al., Reference Moreau-Luchaire, Moutafis, Reyren, Sampaio, Vaz, Van Horne, Bouzehouane, Garcia, Deranlot, Warnicke, Wohlhüter, George, Weigand, Raabe, Cros and Fert2016; Woo et al., Reference Woo, Litzius, Krüger, Im, Caretta, Richter, Mann, Krone, Reeve, Weigand, Agrawal, Lemesh, Mawass, Fischer, Kläui and Beach2016), polar magneto-optical Kerr effect (MOKE) microscopy (Jiang et al., Reference Jiang, Zhang, Yu, Zhang, Wang, Jungfleisch, Pearson, Cheng, Heinonen, Wang, Zhou, Hoffmann and te Velthuis2017; Schott et al., Reference Schott, Bernand-Mantel, Ranno, Pizzini, Vogel, Béa, Baraduc, Auffret, Gaudin and Givord2017), magnetic force microscopy (Zhang et al., Reference Zhang, Zhang, Zhang, Barton, Neu, Zhao, Hou, Wen, Gong, Kazakova, Wang, Peng, Garanin, Chudnovsky and Zhang2018c; Casiraghi et al., Reference Casiraghi, Corte-León, Vafaee, Garcia-Sanchez, Durin, Pasquale, Jakob, Kläui and Kazakova2019), and Lorentz transmission electron microscopy (LTEM) (Pollard et al., Reference Pollard, Garlow, Yu, Wang, Zhu and Yang2017). Fresnel defocus imaging in LTEM is a widespread technique for investigating magnetic spin textures with high spatial resolution (Chapman, Reference Chapman1984; Phatak et al., Reference Phatak, Petford-Long and Graef2016). When electrons pass through a magnetic induction field B ⊥ that is oriented perpendicular to their trajectory, they are deflected by the Lorentz force. To a first approximation, the deflection angle is given by the expression θ = (eλ/h) B ⊥t, where e is the electron charge, λ is the electron wavelength, t is the specimen thickness, and h is Planck's constant. The deflection of the electron beam leads to variations in contrast at the locations of magnetic domain walls in Fresnel defocus images. However, in the case of an out-of-plane-magnetized layer that hosts Néel-type domain walls, there is no contrast at zero sample tilt angle (when the layer is perpendicular to the electron beam) because the curl of the magnetization has no component in the electron beam direction (McVitie & Cushley, Reference McVitie and Cushley2006; Benitez et al., Reference Benitez, Hrabec, Mihai, Moore, Burnell, McGrouther, Marrows and McVitie2015). Contrast can be obtained by tilting the sample, so that a fraction of the out-of-plane magnetic field is projected onto a plane perpendicular to the optical axis of the microscope (Benitez et al., Reference Benitez, Hrabec, Mihai, Moore, Burnell, McGrouther, Marrows and McVitie2015; Pollard et al., Reference Pollard, Garlow, Yu, Wang, Zhu and Yang2017). Fresnel defocus images have been used to study Néel-type magnetic skyrmions in a variety of multilayer samples (Pollard et al., Reference Pollard, Garlow, Yu, Wang, Zhu and Yang2017; He et al., Reference He, Li, Zhu, Zhang, Peng, Li, Li, Wei, Zhao, Zhang, Wang, Lin, Gu, Yu, Cai and Shen2018; McVitie et al., Reference McVitie, Hughes, Fallon, McFadzean, McGrouther, Krajnak, Legrand, Maccariello, Collin, Garcia, Reyren, Cros, Fert, Zeissler and Marrows2018; Fallon et al., Reference Fallon, McVitie, Legrand, Ajejas, Maccariello, Collin, Cros and Reyren2019; Garlow et al., Reference Garlow, Pollard, Beleggia, Dutta, Yang and Zhu2019; Jiang et al., Reference Jiang, Zhang, Wang, Phatak, Wang, Zhang, Jungfleisch, Pearson, Liu, Zang, Cheng, Petford-Long, Hoffmann and te Velthuis2019; Li et al., Reference Li, Lau, De Graef and Sokalski2019) in the presence of different external stimuli (He et al., Reference He, Peng, Zhu, Li, Cai, Li, Wei, Gu, Wang, Zhao, Shen and Zhang2017; Zhang et al., Reference Zhang, Zhang, Wen, Chudnovsky and Zhang2018a, Reference Zhang, Zhang, Wen, Chudnovsky and Zhang2018b). However, it is difficult to obtain well-resolved Fresnel defocus images of small Néel-type magnetic skyrmions with high contrast for several reasons. First, as the constituent ferromagnetic layers are very thin (often only a few atomic layers in thickness), the magnetic signal integrated along the electron beam path is weak. It can be increased by repeating the layer stack to increase the total thickness of ferromagnetic material, but the repetition of heavy metal layers reduces the transmitted beam intensity. Second, the polycrystalline structure of layers that have been deposited by sputtering can create a rapidly varying background associated with diffraction contrast from individual grains, which is superimposed on the magnetic phase contrast. Third, the use of a large sample tilt angle to increase the magnetic contrast also increases the projected sample thickness, which reduces the transmitted intensity and results in weak contrast. Fourth, if the magnetic field of the conventional microscope objective lens is used to stabilize magnetic skyrmions, then the in-plane component of this field in a tilted sample can lead to deformations of the magnetic skyrmion texture (Zhang et al., Reference Zhang, Zhang, Wen, Peng, Qiu, Matsumoto and Zhang2020). As a result of these problems, it is often necessary to use large defocus values (typically several mm) to obtain sufficient magnetic contrast, which results in blurring and can lead to erroneous interpretation. Therefore, it is important to find strategies to improve the magnetic contrast and spatial resolution of Fresnel defocus images of Néel-type magnetic skyrmions.
Here, we investigate the benefits of using background subtraction to remove contributions from diffraction contrast on the quality of Fresnel defocus images of Néel-type magnetic skyrmions. We perform experiments on a ferromagnetically coupled (Pt/Co/NiFe)×5 multilayer and discuss the results in terms of magnetic signal-to-noise ratio (SNR) and spatial resolution. Defocus series of Fresnel images are also simulated based on theoretical skyrmion models, and the influence of defocus on apparent magnetic skyrmion size is assessed.
Materials and Methods
The sample studied here consists of a stack of nominal composition Ta(3)/Pt(1.5)/[Pt(1.5)/Co(0.3)/Py(0.9)]×5/Ru(0.5)/Pt(2), where the numbers between parentheses correspond to the thicknesses of the layers in nm, ×5 is the number of repetitions, and Py corresponds to permalloy (Ni0.8Fe0.2). In total, the stack contains 6 nm of ferromagnetic materials (Co and Py) and 14.5 nm of heavy metals (Pt, Ta, and Ru). The Pt/Co interfaces are expected to provide a large magnetic anisotropy perpendicular to the layers and host a large positive DMI. (Values of +1.5–+3 meV have been reported (Yang et al., Reference Yang, Thiaville, Rohart, Fert and Chshiev2015; Boulle et al., Reference Boulle, Vogel, Yang, Pizzini, de Souza Chaves, Locatelli, Mentes, Sala, Buda-Prejbeanu, Klein, Belmeguenai, Roussigné, Stashkevich, Chérif, Aballe, Foerster, Chshiev, Auffret, Miron and Gaudin2016; Jadaun et al., Reference Jadaun, Register and Banerjee2020).) On the other hand, the Pt/Py interface should host a negative DMI. (Values of approximately −1 meV have been reported for Pt/Py (Nembach et al., Reference Nembach, Shaw, Weiler, Jué and Silva2015) and Pt/Ni interfaces (Chen et al., Reference Chen, Ma, N'Diaye, Kwon, Won, Wu and Schmid2013; Jadaun et al., Reference Jadaun, Register and Banerjee2020).) The stack was deposited directly onto a 15-nm-thick SiN membrane using DC magnetron sputtering. An image of a cross-section of the stack and corresponding compositional profiles are shown in Supplementary Information 1.
A magnetic hysteresis loop of the sample was recorded using a MOKE microscope in the presence of an out-of-plane external field.
Fresnel defocus imaging was carried out at room temperature using an FEI Titan TEM equipped with a Schottky field emission gun, a CEOS image aberration corrector, a C-TWIN objective lens with a large pole piece gap of 11 mm, and a 4k×4k Gatan K2-IS direct electron detector. The microscope was operated at 300 kV in magnetic-field-free conditions (Lorentz mode) by using the first transfer lens of the aberration corrector as the primary imaging lens. The conventional microscope objective lens was then used to apply chosen magnetic fields to the sample. The applied magnetic fields were pre-calibrated using a Hall probe. All of the applied magnetic field values referred to below correspond to fields in the electron beam direction (i.e., perpendicular to the sample when the stage is at 0°). Fresnel defocus series were recorded by changing the excitation of the transfer lens. Defocus values were calibrated by analyzing the spacing of Fresnel fringes produced at an opaque edge (Reimer & Kohl, Reference Reimer and Kohl2008). Images were processed using Digital Micrograph (Gatan) software. Bright-field TEM imaging was carried out using the same microscope operated in conventional TEM mode with a small objective aperture centered around the transmitted beam.
Magnetization models of Néel-type skyrmions were calculated using an analytical expression described in Appendix A. These models were used as input to simulations of Fresnel defocus images, as described in Appendix B.
Results
Magnetic and Crystalline Structure of the Sample
Figure 1a shows Fresnel defocus images of the sample recorded at a defocus of −7.5 mm and a nominal sample tilt angle of 30° for different values of magnetic field applied using the conventional microscope objective lens. In zero applied magnetic field, the Fresnel defocus image shows black and white curved lines, which result from the presence of magnetic domains separated by domain walls. These magnetic domain walls produce very weak Fresnel defocus contrast at zero sample tilt (see Supplementary Information 2), suggesting that they are 180° Néel-textured walls (Benitez et al., Reference Benitez, Hrabec, Mihai, Moore, Burnell, McGrouther, Marrows and McVitie2015). In the presence of an applied magnetic field, the magnetic domain walls move and form black/white pairs (see the image at 23 mT), which are equivalent to 360° magnetic domain walls (Kubetzka et al., Reference Kubetzka, Pietzsch, Bode and Wiesendanger2003). On increasing the applied magnetic field further, the magnetic domains are erased progressively. The image recorded at 46 mT corresponds to a saturated state with no magnetic contrast, as all of the magnetic moments in the sample are then close to being parallel and oriented out-of-plane.
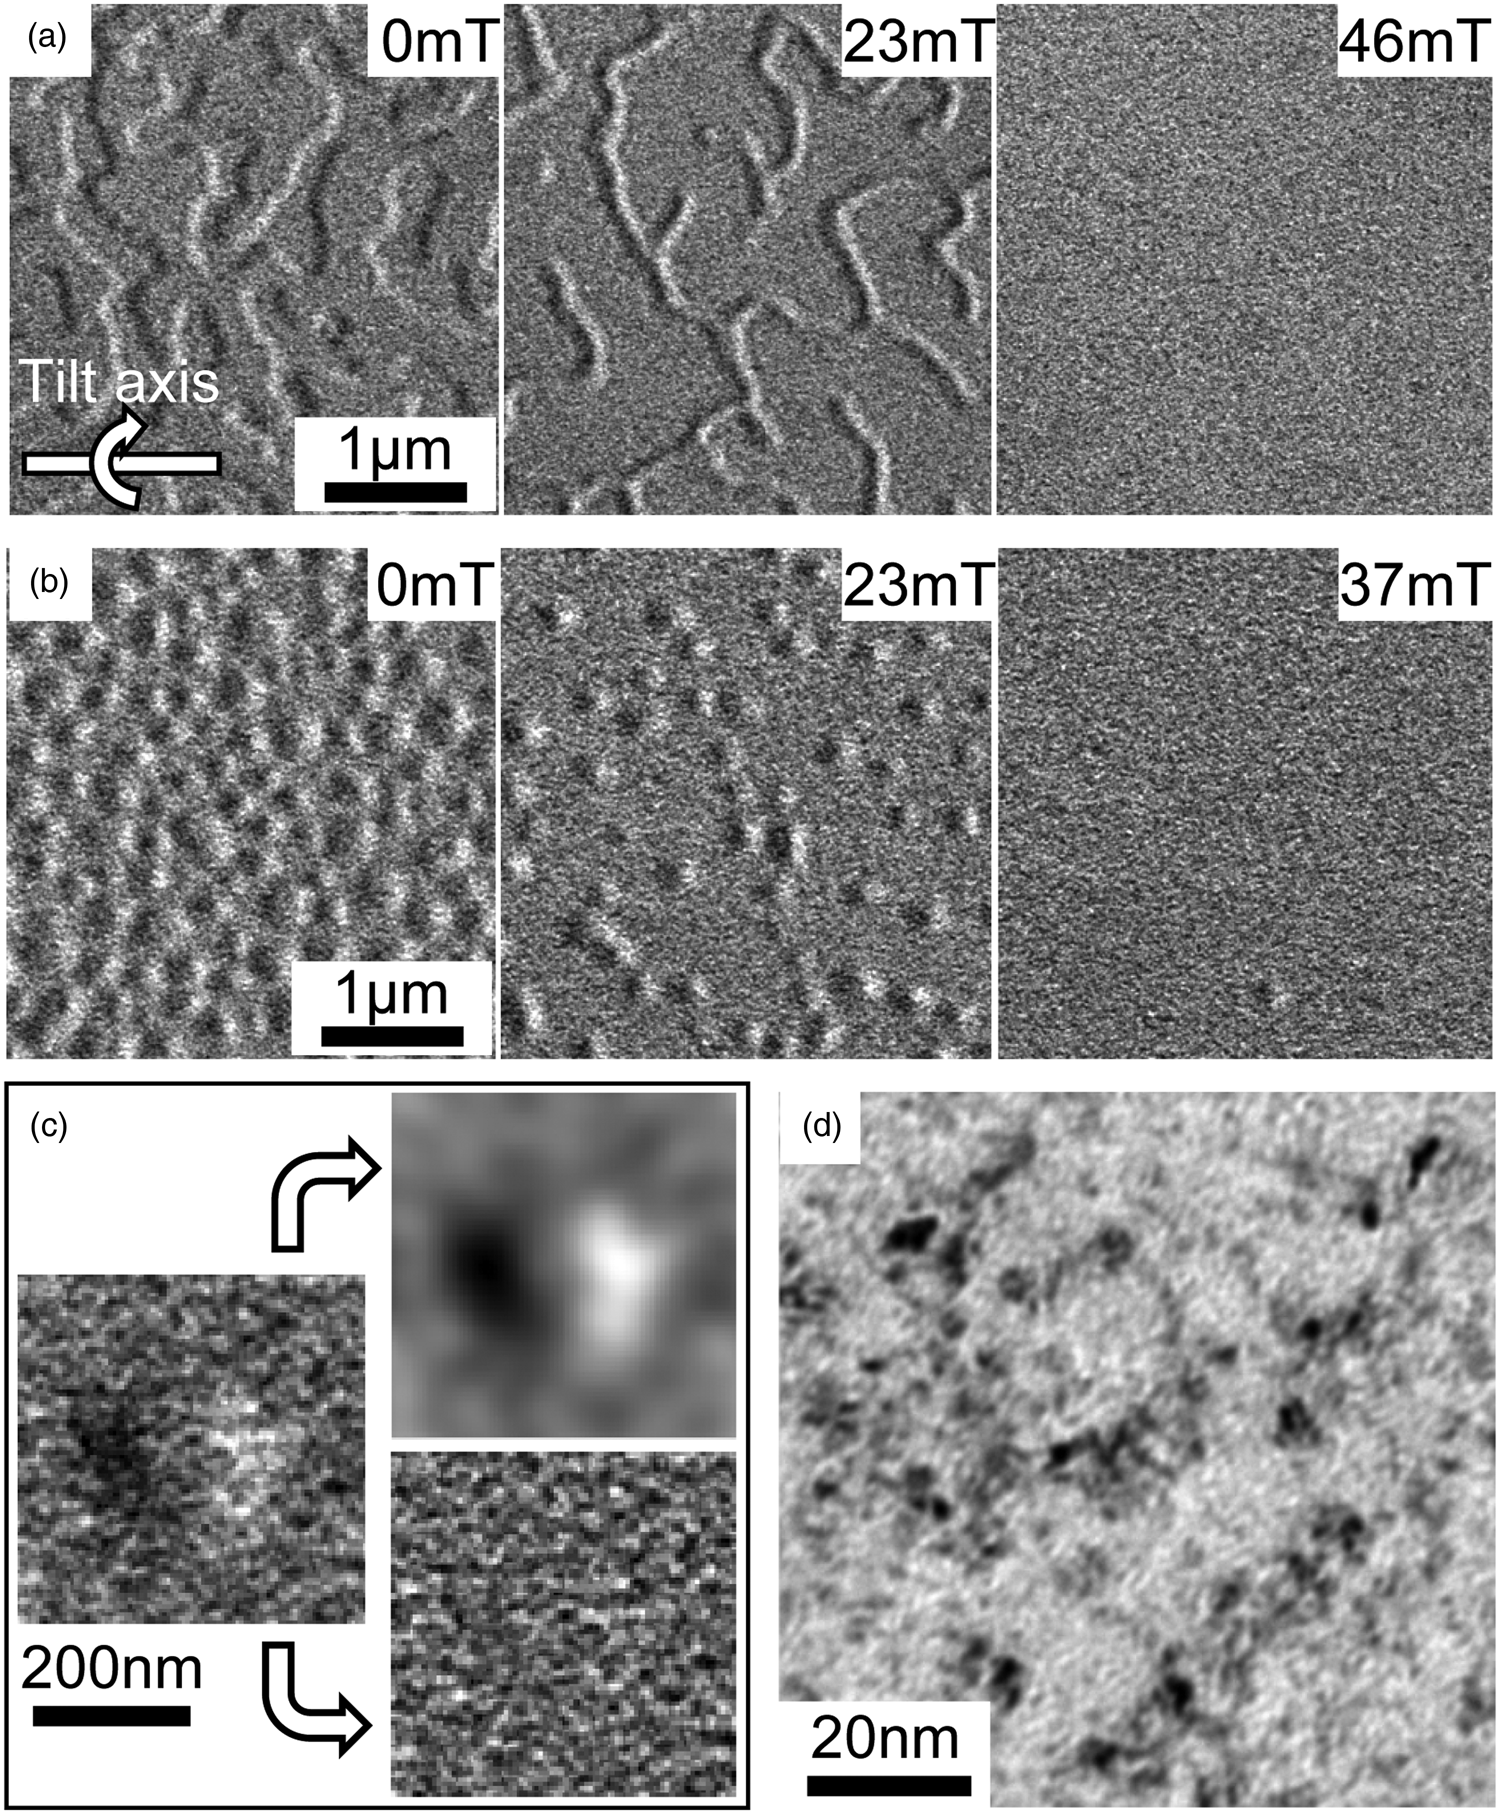
Fig. 1. (a) Fresnel defocus images of the (Pt/Co/NiFe)×5 multilayer film recorded in Lorentz mode using a defocus of −7.5 mm and a sample tilt angle of 30° in the presence of the indicated magnetic fields applied using the conventional microscope objective lens. (b) Fresnel defocus images recorded after in-plane magnetic saturation of the sample in the presence of the indicated magnetic fields. (c) Left: Magnified image of a single skyrmion; Upper right: low spatial frequency components of the image; Lower right: high spatial frequency components of the image. The low and high spatial frequency components were separated using a binary circular filter of radius 10 μm−1 in Fourier space. (d) In-focus bright-field TEM image recorded at high magnification showing the polycrystalline grain structure of the sample.
In this first series of images, the number of magnetic skyrmions is low. To obtain more magnetic skyrmions, the sample was saturated in an in-plane direction, as reported in previous studies (Qin et al., Reference Qin, Wang, Zhu, Jin, Fu, Liu and Cao2018; Li et al., Reference Li, Rai, Pokhrel, Sapkota, Mewes, Mewes, Graef and Sokalski2020). The in-plane magnetic field was applied in situ in the TEM by tilting the sample to 80° and exciting the conventional microscope objective lens fully (corresponding to an applied magnetic field of approximately 1.4 T) for a few seconds. The sample was then tilted back to 30° to record Fresnel defocus images, as shown in Figure 1b. A compact array of magnetic skyrmions of different size is now visible in zero applied magnetic field. A small perpendicular field was then applied again to decrease the density of the magnetic skyrmions and to stabilize them (see images at 23 and 37 mT).
Figure 1c shows a magnified image of an individual Néel-type magnetic skyrmion. The low and high spatial frequency components of the image, which were separated by using a band-pass filter of radius 10 μm−1 applied in Fourier space, are shown in the upper right and lower right parts of Figure 1c, respectively. The low spatial frequency components, which take the form of a pair of black and white streaks aligned parallel to the tilt axis, are related to the out-of-plane skyrmion magnetization projected onto the image plane. The high spatial frequency components show an apparently random distribution of mottled contrast. This background degrades the visibility of the magnetic signal in the original Fresnel defocus image strongly. It originates primarily from diffraction contrast from individual small grains in the polycrystalline structure of the stack. Figure 1d shows crystal grains that have a size of approximately 5–10 nm in an in-focus bright-field TEM image. The separation of the magnetic signal from diffraction contrast using Fourier filters would be reasonable for magnetic skyrmions that are significantly larger than the crystal grains. However, the use of Fourier filtering can degrade the spatial resolution of the image further and introduce additional artifacts, thereby preventing the observation of small magnetic skyrmions. Careful background subtraction is required to remove this mottled contrast without reducing the spatial resolution of the image appreciably.
Subtraction of the Non-magnetic Background
One possible approach for subtracting the non-magnetic background is to increase the applied magnetic field to saturate the magnetic moments in the sample and to record and subtract the corresponding image (see, for example, Park et al., Reference Park, Chen, Zhang, Zhu, Muller and Fuchs2020). However, this approach requires the alignment of the resulting images, taking into account changes in rotation and magnification due to the different excitation of the objective lens (see Supplementary Information 3). For small changes in the excitation of the objective lens, these problems can be circumvented by using the following approach. Figure 2a shows a magnetic hysteresis curve recorded from the sample using MOKE microscopy in an out-of-plane magnetic field. As shown in the previous section, individual magnetic skyrmions can be stabilized by applying a magnetic field of 23 mT (label ‘b’ on the hysteresis curve). Figure 2b shows a Fresnel defocus image of four magnetic skyrmions recorded at this field, and Figure 2c shows the same image after the application of a low-pass filter (of radius 10 μm−1 in Fourier space). The applied magnetic field was increased further to saturate the sample (at 46 mT) and then decreased to the initial field of 23 mT (label ‘d’ on the hysteresis curve). When the applied magnetic field was decreased after saturating the sample, the presence of a large plateau in the upper part of the hysteresis curve (between −5 and 45 mT) suggests that the sample should remain saturated, even at remanence, i.e., with the applied magnetic field removed. Figure 2d indeed shows that the corresponding Fresnel defocus image recorded at 23 mT contains mottled background contrast and no magnetic features. The rotation and magnification of the two images (b and d) are the same, making their alignment and subtraction more straightforward. For alignment, a simple shift of the images was applied using cross-correlation, in order to compensate for sample and/or image drift. (A simple alignment script for Digital Micrograph is provided in Supplementary Information 4). Figure 2e shows the difference between the two images, in which the visibility of the magnetic skyrmions is improved significantly compared to (b). After the application of a low-pass filter, as shown in Figure 2f, the background is more uniform than in (c). It shows that the subtraction removes unwanted low frequency signals that the filter lets through. This subtraction procedure can be reproduced for different values of applied magnetic field. A series of background-subtracted images of different magnetic skyrmion densities is shown in Supplementary Information 5.
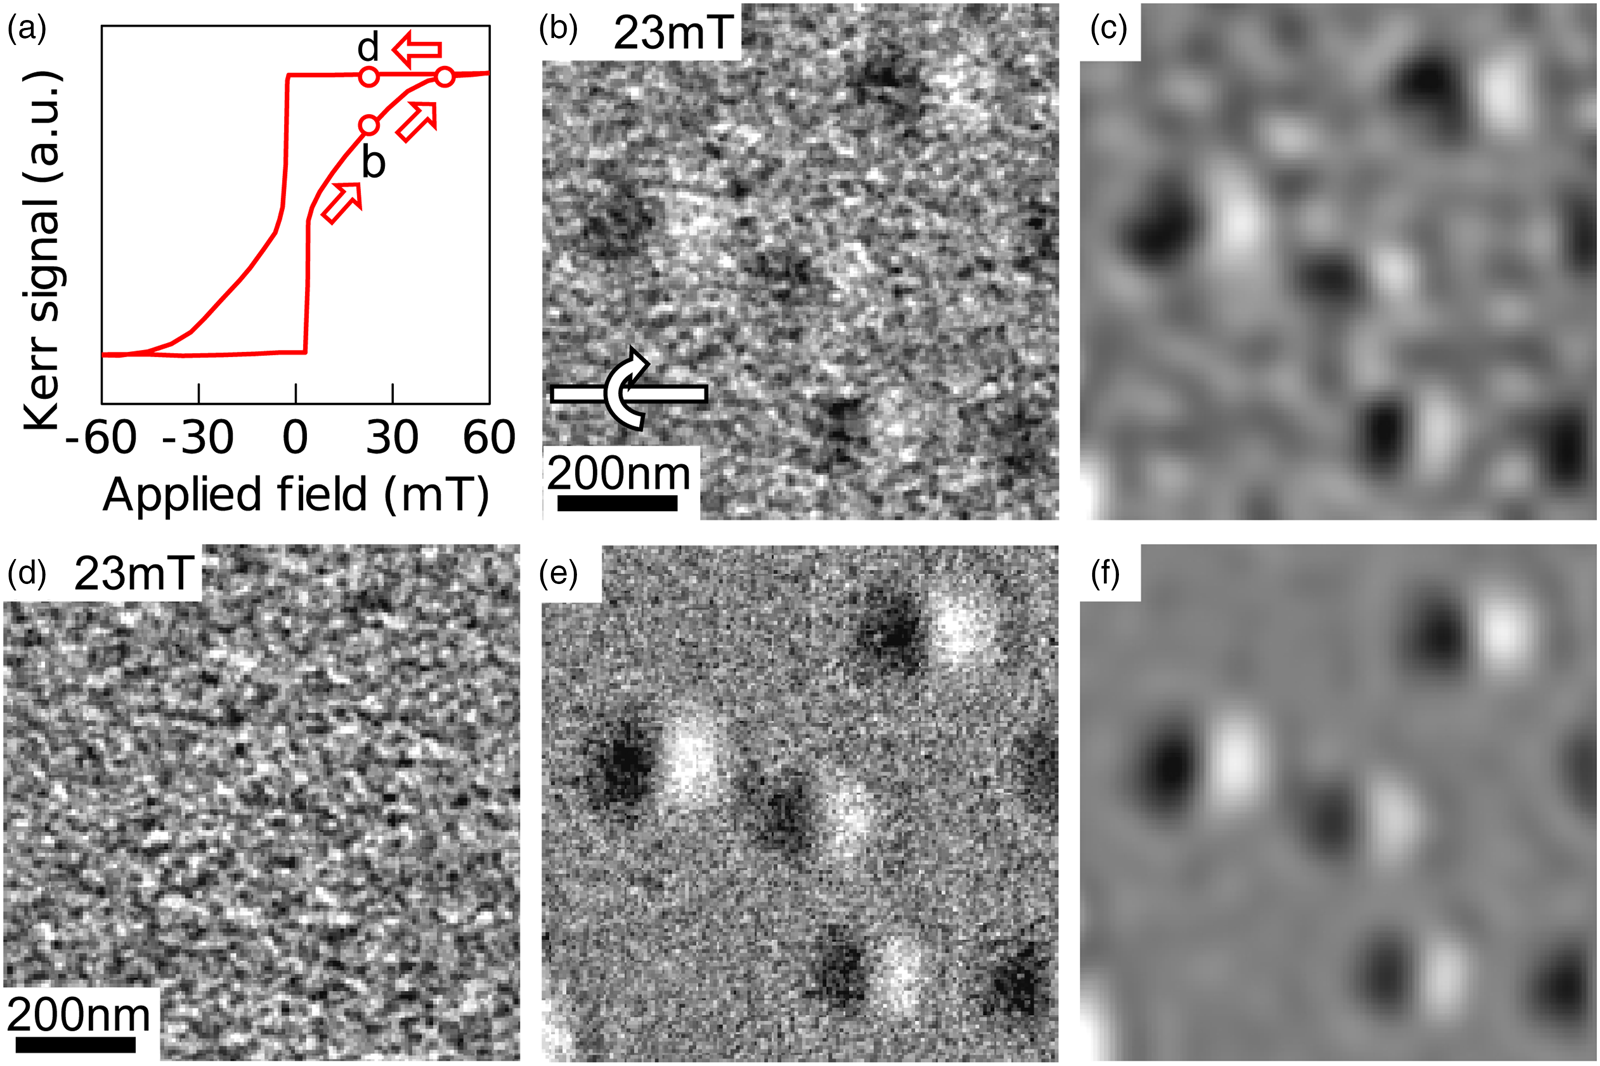
Fig. 2. (a) Magnetic hysteresis loop recorded using MOKE microscopy in the presence of an out-of-plane external field. (b) Fresnel defocus image of four magnetic skyrmions recorded in Lorentz mode at a defocus of −7.5 mm and a sample tilt angle of 30° in the presence of an applied magnetic field of 23 mT. The image is labelled “b” on the hysteresis curve. (c) Same image after the application of a low-pass filter of radius 10 μm−1 in Fourier space. (d) Fresnel defocus image recorded after increasing the applied magnetic field to achieve a saturated magnetic state (46 mT) and then decreasing it to the initial value of 23 mT. The image is labelled “d” on the hysteresis curve. (e) Difference between images (b) and (d) after alignment using cross-correlation. (f) Same image after the application of a low-pass filter of radius 10 μm−1 in Fourier space.
Defocus Series and SNR
In a Fresnel defocus image, in general the larger the defocus the stronger the magnetic contrast but the poorer the spatial resolution. To determine the smallest defocus value that can be used, images of individual Néel-type magnetic skyrmions were recorded over a defocus range of −6 mm to −375 μm, as shown in Figure 3a. Figure 3b shows the same series of images after background subtraction using the approach described in the previous section. In the original images, many of the skyrmions are barely visible as a result of the presence of the mottled diffraction contrast, in particular when the defocus is smaller than −3 mm. After background subtraction, magnetic skyrmions are visible over almost the entire range of defocus values. At the larger defocus values (−6 to −3 mm), most of the magnetic skyrmions look like dumbbells, with characteristic black and white contrast regions. At lower defocus values (smaller than −1.5 mm), the contours of the magnetic skyrmions become sharper, with the largest magnetic skymions showing a region of uniform contrast at their centers (see, for example, the magnetic skyrmion indicated by a white arrow in Fig. 3b at −1.1 mm defocus). The shapes of these objects agree with the definition of a magnetic bubble, which consists of a uniformly magnetized magnetic domain bounded by a narrow circular magnetic domain wall. It is known that multilayer samples can host different topological solitons, including magnetic bubbles and classic magnetic skyrmions (comprising a round magnetic domain wall surrounding a single out-of-plane spin) (Bernand-Mantel et al., Reference Bernand-Mantel, Camosi, Wartelle, Rougemaille, Darques and Ranno2018). For simplicity, the term magnetic skyrmion is used throughout this article to refer to all of these objects.
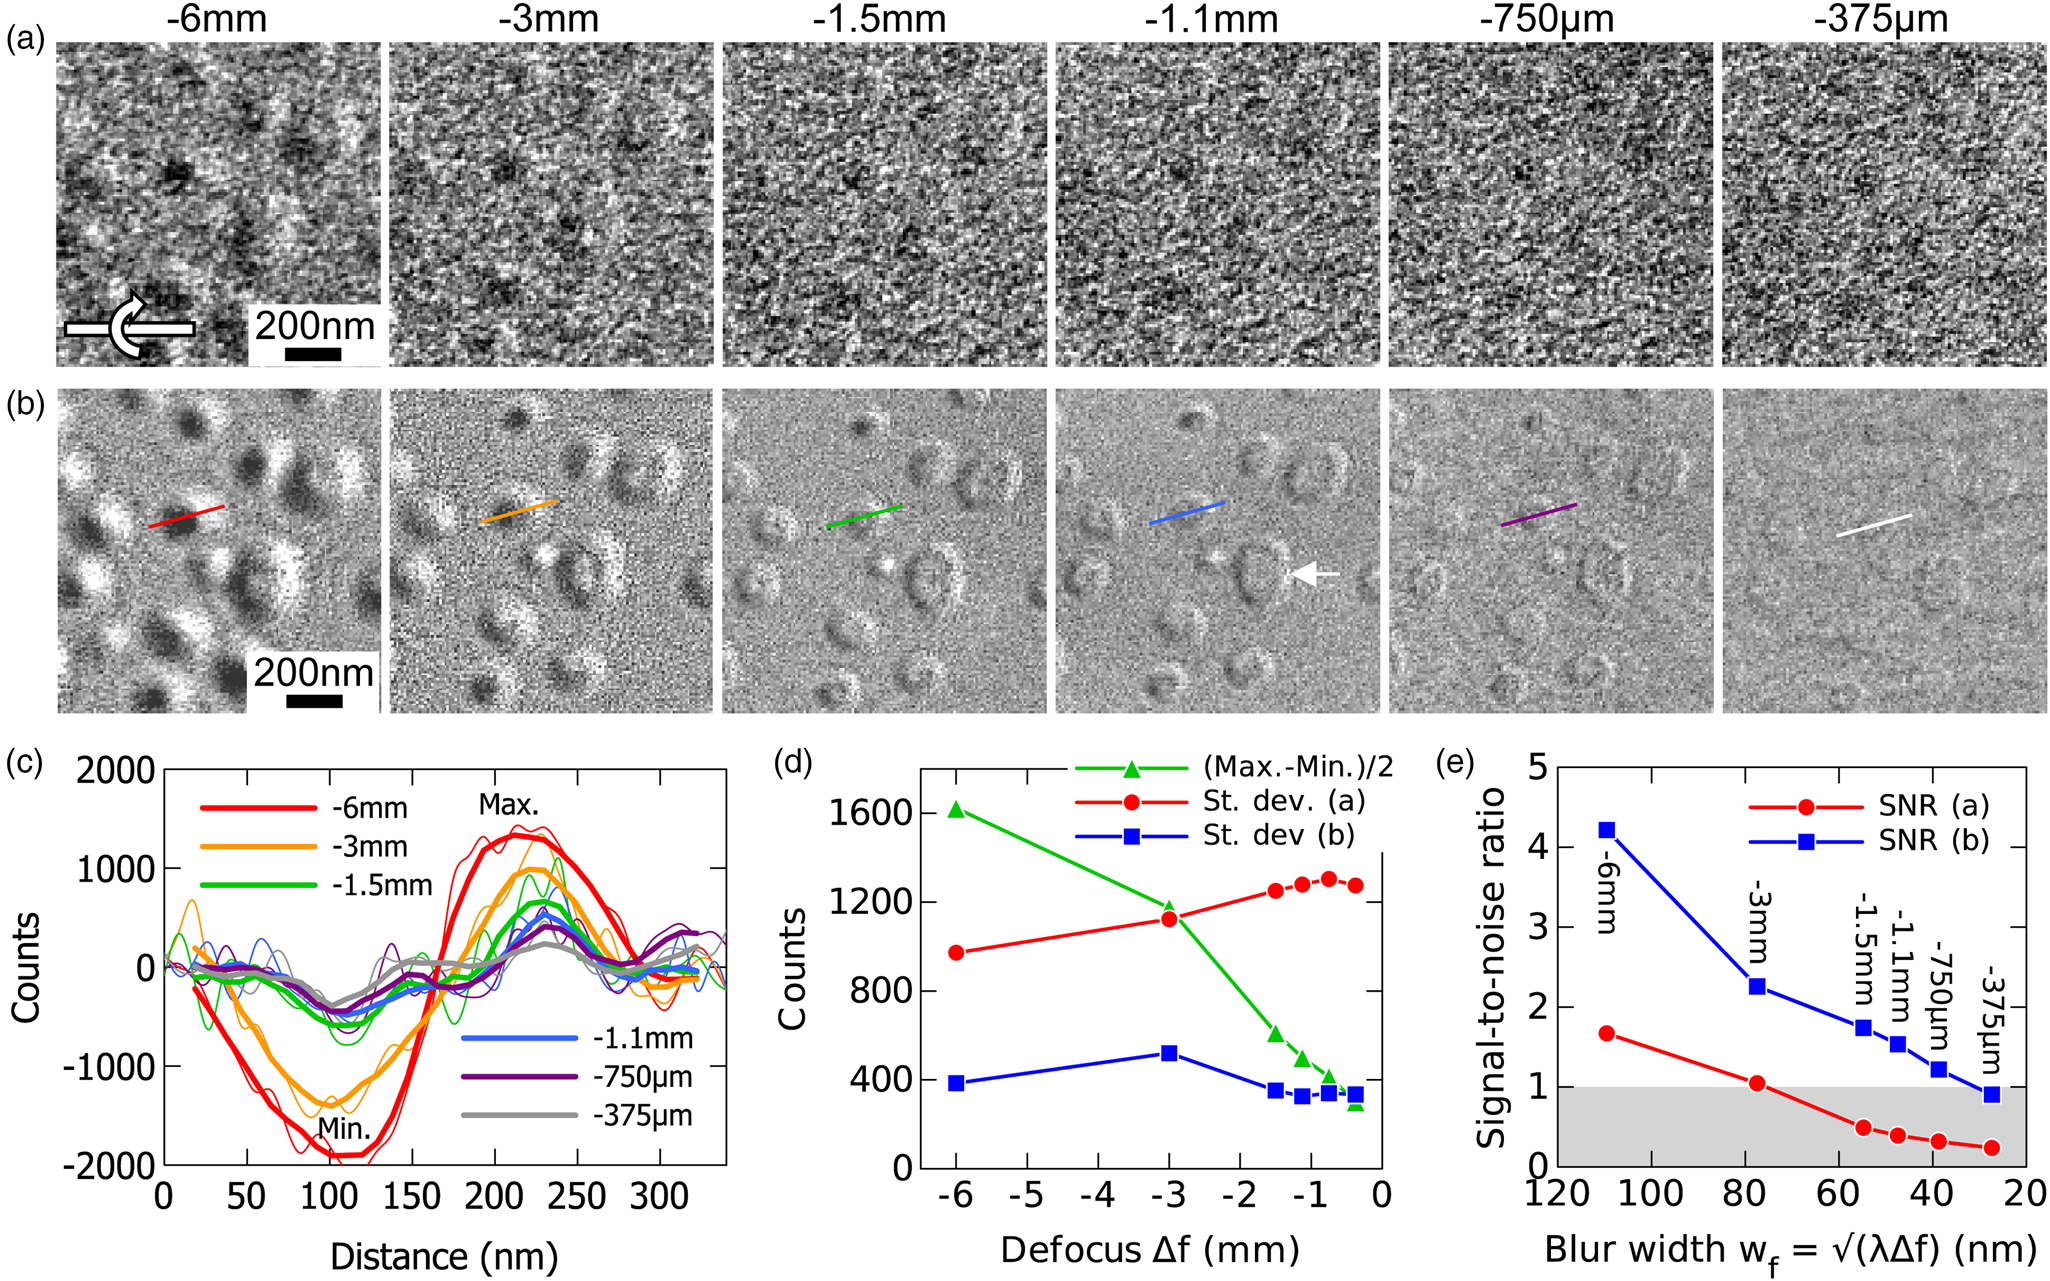
Fig. 3. (a,b) Fresnel defocus series of images recorded in Lorentz mode between −6 mm and −375 μm. The images are shown (a) before and (b) after subtracting the non-magnetic background. The sample tilt angle, applied magnetic field, and exposure time are 20°, 23 mT, and 8 s, respectively. (c) Intensity profiles across a magnetic skyrmion extracted along the lines marked in (b). Thin lines correspond to the raw data, while thick lines correspond to a moving average (averaged over 20 nm). The y axis shows both positive and negative values as a result of background subtraction. (d) Plots of the Max-to-Min intensity variations measured from (c) divided by 2 and the standard deviation of the background noise in (a,b) as a function of defocus. The standard deviation was calculated in a small region that contains no skyrmions. (e) The SNR calculated from the values in (d), plotted as a function of the width of the blur induced by the defocus (defined as the width of the first Fresnel fringe  $w_{{\rm f}}\approx \sqrt {( \lambda \Delta f) }$, where λ is the electron wavelength and Δf is the defocus). The defocus values are indicated with vertical labels. The gray region corresponds to the area where the visibility of the skyrmions is too low (SNR < 1).
A quantitative description of the magnetic SNR in Fresnel defocus images of Néel-type magnetic skyrmions is now discussed. Figure 3c shows intensity profiles extracted across an individual magnetic skyrmion at different defocus values along the lines marked in Figure 3b. The amplitude of the magnetic signal in each profile was estimated by measuring the extrema in intensity at the dip and the peak (marked Min. and Max.). The average value is plotted in Figure 3d (green triangles). The background noise, which was estimated by calculating the standard deviation of the image in a small region that contained no skyrmions, is also plotted in Figure 3d for the two series of images (red circles for the images in (a) and blue squares for the images in (b)). Background subtraction is found to decrease the noise by a factor of 2–4, depending on the defocus value. On average, the improvement is a factor of 3.3 for the defocus values considered here. Figure 3e shows the SNR calculated from the values in Figure 3d and plotted as a function of the width of the blur associated with the use of a finite value of defocus (defined as the width of the first Fresnel fringe  $w_{{\rm f}}\approx \sqrt {( \lambda \Delta f) }$, where λ is the electron wavelength and Δf is the defocus). The width of the blur provides an estimate of the spatial resolution in the images. The corresponding defocus values are marked using vertical labels on the plot. By definition, the visibility of the magnetic domain walls is too low when the SNR is below 1. In the original images, the SNR is equal to 1 for a blur width of 77 nm (corresponding to a defocus of −3 mm). After background subtraction, the SNR is equal to 1 for a blur width of 27 nm (corresponding to a defocus of −375 μm), giving an improvement factor of 2.8. We have also tried to improve the SNR in background-subtracted images by increasing the exposure time, which was 8 s for the images in Figure 3, but no further improvement could be obtained with longer exposures or cumulative acquisition. For the exposure time used here, the SNR is, therefore, not limited by shot noise caused by a low number of counts, but by residual non-magnetic information, which was not completely removed.
Apparent Size of Small Skyrmions
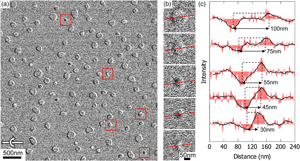
As described in the previous section, background subtraction provides improved magnetic contrast at smaller defocus values with better spatial resolution. In this section, optimized conditions are used to observe and measure the apparent sizes of small magnetic skyrmions. The results are compared with simulated Fresnel defocus images. Figure 4a shows a background-subtracted Fresnel defocus image recorded with a large field of view using a relatively low defocus value of −750 μm, which corresponds to a blur width of approximately 40 nm. The image shows a large number of Néel-type skyrmions with different sizes, shapes, and contrasts. These variations can be related to the polycrystralline structure of the stack, which contains small and irregular grains. Magnetic textures can be influenced by grain boundaries, crystalline defects, local lattice deformations, and other non-uniformities of the stack. In addition, for small skyrmions that are not clearly resolved, Fresnel fringes from the two sides of the skyrmions overlap, which can also lead to complex variations of contrast. Magnified images and intensity profiles are shown in Figures 4b and 4c for a few selected magnetic skyrmions. The apparent size of each skyrmion is defined as the distance between the dip and the peak and is indicated on the plot in Figure 4c. The apparent sizes of the selected skyrmions vary between 100 and 30 nm. For skyrmions that are larger than 55 nm, the dip and the peak are well separated, and a core region of uniform intensity is visible. For skyrmions that are smaller than 55 nm, the dip and the peak overlap and the core region are no longer visible.
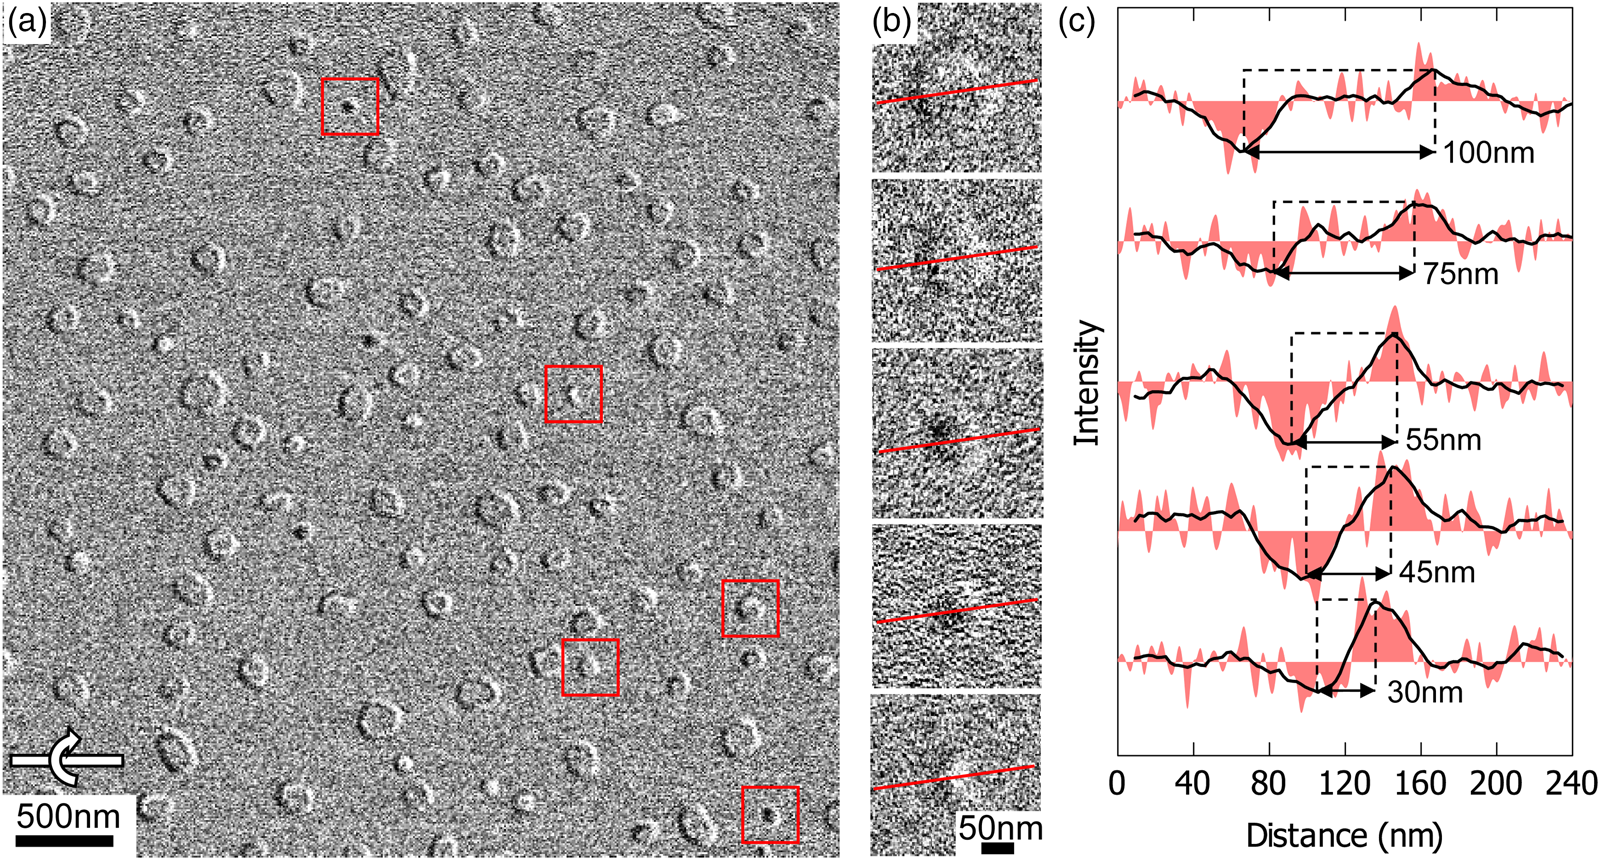
Fig. 4. (a) Background-subtracted Fresnel defocus image recorded at a defocus of −750 μm and a sample tilt angle of 20° in the presence of an applied magnetic field of 26 mT. (b) Magnified images of magnetic skyrmions of different size extracted from (a) at the positions marked by red squares. (c) Intensity profiles extracted from the images shown in (b) along the red lines. The filled curves correspond to raw data, while the black curves correspond to moving averages (averaged over 20 nm). The apparent size of each magnetic skyrmion, i.e., the distance between the dip and peak, is indicated on the plots.
To understand how the blur resulting from the use of a finite defocus value influences the apparent size of the magnetic skyrmions, simulations of Fresnel defocus images of Néel-type magnetic skyrmions were performed. Figure 5a shows the magnetization field of a 50 nm Néel-type magnetic skyrmion calculated using the analytical expression given in the Appendix and observed at a sample tilt angle of 20° (with the tilt axis horizontal). The yellow curve shows the out-of-plane component of the magnetization field projected in the image plane in the horizontal radial direction. The skyrmion can be divided into three different regions, which include the outer and inner domains (where the out-of-plane magnetization is uniform and antiparallel) and the domain wall (where the magnetization varies). The effective magnetic skyrmion size (or skyrmion diameter) is defined as the diameter of the circle where the out-of-plane magnetization is zero.
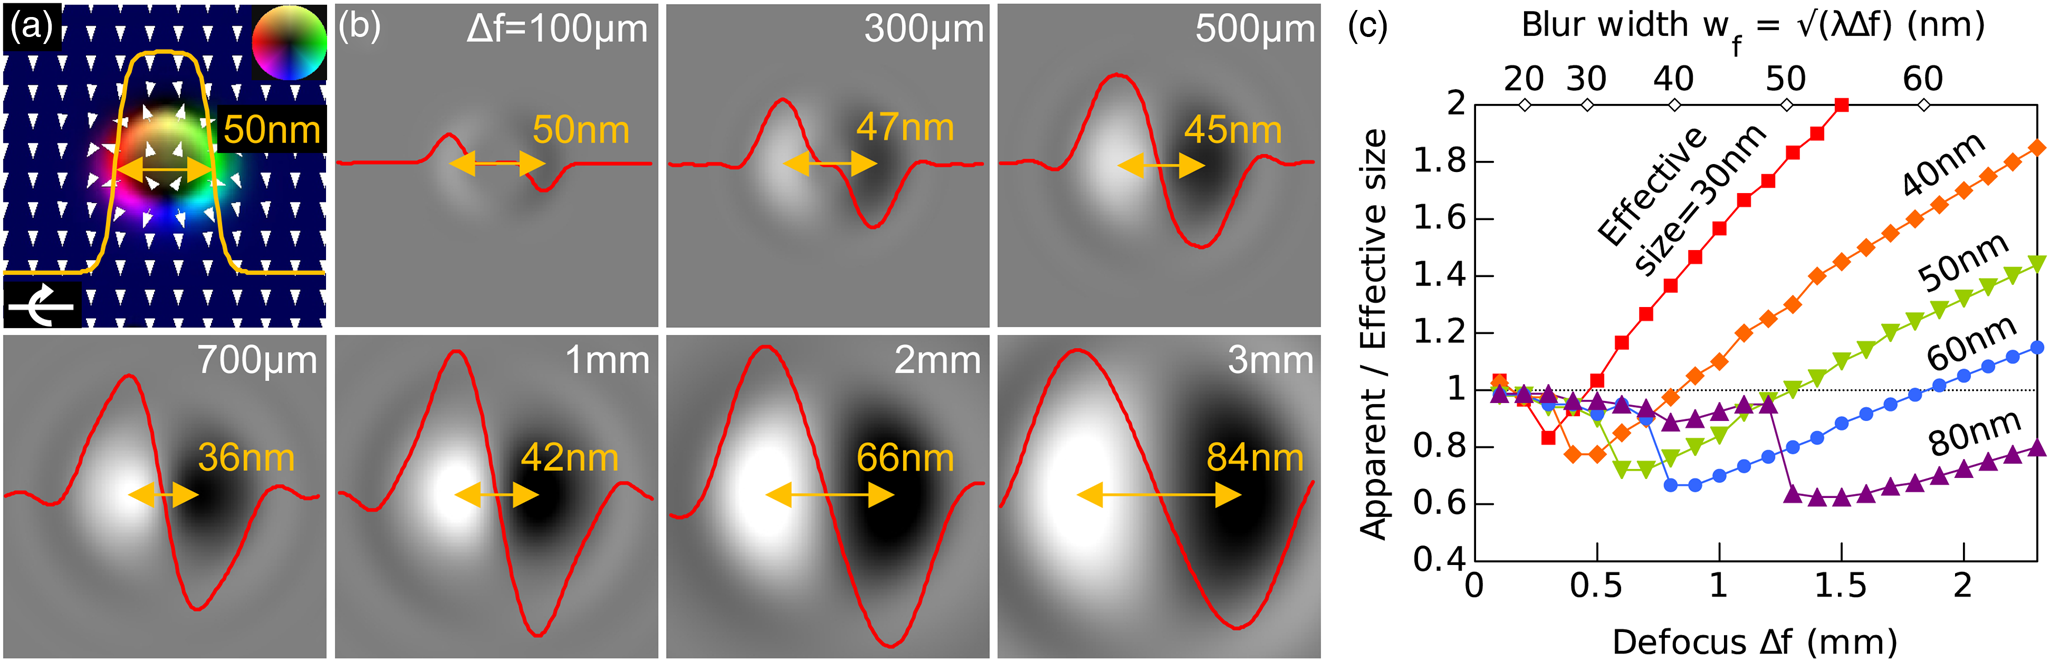
Fig. 5. (a) Theoretical magnetization distribution of a 50 nm Néel-type magnetic skyrmion for a sample tilt angle of 20° (with the tilt axis horizontal). The direction of the magnetization projected in the image plane is given by the colour wheel in the upper right corner and by the white arrows. The yellow curve corresponds to the out-of-plane component of the magnetization projected in the image plane in the horizontal radial direction. (b) Simulated Fresnel defocus images calculated from the model shown in (a) for the different defocus values indicated in the images. The red curves correspond to intensity profiles in the horizontal radial direction. The apparent size, i.e., the distance between the peak and the dip, is indicated on each image. (c) The ratio between the apparent size and the effective size of the magnetic skyrmion plotted as a function of defocus for magnetic skyrmions of different effective size. The upper x axis indicates the width of the first Fresnel fringe  $w_{{\rm f}}\approx \sqrt {( \lambda \Delta f) }$.
Figure 5b shows a series of Fresnel images simulated for a defocus range of 100 μm to 3 mm. The curves plotted on the images show the corresponding intensity distributions in the radial direction parallel to the tilt axis (i.e., the horizontal direction in the image). For small defocus Δf, the intensity at a position r in a Fresnel image is given by the expression  $I( {\bf r},\; \Delta f) = 1-\Delta f( {e\mu _{0}\lambda t}/{h}) ( \nabla \times {\bf M}( {\bf r}) ) \cdot \hat {{\bf z}}$ where e is the electron charge, μ 0 the vacuum permeability, λ the wavelength, t the specimen thickness, h Planck's constant, and $( \nabla \times {\bf M}( {\bf r}) ) \cdot \hat {{\bf z}}$ the component of the magnetization curl along the electron beam direction (McVitie & Cushley, Reference McVitie and Cushley2006). For a Néel-type skyrmion at zero sample tilt angle, the z component of the magnetization curl is uniformly zero as the curl lies completely in the sample plane (Benitez et al., Reference Benitez, Hrabec, Mihai, Moore, Burnell, McGrouther, Marrows and McVitie2015; Pollard et al., Reference Pollard, Garlow, Yu, Wang, Zhu and Yang2017). When the sample is tilted with respect to the electron beam direction, the projection of the out-of-plane components of the magnetic field onto the observation plane leads to positive and negative variations of the z curl component on the opposite sides of the skyrmion along the tilt axis. Tilted in-plane components have a very weak contribution compared to the out-of-plane components (Jiang et al., Reference Jiang, Zhang, Wang, Phatak, Wang, Zhang, Jungfleisch, Pearson, Liu, Zang, Cheng, Petford-Long, Hoffmann and te Velthuis2019). Therefore, Fresnel defocus images show essentially a peak and a dip in intensity aligned along the tilt axis. For each image in Figure 5b, the apparent magnetic skyrmion size (i.e., the distance between the dip and the peak) was measured, as indicated on the images. At a low defocus value (100 μm), the apparent size matches the effective size of the magnetic skyrmion (50 nm). At intermediate defocus values (e.g. 700 μm and 1 mm), the size is underestimated (36 and 42 nm, respectively), as the Fresnel fringes from opposites sides of the magnetic skyrmion overlap and the uniform core region is no longer visible. At larger defocus values (2 and 3 mm), the size is overestimated (66 and 84 nm, respectively), with the overestimate increasing with defocus as the extent of the blur increases. Figure 5c shows the ratio between the apparent and effective skyrmion sizes plotted as a function of defocus for different effective skyrmion sizes. If the ratio is below 1, then the skyrmion size is underestimated. If it is greater than 1, then the skyrmion size is overestimated. The width of the first Fresnel fringe ( $w_{{\rm f}}\approx \sqrt {( \lambda \Delta f) }$) is indicated on the upper x axis of the plot. At lower defocus values, the ratio of apparent to effective size remains close to 1, so long as w f is smaller than the effective skyrmion radius. On increasing the defocus, the ratio drops to 0.8–0.6, depending on the effective skyrmion size, when w f is between the effective radius and the diameter of the skyrmion. For example, in the case of a 50 nm skyrmion (green triangles), the ratio shows a minimum at a defocus value of 600 μm, which corresponds to w f = 34 nm. Beyond this minimum, the ratio increases with defocus and the slope is steeper for smaller skyrmions. The ratio becomes larger than 1 when w f is larger than the effective skyrmion size.
The results show that different deviations in the apparent magnetic skyrmion size can occur depending on the defocus value, making it difficult to determine the true size of a small magnetic skyrmion that is not well resolved. For instance, in Figure 4, the apparent size of the smallest magnetic skyrmion is measured to be 30 nm. However, it may have a true size of approximately 50 nm if its size is underestimated at this defocus value. In the defocus series shown in Figure 3c, the skyrmion is larger and its apparent size is measured to be 130 nm at low defocus (see, for instance, the purple profile at −750 μm). By extrapolating the results of the simulations, the Fresnel fringes should overlap and the apparent skyrmion size should decrease when the value of w f is between 65 and 130 nm, which corresponds to defocus values of approximately 2–8 mm. Indeed, the inner domain is not visible in the profiles obtained at −3 and −6 mm, and the apparent skyrmion size is reduced at −6 mm (approximately 100 nm, see the red profile).
Discussion
The contrast of magnetic Néel-type skyrmions in Fresnel defocus images of heavy metal/ferromagnet multilayers is often weak and can be obscured by strong diffraction contrast from the underlying polycrystalline grain structure of the sample. We have described a background subtraction procedure that can be used to improve the visibility of magnetic contrast recorded from skyrmions significantly. The approach involves setting the excitation of the objective lens to an intermediate value that stabilizes individual magnetic skyrmions. The excitation of the objective lens is increased to saturate the sample and then decreased to the initial value. In this way, a sample that displays out-of-plane hysteresis can remain in a close-to-saturated state and the two Fresnel defocus images can be subtracted from each other to remove non-magnetic contributions to the contrast. The rotation and magnification of the images are the same, making their alignment based on simple cross-correlation possible to compensate for any drift of the sample or the image. This approach works well if the change in excitation of the objective lens is relatively small (corresponding to a few tens of mT) between the acquisition of the skyrmion image and the background image. For larger variations, the hysteresis of the objective lens can affect the quality of the subtraction. The method can be used to remove undesirable variations in contrast due to crystal grains, supporting membrane and contaminants. The resulting improvement in magnetic contrast allows the use of smaller defocus values and provides an improvement in spatial resolution. It should be applicable to different multilayer samples with perpendicular anisotropy, although its degree of applicability will depend on the shape of the hysteresis curve. For the sample investigated here, the smallest defocus that could be used is approximately 400 μm (corresponding to a resolution of 30 nm) with a SNR of 1. In general, the best achievable resolution will depend on the strength of the magnetic field, the total thickness of the ferromagnetic layers, and diffraction contrast among other parameters. The stack observed here is quite thin as it contains only five repetitions. It can be expected that for thicker stacks (with for instance 10–15 repetitions), the magnetic signal would be stronger and then lower defocus could be used to improve the spatial resolution further.
Simulations show that delocalization effects in Fresnel defocus images can lead to inaccurate measurements of magnetic skyrmion size. Deviations can occur when the defocus is large enough that Fresnel fringes from opposite sides of a magnetic skyrmion overlap. As a result of such interference, the apparent magnetic skyrmion size does not follow a simple relationship with defocus. Three main situations can be distinguished, depending on the width of the Fresnel fringes compared to the true magnetic skyrmion size. At small defocus values, i.e., when the width of the first Fresnel fringe w f is smaller than the skyrmion radius (w f < d/2), the apparent skyrmion size remains close to the true size. At intermediate defocus values, i.e., when w f is between the radius and the diameter of the skyrmion (d/2 < w f < d), the skyrmion size can be underestimated. At larger defocus values, i.e., when w f exceeds the effective skyrmion diameter (w f > d), the skyrmion size can be overestimated. These different possibilities can make it difficult to determine the true size of a small magnetic skyrmion that is not well resolved.
Conclusions
We have described a background subtraction procedure that can be used to improve the contrast of magnetic skyrmions in Fresnel defocus images of perpendicularly magnetized multilayers of heavy metals and ferromagnets. This approach reduces the influence of diffraction contrast from the crystal grains. It allows smaller defocus values to be used and provides an improvement in spatial resolution by a factor of approximately 3. Sub-mm defocus values could be used, while maintaining reasonable visibility, in order to study skyrmions that have sizes as small as 50 nm. This method should be beneficial for the interpretation of magnetic induction maps calculated using the transport-of-intensity equation (Teague, Reference Teague1983; McCray et al., Reference McCray, Cote, Li, Petford-Long and Phatak2021). It is also equally applicable to in-focus magnetic imaging techniques, such as off-axis electron holography (see an example in Supplementary Information 6) (McCartney & Smith, Reference McCartney and Smith2007; Denneulin et al., Reference Denneulin, Caron, Hoffmann, Lin, Tan, Kovács, Blügel and Dunin-Borkowski2021). Simulations show that the apparent size of a magnetic skyrmion recorded at a large defocus value can deviate significantly from its true size, emphasizing the need for strategies that allow image contrast to be optimized while improving spatial resolution, especially for the study of small magnetic skyrmions.
Supplementary Material
To view supplementary material for this article, please visit https://doi.org/10.1017/S1431927621012927.
Acknowledgements
This work was supported by the DARPA TEE program through grant MIPR# HR0011831554; the European Union's Horizon 2020 Research and Innovation Programme under grant agreements 856538 (project “3D MAGIC”) and 823717 (project “ESTEEM3”); the Deutsche Forschungsgemeinschaft (DFG, German Research Foundation)—project ID 405553726—TRR 270; and the Initiative and Network Fund of the Helmholtz Association under contract VH-NG-1317. The authors acknowledge W. Pieper for technical support.
Appendix A. Analytical Expression for Skyrmion Magnetization
To obtain the magnetization distribution of an individual magnetic skyrmion with well-defined dimensions, we used standard analytical expressions that approximate it as a 360° magnetic domain wall (Braun, Reference Braun1994; Romming et al., Reference Romming, Kubetzka, Hanneken, von Bergmann and Wiesendanger2015). The magnetization M is defined in a cylindrical coordinate system M = (M r, M φ, M z) as
 $${\bf M} = [ \cos( \phi) \sin( \theta( r) ) ,\; \sin( \phi) \sin( \theta( r) ) ,\; \cos( \theta( r) ) ] ,\; $$
where ϕ = 0 for a Néel-type magnetic domain wall and
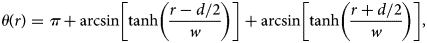 $$\theta( r) = \pi + \arcsin\left[\tanh\left({r-d/2\over w}\right)\right] + \arcsin\left[\tanh\left({r + d/2\over w}\right)\right],\; $$
where d is the magnetic skyrmion diameter and w is the magnetic domain wall width parameter. In Figure 5, the magnetic domain wall width parameter was set to w = 19/π nm based on an experimental measurement carried out using off-axis electron holography (see Supplementary Information 6).
Appendix B. Simulation of Fresnel Defocus Images
Magnetization distributions obtained using analytical expressions described in the previous section were used as an input to an optimized forward model programmed in Python for simulating magnetic-phase images (Caron, Reference Caron2018). First, the two-dimensional magnetization distributions were extended to create three-dimensional distributions, taking into account the thicknesses of the ferromagnetic layers. In Figure 5, the magnetization distribution was set as purely Néel-type and invariant through the specimen thickness. (Additional simulations for mixed Bloch-Néel skyrmions are shown in Supplementary Information 7.) Second, the three-dimensional magnetization distribution was projected onto a two-dimensional, two-component vector field Mproj(x, y) = (M proj,x(x, y); M proj,y(x, y)), taking into account the tilt of the specimen with respect to the incident electron beam direction. The magnetostatic contribution to the phase can then be written in the form (Mansuripur, Reference Mansuripur1991)
 $$\varphi_{{\rm mag}}( x,\; y) = -{\mu_{\rm 0}\over 2\Phi_{{\rm 0}}} \int{( y-y') M_{{\rm proj, x}}( x',\; y') -( x-x') M_{{\rm proj, y}}( x',\; y') \over ( x-x') ^{2} + ( y-y') ^{2}}\, dx'\, dy',$$
where μ 0 is the vacuum permeability and  $\Phi _{0} = {\pi \hbar }/{e}$ is the magnetic flux quantum. The third step of the simulation approximates every pixel in the discretized projected distribution using simple homogeneously magnetized geometries such as discs or squares, which have known phase contributions, in order to calculate the final magnetic phase image. The discretization is carried out in real space, while the subsequent convolution of the two projected magnetization components with the respective kernels for simple geometries is carried out in Fourier space.
Fresnel defocus images were then calculated from the phase images by setting up a wave function of the form  $\Psi ( x,\; y) = {\rm e}^{{\rm i}\varphi _{{\rm mag}}( x, y) }$, which was multiplied in Fourier space by a phase plate according to the expression
 $$\Psi_{{\rm LTEM}}( x,\; y) = {\cal F}_{2}^{-1}\{ {\cal F}_{2}\{ {\rm e}^{{\rm i}\varphi_{{\rm mag}}( x, y) }\} \cdot {\rm e}^{-{\rm i}\chi( q_{x}, q_{y}) }\} ,\; $$
where  ${\cal F}_{2}{ \ldots }$ and ${\cal F}_{2}^{-1}{ \ldots }$ denote a two-dimensional Fourier transform and its inverse, while χ(q x, q y) denotes an aberration function, which takes the form (Chapman, Reference Chapman1984)
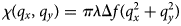 $$\chi( q_{x},\; q_{y}) = \pi\lambda\Delta f( q_{x}^{2} + q_{y}^{2}) $$
and only contains the term for defocus Δf in this work. The spherical aberration of the Lorentz lens and divergence of the electron source (damping envelope) were not taken into account here, but their influence on simulated Fresnel images is discussed in Supplementary Information 8.
The intensity of the final Fresnel defocus images is then given by the expression
 $$I_{{\rm LTEM}}( x,\; y) = \Psi_{{\rm LTEM}}( x,\; y) \cdot\Psi_{{\rm LTEM}}^{\ast }( x,\; y) .$$
Input parameters for the simulations are defocus, sample tilt angle, the total thickness of the ferromagnetic layers, and the saturation magnetization. In Figure 5, the defocus was varied and the other parameters were, respectively, 20°, 6 nm (based on calibrated deposition rates), and 0.92 T (based on bulk magnetic measurements).


 Open access