


Introduction
Electron tomography is a widely used tool in biological and physical science and engineering due to its ability to reveal the three-dimensional (3D) structure of inhomogeneous specimens at nanometer length scales (Weyland & Midgley, Reference Weyland and Midgley2016). Tomography provides valuable information unavailable in conventional two-dimensional (2D) imaging by resolving structures that are ambiguous in projection and allowing quantitative measurement of intrinsically 3D geometric properties, such as surface area and volume. A 3D tomogram is produced by combining the information in a series of 2D projection images taken at different specimen tilts, where, conceptually, each image contributes information to fill a corresponding 2D plane in the 3D Fourier transform of the specimen. Ideally, the specimen would be imaged over a complete 180° rotation to provide knowledge of the specimen covering all of Fourier space. In practice, however, a complete rotation cannot be achieved with conventional specimen holders in a (scanning) transmission electron microscope [(S)TEM], as the sides of the holder or grid obscure the sample at high tilts (above about ±75° for commercial electron tomography holders currently available). The lack of images at high tilts leaves a “missing wedge” of unsampled information in Fourier space. The missing wedge degrades reconstruction quality by introducing blurring along the optic axis and shadow artifacts in the perpendicular direction in the reconstructed plane (e.g., Mastronarde, Reference Mastronarde1997; Midgley & Weyland, Reference Midgley and Weyland2003). These artifacts reduce the 3D imaging resolution, introduce spurious intensity variations, and distort apparent shapes in the tomogram. In complex, real-world structures this makes qualitative interpretation challenging and compromises the accuracy of segmentation and quantitative analysis.
Multiple methods have been developed to mitigate or solve the missing wedge problem, from algorithms that reduce artifacts to milling needle-shaped samples for imaging over a complete angular range. Recently developed reconstruction algorithms, such as discrete tomography (Batenburg et al., 2009) and compressive sensing tomography (Saghi et al., 2011; Goris et al., 2012; Leary et al., 2013), have shown some ability to reduce artifacts caused by the missing wedge. These algorithms are based on assumed prior knowledge of the specimen, which provides a means to make an informed guess at the missing information. However, the assumptions embedded in each algorithm and its reconstruction parameters are not universally applicable and the reconstruction will thus depend on subjective choices made by the user. Furthermore, these advanced algorithms remain poorly understood in terms of possible artifacts and failure conditions (Jiang et al., Reference Jiang, Hovden, Muller and Elser2014). Thus, these algorithms warrant caution and further study, and should not be considered a replacement for more complete experimental data.
Experimentally, partial reduction of the missing wedge has been demonstrated with specialized tilting schemes (Dahmen et al., Reference Dahmen, Trampert and Jonge2017) including dual axis tomography (Mastronarde, Reference Mastronarde1997; Arslan et al., Reference Arslan, Tong and Midgley2006), which reduces the missing wedge to a missing pyramid, and conical tomography (Lanzavecchia et al., Reference Lanzavecchia, Cantele, Bellon, Zampighi, Kreman, Wright and Zampighi2005), which reduces it to a missing cone. Unfortunately, these tilting schemes add to the complexity, duration, and radiation dose of tomography experiments and complicate the process of image alignment and reconstruction. Whenever possible, imaging the specimen over a full 180° rotation is preferable to these approaches as it eliminates the missing wedge without significantly increasing the complexity of the tomography experiment.
Full-range electron tomography has been accomplished using micropipette specimens (Barnard et al., Reference Barnard, Turner, Frank and McEwen1992), half-grid specimens (Kawase et al., Reference Kawase, Kato, Nishioka and Jinnai2007; Ito et al., Reference Ito, Matsuwaki, Otsuka, Katagiri, Kato, Matsubara, Aoyama and Jinnai2010, Reference Ito, Matsuwaki, Otsuka, Hatta, Hayakawa, Matsutani, Tada and Jinnai2011) in custom-built holders or in commercial on-axis and micro-pillar tomography holders (Biermans et al., Reference Biermans, Molina, Batenburg, Bals and Van Tendeloo2010; Ke et al., Reference Ke, Bals, Cott, Hantschel, Bender and Van Tendeloo2010; Saghi et al., Reference Saghi, Divitini, Winter, Leary, Spiecker, Ducati and Midgley2016; Andrzejczuk et al., Reference Andrzejczuk, Roguska, Pisarek, Hołdyński, Lewandowska and Kurzydłowski2017; Wang et al., Reference Wang, Shah, Palmquist and Grandfield2017), available from vendors including Fischione, Hitachi, and Mel-Build. Glass or carbon micropipettes can be effective containers for biological specimens where a large field of view (microns or hundreds of nanometers) is desired (Barnard et al., Reference Barnard, Turner, Frank and McEwen1992; Palmer & Löwe, Reference Palmer and Löwe2014). Most full-range tomography experiments for materials have been accomplished by using a focused ion beam (FIB) to extract and mill the specimen into a needle geometry (Hernández-Saz et al., Reference Hernández-Saz, Herrera and Molina2014). This is ideal for bulk or interface specimens where FIB lift-out and thinning is a routine approach to sample preparation. Unfortunately, these methods are poorly suited to an important class of nanomaterials studied via electron tomography: fine powders, such as catalyst particles. Such materials are important for a wide variety of applications—including chemical processing and energy conversion and storage—and the details of their 3D nanostructure are often critical in determining materials properties. While micropipettes can be used to contain particulate specimens for electron tomography, their large size and thickness is incompatible with the high resolution often needed for nanomaterials. Fine powders could, in principle, be prepared by FIB milling if they can be embedded without changing their structure, although even then FIB preparation is slow, expensive, and risks damage to specimens and thus should be avoided if possible. Some full rotation tomography specimens have been prepared by collecting powders on a metal point or micro-pillar sharpened by FIB milling (Jarausch & Leonard, Reference Jarausch and Leonard2007; Ito et al., Reference Ito, Matsuwaki, Otsuka, Katagiri, Kato, Matsubara, Aoyama and Jinnai2010; Jinnai et al., Reference Jinnai, Spontak and Nishi2010), however these specimens typically extend unobstructed only a short distance beyond the non-electron-transparent support, providing a very limited field of view for tomography. Good clearance from a metal point can be achieved in tomography of elongated materials such as carbon nanotubes (Kizuka et al., Reference Kizuka, Sumi, Bansho and Saito2001). The objective of this work is to apply the clearance provided by nanotubes and nanofibers to enable practical preparation of full-range tomography specimens for a variety of fine powder material samples.
Here we present a new sample preparation method for full-range tomography using carbon nanofibers (CNF) as a one-dimensional (1D) sample support to provide an unobstructed view of the sample through a complete rotation, as illustrated in Figure 1. This approach is suitable for a variety of materials such as nanoparticles, nanostructured microparticles, and nanofibers. This simple, bench-top procedure requires no special equipment beyond a full rotation tomography holder and allows for high-quality tomography reconstructions without the missing wedge. The method can be adapted to any type of on-axis or micro-pillar holder. We demonstrate this technique for two technologically relevant nanoparticle specimens: (1) a Pt/CNF fuel cell catalyst in which the CNF structure and spatial relationship to Pt is of interest and (2) a gold-decorated strontium titanate (SrTiO3 or STO) nanoparticle photocatalyst in which the carbon fiber is used as an ignorable specimen support.
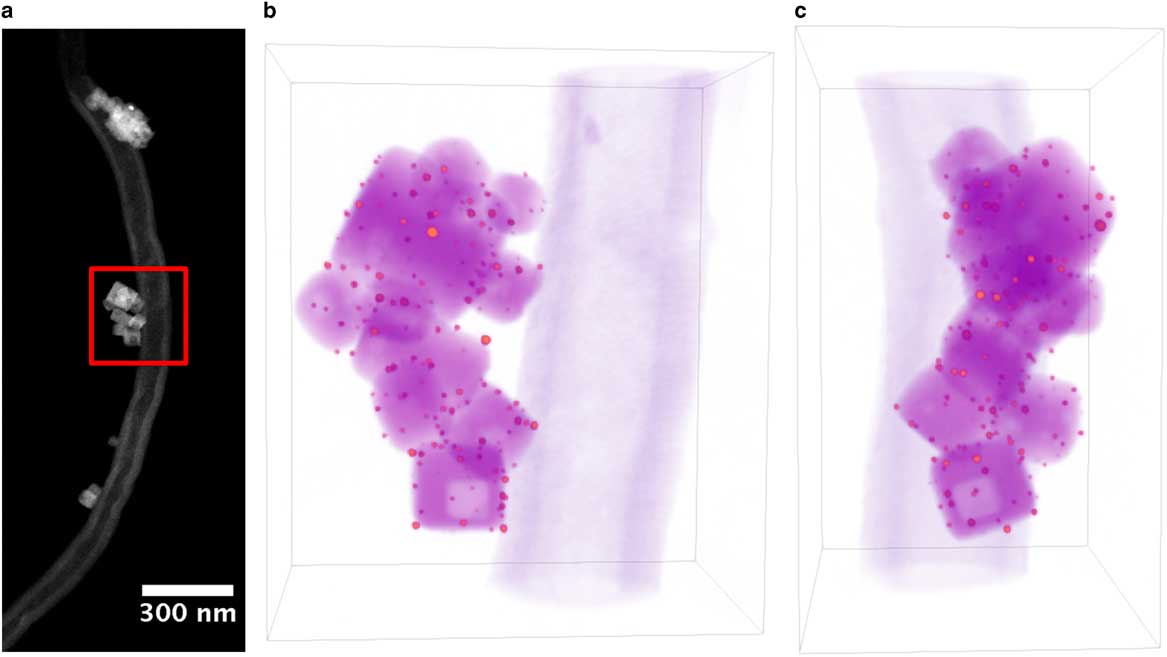
Figure 1 a: Annular-dark-field scanning transmission electron microscope image of Au/strontium titanate (STO) particle supported on carbon nanofiber for full-range electron tomography. Red square indicates region selected for tomography reconstruction. b,c: Volume rendering of Au/STO tomogram, where orange indicates Au particles, magenta indicates STO, and purple indicates the carbon fiber. Dimensions of rendered volume are 280×192×327 nm.
Materials and Experimental Methods
General Sample Preparation Approach
Samples for this investigation were supported on carbon nanofibers that adhere to the tip of a tungsten needle, which was loaded into an on-axis TEM holder (Fig. 2). Carbon nanofibers were collected on the needle by dipping the needle tip in a suspension of nanofibers in alcohol, which may also contain a small concentration of binder. Subsequently, particle samples may be loaded onto the nanofibers by dipping the needle tip again in a suspension containing the sample. A brief, step-by-step summary of the procedure is provided in the Appendix for practical reference.
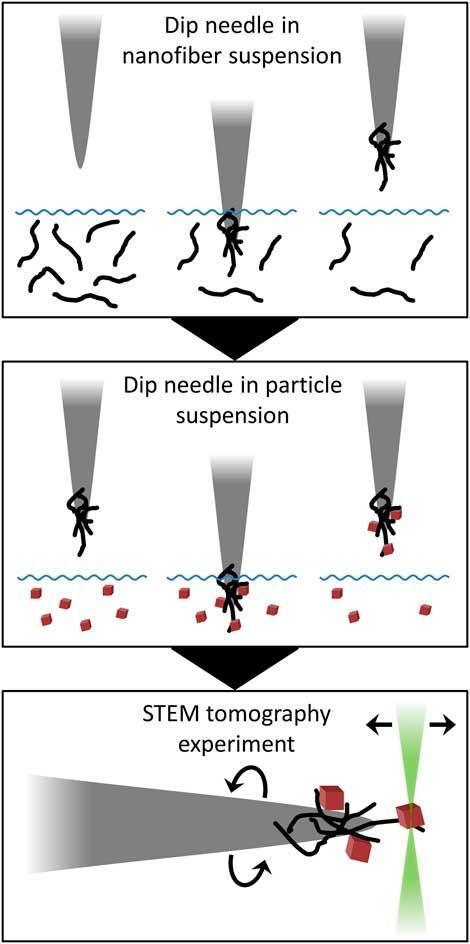
Figure 2 Schematic cartoon of sample preparation method. First, a tungsten needle is dipped in a suspension of nanofibers in order to collect fibers on the needle tip. To prepare a general nanoparticle sample, the needle is then dipped in a nanoparticle suspension to collect particles on the nanofiber support. Sample is loaded into an on-axis tomography holder for the tomography experiment in the scanning transmission electron microscope (STEM).
In an ideal sample, a single nanofiber extends beyond the tip of the needle and other nanofibers that have been collected. It is convenient for the fiber to be oriented roughly parallel to the needle axis, although angles over 45° can be acceptable. The general arrangement of nanofibers on the needle tip can be observed in a visible light microscope (VLM), most easily in dark-field mode (Figs. 3b–3e). A VLM is useful for preliminary screening and guidance during the sample preparation, as the needle can be re-dipped until a suitable quantity and arrangement of fibers is achieved. Each sample takes only a few minutes to prepare, so it is convenient to prepare 5–10 samples that appear acceptable in VLM screening before proceeding to screen samples in the (S)TEM, so that at least one sample that is suitable for tomography is produced.
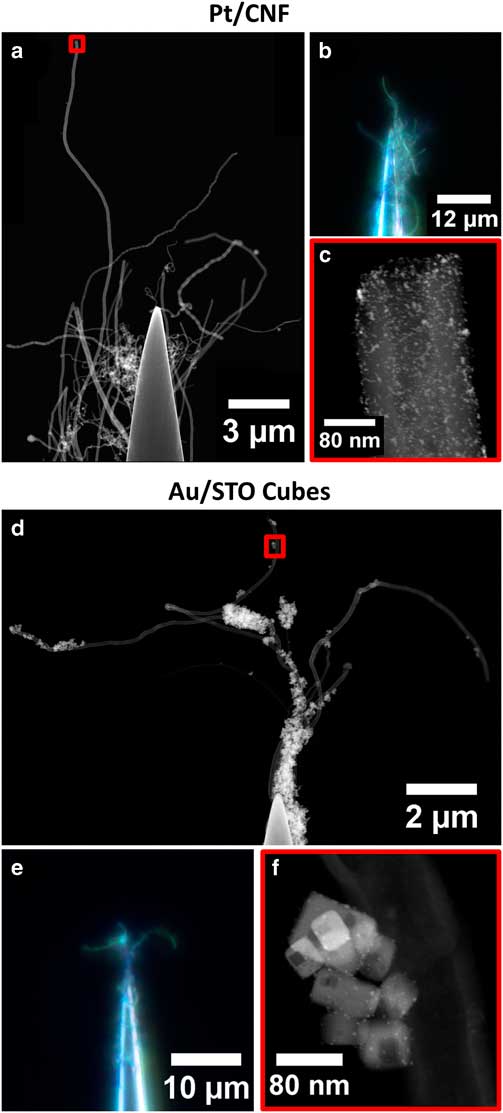
Figure 3 Images of Pt/CNF (a–c) and Au/STO titanate (d–f) specimens as prepared by needle-dip method. Large-scale sample structure is shown in scanning transmission electron microscope (STEM) stitched composite images (a,d) and in dark field visible light microscope images with extended depth of field (b,e). Areas selected for tomography are shown in STEM images (c,f) from regions highlighted in red boxes in (a,d). Composites made with Fiji Pairwise Stitching Plugin (Preibisch et al., Reference Preibisch, Saalfeld and Tomancak2009).
In this investigation, we used Omniprobe Autoprobe-250 tungsten needles (Oxford Instruments, Abingdon, UK) which we cleaned in batches by cathodic etching in an argon plasma using a Bal-Tec SCD 050 sputter coater (Bal-Tec A.G., Balzers, Liechtenstein). We have observed that without cleaning, the needle tips may bend or curl upon contacting a liquid surface. Cleaning either with a 25% oxygen 75% argon plasma or with cathodic etching in an argon plasma was found to be effective. Nanoparticle and nanofiber suspensions were dispersed using a bath ultrasonicator, and pipetted into a shallow ceramic multiwelled plate for the dipping procedure. Samples were screened using an Olympus BH-2 VLM (Olympus Corporation, Tokyo, Japan) with an Infinity 2 camera at 500× magnification. Visible light images shown in Figures 3b and 3e were given a simple extended-depth-of-field enhancement by summing three images at different specimen heights.
Preparation of a Simple Nanofiber Sample: Pt/CNF
Our first example of this preparation is a commercial fuel cell catalyst consisting of platinum nanoparticles chemically synthesized on carbon nanofibers, Pt/CNF. 3D tomographic images of this material are useful for measuring properties such as the distribution of Pt nanoparticle sizes, shapes, and locations on the carbon. The platinum nanoparticles are supported on the carbon fibers in the as-synthesized material, rather than being loaded on during sample preparation. This simplifies the sample preparation procedure. The Pt/CNF powder was dispersed in methanol at a concentration of ~0.5 mg/mL, and collected onto the needle tip in a single dipping step. No binding agent was added, as the sample interaction with the tungsten needle was sufficiently strong for fibers to adhere and remain on the needle. Tomography data for the Pt/CNF sample is available in a separate open data publication (Levin et al., Reference Levin, Padgett, Chen, Scott, Xu, Theis, Jiang, Yang, Ophus, Zhang, Ha, Wang, Yu, Abruña, Robinson, Ercius, Kourkoutis, Miao, Muller and Hovden2016).
Generalized Preparation of a Particle Sample: Au/STO
This preparation procedure can be extended to many types of nanoparticles and nanostructures by collecting the sample on carbon nanofibers which are adhered to the needle tip. To demonstrate the more general procedure, we prepared a nanostructured water-splitting photocatalyst consisting of gold nanoparticles chemically deposited on cubic STO particles, referred to here as Au/STO. 3D tomographic images of this material are useful for measuring properties such as the faceting and pore structure of the STO and the sizes and spatial distribution of the Au particles. In this case, carbon nanofibers purchased from US Research Nanomaterials (Research Grade Large Inner Diameter Thin Multi-Wall Carbon Nanotubes, id: US4440) were used as a specimen support. These fibers have a nominal outer diameter of 30–60 nm and inner diameter of 20–50 nm. Several other types of carbon nanotubes and nanofibers were investigated, but did not meet all the criteria needed for this application, including sufficiently small size for acceptable suspension, tubes/fibers which are straight enough to encourage fibers to extend well beyond the needle tip, and thin enough fibers or tube walls to maintain a low background signal during tomography data acquisition.
The interaction between the carbon fibers and tungsten needle was found to be relatively weak, causing the fibers to commonly fall from the needle tip within minutes of preparation. This problem was corrected by suspending the nanofibers at 0.5 mg/mL in a solution containing a small concentration of Nafion polymer, made by diluting Nafion 1100EW (Sigma-Aldrich, St. Louis, MO, USA) to 0.02 wt% Nafion in ethanol. This bound the fibers to the needle for the remaining preparation steps and tomography experiment, with no contamination observed during tomography. In our experience, with the added Nafion binder, the fibers remain on the needle for at least several weeks after successful sample preparation. In some cases, solvated binder alone may be insufficient to adhere fibers to the tungsten needle. In these cases, priming the needle surface by dipping in M-Bond and then in a dry carbon nanofiber powder before curing can promote adhesion. Needle tips were then dipped in a nanoparticle suspension at 0.5 mg/mL concentration for 5–10 s to collect nanoparticles on the fibers.
STEM Imaging and Tomography
For STEM experiments, samples were loaded in a Fischione Instruments Model 2050 on-axis tomography holder (E.A. Fischione Instruments, Inc., Export, PA, USA) with a custom-designed collet (made by Fischione) for compatibility with 0.508-mm diameter Omniprobe Tungsten Probe Tips. Samples were cleaned with 5% oxygen, 95% argon plasma for 45 s in a Fischione Model 1020 plasma cleaner with a shielded specimen holder port. STEM imaging and tomography was performed in an FEI Tecnai F20 (FEI Company, Hillsboro, OR, USA) with a Schottky field emission gun and a 200 kV accelerating voltage. A convergence angle of ~6.9 mrad was used to provide sub-nanometer resolution over a large depth of field. The image signal was collected on an annular-dark field (ADF) detector with a camera length of 300 mm for the Pt/CNF sample, and 200 mm for the Au/STO sample.
To reduce distortions in STEM images introduced by sample drift and scan noise, at each tilt in the tomography experiments we acquired a series of fast-scan images with 1–2 s/frame and 16 s total acquisition. After data acquisition each image series was aligned by cross-correlation and summed to produce a high signal-to-noise ratio image at each tilt, averaging out scan noise and limiting distortions to around 1–2 pixels. Images were taken with 1,024×1,024 pixels per frame and a 0.36 nm pixel size.
Because our stage goniometer is unable to tilt through a complete 180° range, the full-range tilt series must be acquired in two parts, with an internal rotation by the tomography holder in between. We acquired each full-range tomography tilt series by recording a half-series tilting with the microscope goniometer from approximately −45° to +45° in 1° or 2° steps, then incrementing the sample tilt by ~90°, using the holder’s internal manual rotation, and then recording a second half series. The holder’s manual rotation was found to be imprecise, so additional images were recorded at each end of each half series, to ensure full coverage of the angular range. For Pt/CNF, images were recorded at 1° intervals from −46° to +47° at the first holder position, and −47° to +48° at the second. For Au/STO, images were recorded at 2° intervals from −54° to +54° at the first holder position and −54° to +54° at the second.
Images in each tilt series were aligned to a common coordinate system then shifted and rotated to center the axis of rotation. For Au/STO, the image alignment was done manually using a gold nanoparticle in the sample as a fiducial marker. For Pt/CNF, the images were aligned along the tilt axis using cross-correlation of the 1D image signal projected onto the tilt axis, then aligned perpendicular to the tilt axis using the image center of mass. A shear operation was then applied to correct a ~1% nonorthogonality in the image scan directions. Shear and rotation operations used linear interpolation. The shear correction magnitude and the precise angular offset between the half series in each data set were determined by minimizing visually apparent artifacts in the reconstruction. Prior to tomography reconstruction, images were binned by two, resulting in a 0.71-nm pixel size. Tomograms were reconstructed using the weighted back-projection (WBP) algorithm, implemented using the iradon function in Matlab. 3D visualizations were rendered using the open-source tomography platform tomviz. Surface curvature calculations were done in Matlab using the Patch Curvature and Smooth Triangulated Mesh packages (Kroon, Reference Kroon2014, Reference Kroon2010) by Dirk-Jan Kroon.
Results and Discussion
The composite STEM images in Figure 3 show large areas of each sample that are suitable for tomography. The outermost extent of unobstructed fiber contains several microns of material in the Pt/CNF sample, and multiple complete specimen agglomerates in the Au/STO sample. This provides the opportunity to choose the region of interest for tomography or include a larger area to improve statistical sampling in quantitative studies.
Tomograms for Pt/CNF and Au/STO are presented in Figures 4 and 5, respectively, with 3D volume renderings shown alongside tomogram cross-sections from across the volume to demonstrate the consistent, high quality of the reconstruction. In each tomogram, the small metal nanoparticles are well resolved and round in appearance, showing no elongation due to the missing wedge or artifacts caused by motion of the nanoparticles. This suggests that the carbon nanofiber supports are mechanically stable and robust to beam-induced damage. Occasionally fibers in the samples have insufficient mechanical connection to the tungsten needle and exhibit high frequency vibration during imaging. However, this problem is easily recognized during sample screening in the (S)TEM, as the vibrations prevent formation of an acceptable image. Some mild streak artifacts are visible around the metal nanoparticles, likely due to diffraction or channeling contrast from high-density metals, although these do not interfere with either qualitative interpretation or quantitative analysis of the tomograms.
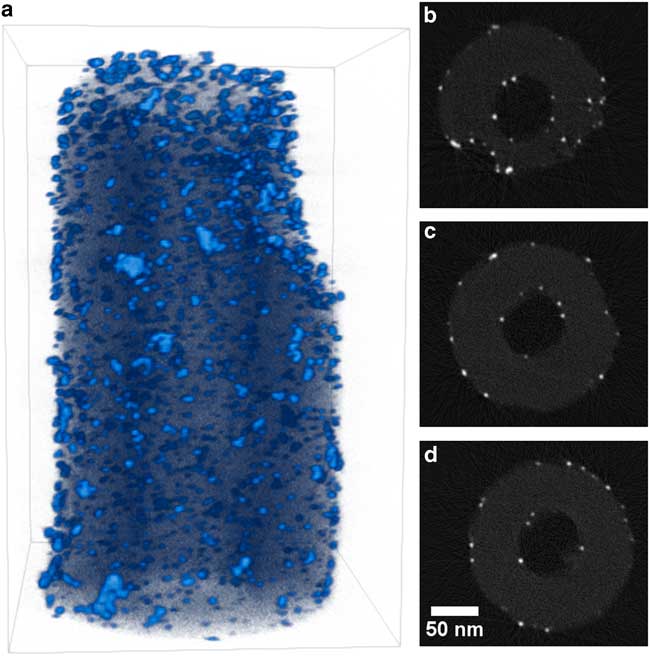
Figure 4 Visualization of Pt/CNF reconstruction. a: Three-dimensional volume rendering with light blue indicating high intensity (platinum) and dark blue–black indicating low intensity (carbon). b–d: Two-dimensional slices through reconstruction that are perpendicular to specimen tilt axis selected from the top, middle, and bottom of the reconstruction. Slices are shown with 0.85 gamma correction and full intensity range. Dimensions of rendered volume are 251×216×337 nm.
Figure 5 shows no evidence of problems caused by the presence of the Nafion binder in the Au/STO sample. Nafion was observed in the sample primarily at points of contact between carbon nanofiber supports, but not coating the sample particles or wide areas of the nanofibers. Thus, despite the sensitivity of Nafion to the electron beam, no instability of the nanofiber support structure occurred during the tomography experiment. Furthermore, no accumulation of carbon contamination was observed, indicating that the Nafion was not mobile.
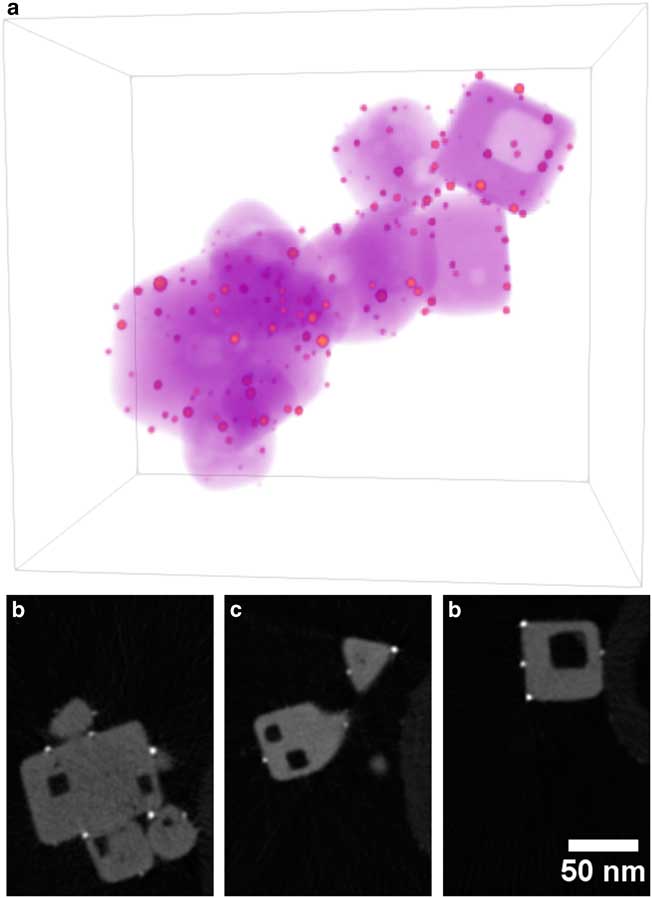
Figure 5 Visualization of Au/STO reconstruction. a: Three-dimensional volume rendering with orange indicating high intensity (gold nanoparticles) and purple indicating low intensity (STO). b–d: Two-dimensional slices through reconstruction that are perpendicular to specimen tilt axis selected from the left, middle, and right of the reconstruction. Noise was reduced using a 1.25 pixel radius Gaussian blur. Dimensions of rendered volume are 158×203×215 nm.
Eliminating the missing wedge significantly improves quantitative analysis of electron tomograms, as discussed in previous works (including Kawase et al., Reference Kawase, Kato, Nishioka and Jinnai2007; Biermans et al., Reference Biermans, Molina, Batenburg, Bals and Van Tendeloo2010). Here we will focus on the segmentation of materials in a tomogram, as this is an essential prerequisite for quantitative analysis. When possible, it is preferable to segment tomograms automatically rather than manually, as this removes a large amount of subjective judgment and improves the efficiency of analysis to provide better throughput and statistical sampling. The simplest automatic segmentation approach is to separate materials based on intensity thresholds, chosen either manually or with an algorithm such as Otsu’s method. This is particularly well suited to ADF STEM tomography, which provides atomic-number sensitivity. Accurate threshold segmentation requires that the histogram have distinct, well-separated peaks for each material of interest, and overlaps between the peaks will result in categorization errors for some voxels.
We illustrate the impact of the missing wedge on segmentation for the Au/STO tomogram in Figure 6. For this tomogram, we seek to identify three distinct materials: Au, STO, and background (including both void and carbon fiber support). We proceed by first separating all specimen material (Au and STO) from the background, and then distinguishing between Au and STO. Before segmentation, a 1.5 pixel Gaussian blur is applied to reduce the impact of Poisson noise. This noise reduction narrows the three peaks in the histogram.
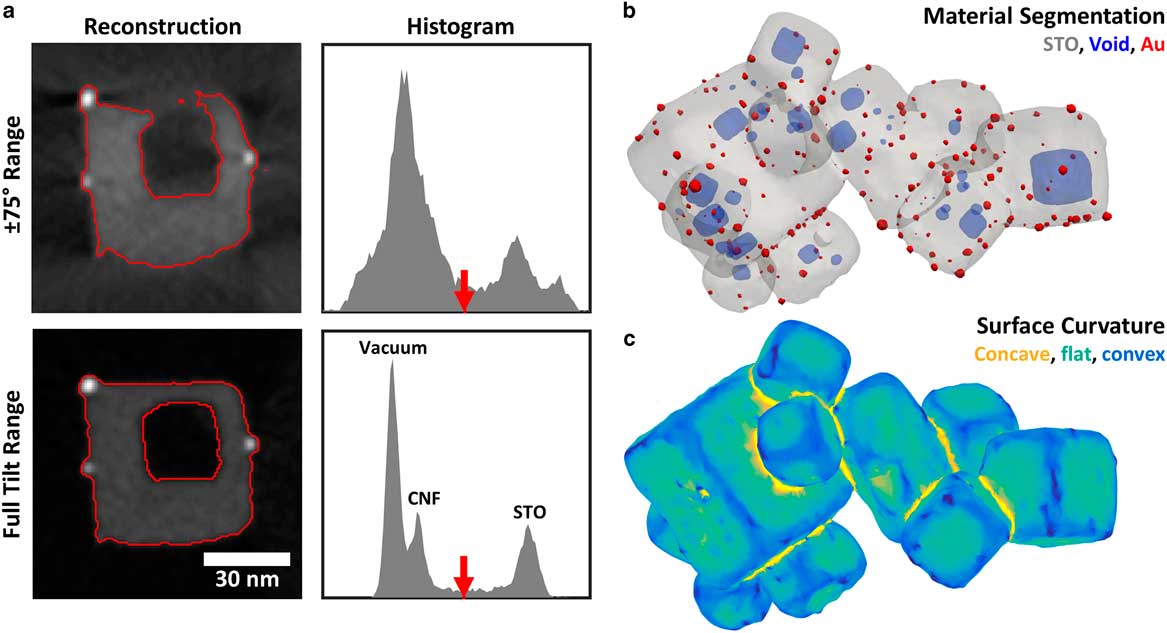
Figure 6 a: Comparison of Au/STO tomogram cross-sections and intensity histograms for ±75° tilt range and full tilt range. Red lines show the result of automatic threshold segmentation to separate the Au/STO sample from the background void and carbon fiber support. The threshold, chosen using Otsu’s method, is indicated with the red arrow in each intensity histogram. Histograms cover the same intensity range for each tomogram. b: Three-dimensional (3D) surface rendering of full-range tomogram segmented by threshold and morphological filtering, showing Au particles, STO, and internal voids. c: 3D rendering of STO surface in full-range tomogram with color indicating local mean curvature, separating curved convex (blue) and concave (yellow) regions from flat facets (green).
Missing wedge artifacts introduce spurious intensity variations that impair the accuracy of threshold segmentation, as illustrated in Figure 6a. In the Au/STO tomogram reconstructed with a ±75° tilt range (considered a good range for conventional electron tomography), the background and STO peaks are broad and overlapping, precluding accurate segmentation. The consequence is a mischaracterization of the specimen structure: edges are distorted so that flat faces appear curved and the STO wall separating the interior void is not resolved. These effects are especially severe for edges oriented in the direction of the missing wedge because essential information in that direction is missing in Fourier space. Furthermore, shadow artifacts that appear adjacent to highly scattering objects, such as the Au particles, could be mistaken as voids. For the full range tomogram, peaks for each material are relatively sharp and the STO peak is well separated from the background so segmentation will be accurate and robust to the choice of threshold. Peaks for the vacuum and weakly scattering carbon are also resolved. The resulting segmentation accurately captures the structure of the Au/STO particle, including the surface geometry and void connectivity.
Although the Au particles occupy too few voxels to appear as a distinct peak in the histogram, they have much higher intensity than the STO and are easily selected by a threshold. However, because STO falls at an intermediate intensity, “bubbles” of blurred intensity around the bright Au particles will be selected by the STO thresholds, and must be removed. One approach to correct this is the application of morphological filters to the binarized volumes. Using a 3.5-nm diameter spherical structure element, we applied a morphological close operation on the combined Au+STO component, followed by a morphological open on the STO component. This removes the “bubble” artifact around the Au particles, as well as some noise in binarized volumes. A 3D rendering of the resulting segmentation, shown in Figure 6b, demonstrates clean separation of the materials and accurate representation of the specimen morphology and void structure across the tomogram.
The undistorted results of segmentation for full-range tomography enable accurate quantification of a wide variety of structural properties relevant to powder samples. For instance, surface geometry plays a central role in the performance of catalytic nanomaterials, as different facets and step edges provide different catalytic activity. Electron tomography has been used for quantitative analysis of surface geometry in heterogeneous catalysts and other nanomaterials (Jinnai et al., Reference Jinnai, Nishikawa, Spontak, Smith, Agard and Hashimoto2000; Ward et al., Reference Ward, Yates, Fernández, Vaughan and Midgley2007). While missing wedge artifacts in conventional electron tomography introduce significant distortions in the apparent surface geometry, full-range tomography allows the surface of a powder specimen to be more accurately identified and analyzed. To illustrate, we calculated the mean curvature of the STO surface in the Au/STO tomogram (Fig. 6c). An isosurface mesh was extracted from the segmented STO component, and then down-sampled and smoothed to remove artifacts due to the discrete voxels of the segmented volume. For each vertex, the local curvature was calculated using a least-squares fit to the neighboring vertices, up to third-nearest neighbors (Kroon, Reference Kroon2014). Figure 6c shows a rendering of the isosurface mesh where the color of each triangular face is determined by the average of the mean curvature values at its three vertices. This allows flat facets, convex edges, and concave surfaces at cube junctions to be easily recognized and quantified, providing a route to connect the surface geometry to the chemical properties of the specimen.
Conclusions
Full-range electron tomography provides superior 3D reconstructions for quantitative analysis when compared to conventional electron tomography, which suffers distortions introduced by the missing wedge. Sample preparation methods that have been previously demonstrated for full-range tomography are poorly suited to nanostructured powder specimens, which are commonly studied with electron tomography. In this work, we present a new sample preparation technique for full-range tomography, where particles are collected on carbon nanofibers, which act as weakly scattering supports that extend well beyond the end of a tungsten needle. The demonstrated procedure is simple and produces samples compatible with commercial on-axis tomography holders using inexpensive consumables and equipment commonly available in sample preparation labs. This approach allows the creation of high-quality tomograms, as we have demonstrated for Pt/CNF fuel cell catalyst and Au/STO photocatalyst specimens using the simple, well-understood WBP algorithm. Full-range tomography enables accurate automatic segmentation and quantitative analysis. The sample preparation approach presented in this work could enable full-range electron tomography across a variety of samples that can be dispersed in liquid to provide accurate, quantitative analysis of their 3D nanostructure.
Acknowledgments
This work was funded by Department of Energy SBIR grant DE-SC0011385. E.P. acknowledges support from a NSF Graduate Research Fellowship (DGE-1650441). J.C.D. acknowledges support from CAPES, Brazil (13159/13-5). Electron microscopy facility support from the NSF MRSEC program (DMR 1120296). The authors thank Dr. Ryo Wakabayashi, Dr. Megan Holtz, and Yi Jiang for assistance and useful discussions, and Dr. Zhongyi Liu and General Motors for providing the Pt/CNF sample.
Appendix: Specimen Preparation Procedure Summary
-
1. Clean needles with oxygen or argon plasma.
-
2. Mix fibers in ethanol and Nafion binder (as needed) and ultra-sonicate until well dispersed. Suggested concentration: 0.5 mg fibers per 1 mL ethanol, 0.02 wt% Nafion solution.
-
3. Pipette ~1 mL of fiber suspension into a shallow container, such as a ceramic multiwelled plate.
-
4. Dip needle tip in fiber suspension for a few seconds. Check for fiber collection and arrangement in visible light microscope, and repeat dipping until acceptable fiber arrangement is collected. If fibers do not adhere well to needle, needle surface may be primed by dipping in M-Bond and then in a dry carbon nanofiber powder before curing.
-
5. Repeat step (4) for several needles.
-
6. If the fibers collected are the sample of interest, skip to checking samples in TEM. If a sample will be loaded onto the fibers, proceed with step (7).
-
7. Mix sample in ethanol and ultra-sonicate until well dispersed. Suggested concentration: 0.5 mg sample per 1 mL ethanol.
-
8. Pipette ~1 mL of sample suspension into shallow container.
-
9. Dip needle tip in sample suspension for a few seconds. Check in visible light microscope—sample collected may or may not be visible, and fibers may rearrange each time they are dipped. Re-dip at your discretion. Repeat for each needle with collected fibers.
-
10. Check samples in (S)TEM until a suitable sample is found.


