Introduction
Hesperapis (Carnapis) rhodocerata (Melittidae) and Ericrocis lata (Apidae) are two distantly related nonsocial bees. H. rhodocerata has been found to nest in normally dry desert areas of North America (Rozen, Reference Rozen1987, Reference Rozen2016), whereas the cleptoparasitic bee E. lata has been reported to use the nests of ground-nesting bee hosts like Centris (Paracentris) caesalpiniae in SE Arizona (Rozen & Buchmann, Reference Rozen and Buchmann1990), close to the H. rhodocerata sites and under similar climatic conditions (Rozen, Reference Rozen2016). Although these species differ in that their larvae either spin (E. lata) or do not spin (H. rhodocerata) a protective cocoon before entering diapause, they both produce a thin transparent film that covers the integument of the postdefecating larvae (Rozen & Buchmann, Reference Rozen and Buchmann1990; Rozen, Reference Rozen2016). This material takes on the exact contour of the larval body surface and when teased with forceps, it flakes off (Rozen, Reference Rozen2016).
When one of us (J.G.R.) tested the cell wall of H. rhodocerata larvae with a water droplet, this wall was found to be readily absorbent, which is an unusual finding because solitary bees that do not spin cocoons usually provide water-retardant brood cell linings. In the particular case of these bee larvae, there was indication that the cell wall had received no special treatment to protect the diapausing larva from desiccation during its 5-year diapause.
The integument covering material was thus suspected to play some role in protecting the diapausing larvae of these bees especially in the case of absence of a protective cocoon. Considering that the composition and the structural organization of these covering films have not yet been determined, in the present study these materials were analyzed using topochemical methods, fluorescence and high-performance polarization microscopy, and infrared (IR) microspectroscopy. These procedures have recently been seen to be useful for understanding the nature and organization of several biopolymers, including silk elements in bee cocoon walls (Mello et al., Reference Mello and Vidal2016).
Materials and Methods
Insects
Mature larvae of H. rhodocerata (Cockerell) (Hymenoptera: Apoidea: Melittidae) were collected from a nesting site that was 28 miles south of Animas, Hidalgo Co., New Mexico, on September 8, 2015, by J.G.R. and B. Lawley. E. lata (Hymenoptera: Apoidea: Apidae) larvae were excavated from host bee nests on May 17, 1989, from 5 miles east of Sahuarita, Pima Co., Arizona, by J.G.R. (Rozen & Buchmann, Reference Rozen and Buchmann1990). Wax flakes were washed off mature larvae and then dried.
Topochemistry and Fluorescence Microscopy
A topochemical test for proteins was performed by treating the bee integument coverings with a 0.025% Ponceau SS (Sigma®, St Louis, MO, USA) solution in 3% acetic acid at pH 2.5 for 10 min (Vidal & Mello, Reference Mello and Vidal2005). Ponceau SS not only reveals proteins, but it also can be used to detect the organization of protein electropositive binding sites using polarization microscopy because this dye has the property of exhibiting linear dichroism, when bound to oriented substrates (Vidal & Mello, Reference Mello and Vidal2005). The periodic acid–Schiff (PAS) reaction (Lison, Reference Lison1960; Kiernan, Reference Kiernan2008) was also used, considering the possibility that glycoproteins were present in the materials under investigation. In addition, treatment with 0.025% toluidine blue (Merck, Darmstadt, Germany) solutions in 0.1 M citric acid and 0.2 M anhydrous disodium phosphate buffer at pH 4.0 and 2.5 was undertaken. Toluidine blue solutions at these pHs reveal acid glycosaminoglycans (AGAG) or protein–AGAG complexes (proteoglycans) and their stereoarrangements (Lison, Reference Lison1960; Vidal & Mello, Reference Vidal, dos Anjos and Mello1974, Reference Vidal and Mello1984; Mello & Vidal, Reference Vidal and Mello2003). Lipids were investigated using a 15-min staining with Sudan black B (Kiernan, Reference Kiernan2008).
The examination of unstained fragments of the integumental coverings by autofluorescence was performed using a Carl Zeiss Axiophot 2 photomicroscope (Carl Zeiss, Oberkochen, Germany), equipped with an HBO-mercury short-arc 103 W/2 (Osram GmbH, Berlin, Germany) as a UV source and Carl Zeiss filter sets 02 (G exciter filter transmitting a λ=365 nm exciting light, FT 395 beam splitter, and LP 420 barrier filter) and 38 HE (BP exciter filter transmitting a λ=470/40 nm exciting light, FT 495 beam splitter, and BP 525/50 barrier filter).
High-Performance Polarization Microscopy
Birefringence was investigated on unstained flakes of the integument coverings using a Carl Zeiss Axiophot 2 microscope equipped with an Axiocam HRc camera and Kontron KS400-3 software (Carl Zeiss), and an Olympus BX51 high-performance polarizing microscope (Olympus America, Center Valley, PA, USA) equipped with a Q-color 5 camera (Olympus America). Some of the birefringence images were obtained using differential interference contrast (DIC) optics (Vidal et al., Reference Vidal, Mello, Caseiro-Filho and Godo2015). Images of the birefringence intensity brilliance were captured and analyzed using Image-Pro Plus 6.3 software (Media Cybernetics Inc., Silver Spring, MD, USA), as previously described (Vidal & Mello, Reference Vidal and Mello2010). The birefringence sign was detected using a first-order red compensator (Axiophot 2 microscope) and DIC red band interference color (BX51 polarizing microscope) (Vidal & Mello, Reference Vidal and Mello2010).
Fourier Transform-Infrared (FT-IR) Microspectroscopy
FT-IR spectra were obtained from dry fragments of the larval integument coverings using an Illuminat IR II™ microspectroscope (Smiths Detection, Danbury, CT, USA) that was equipped with a liquid nitrogen-cooled mercury–cadmium–telluride detector and GRAMS/AI™ 8.0 spectroscopy software (Thermo-Electron Co., Waltham, MA, USA). An Olympus BM51 microscope (Olympus America) with an attenuated total reflection diamond objective (magnification 36×) was part of the microspectroscope equipment. A low signal-to-noise ratio of 7,929:1 indicated the performance validation of the equipment (Vidal & Mello, Reference Vidal and Mello2011).
The absorbances were evaluated within a 3,500–650 cm−1 wavenumber spectral range using a square of 25 µm per side as the measurement site area. The spectral resolution was equal to 4 cm−1 as quoted by the equipment supplier. The absorbances of the preparations and background were estimated using 64 scans for each individual spectral profile (Vidal & Mello, Reference Vidal and Mello2011). Twelve and eight spectral signatures were obtained for the cover material of H. rhodocerata and E. lata, respectively. A plus-zero baseline correction was obtained for each spectrum, followed by the production of the average spectral profiles and normalization to the highest absorption peak of the spectra (2,921 and 2,916 cm−1 for H. rhodocerata and E. lata, respectively). All these procedures were performed in accordance with the instructions provided by the GRAMS/AI software.
Results
Topochemistry, Fluorescence, and High-Performance Polarization Microscopy
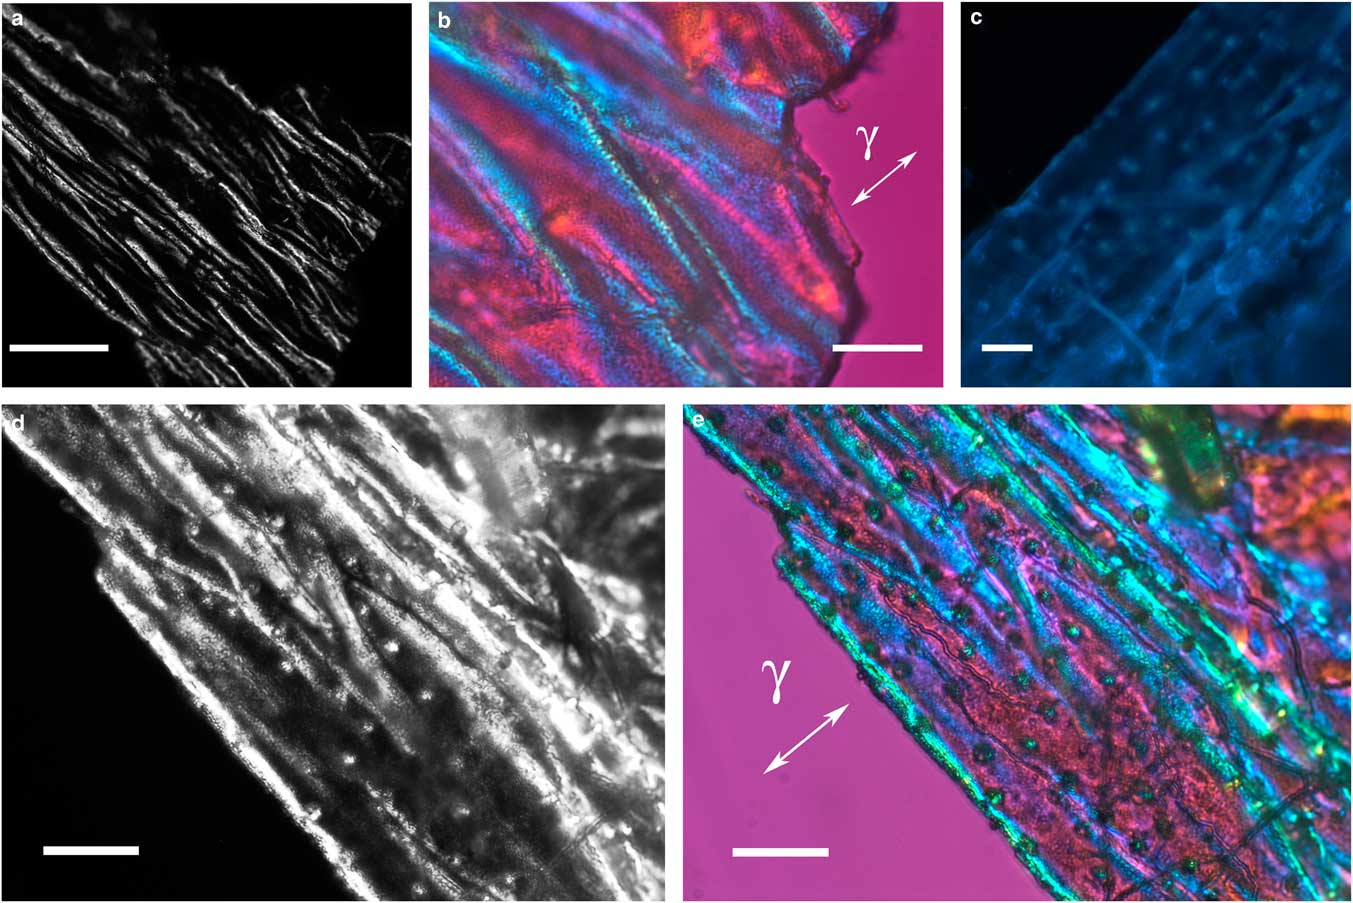
The thin, transparent, and friable flakes of the integument covering from H. rhodocerata larvae revealed a wrinkled structure that did not stain with Ponceau SS or with toluidine blue at pH 4.0 or 2.5 or with the PAS reaction, but that stained with Sudan black B and displayed blue autofluorescence (Figs. 1a–1d). In some parts of the fragments, the wrinkles obeyed a curved spatial distribution (Figs. 1a–1c, 1e), whereas in other parts the wrinkles appeared to be distributed linearly, acquiring an extended folder shape that, when examined in detail, revealed fine granular components (Figs. 2a, 2b). Circular protuberances were observed amidst the main material in some of the integument covering samples examined using fluorescence and polarization microscopy (Figs. 2c–2e). These protuberances showed an ordered spatial distribution, which suggests that they are probably imprints of pits from which setae arise. All these elements exhibited intense negative birefringence brilliance demonstrated by interference colors when they were examined with a first-order red compensator. When the long axis of the linear folders was positioned perpendicular and parallel to the γ direction of the compensator, blue and yellow colors were observed, respectively (Figs. 1e, 2b, 2e), thus revealing the negative sign of the birefringence exhibited by the flakes.
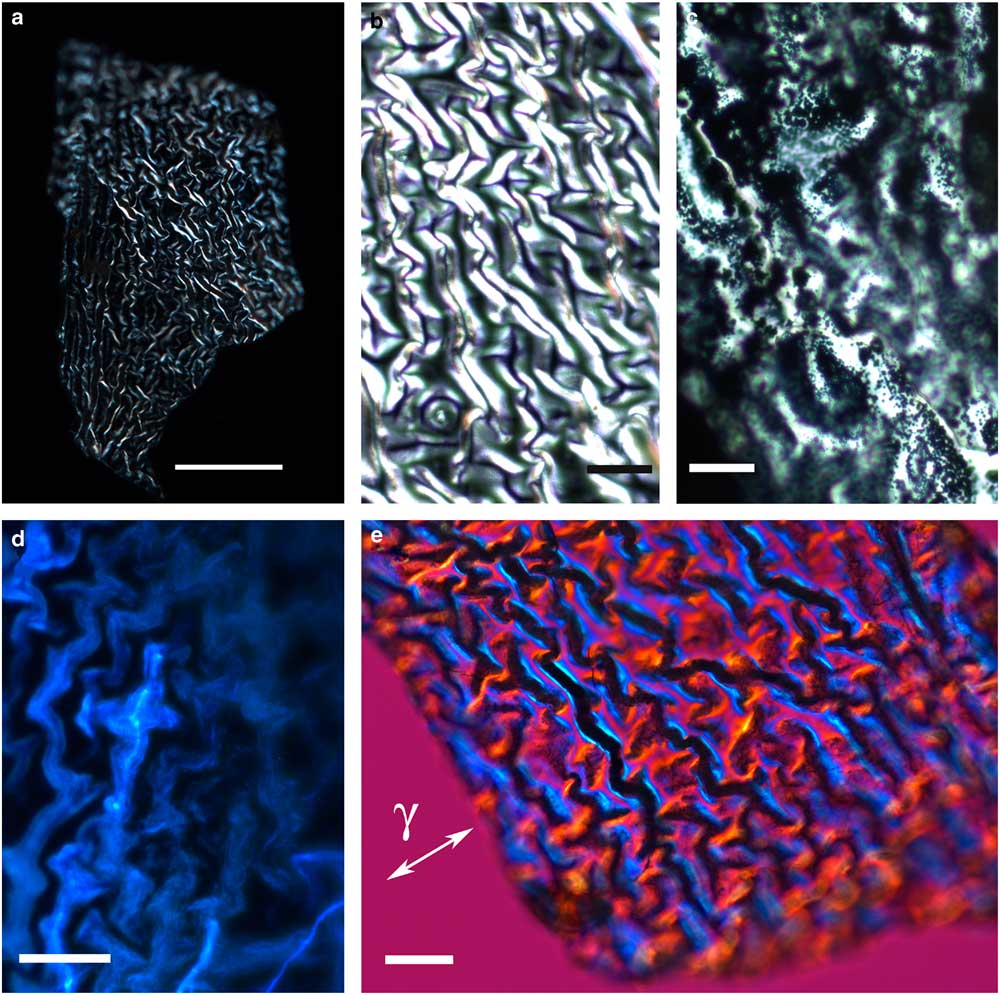
Figure 1 Images of wrinkled integument cover fragments from Hesperapis rhodocerata larvae. Unstained samples (a,b,d,e) and a Sudan black B-stained preparation (c) are observed by polarization (a,b,e), ordinary (c), and fluorescence (d) microscopy. A polarized light image using the first-order red compensator is shown (e) to demonstrate the negative birefringence sign of the oriented covering elements, which is typical of lipid-containing substances. The blue interference color of birefringence is detected when the long axis of the filamentous distribution of the film was oriented perpendicular to the gamma direction of the compensator (γ). Scale bars equal 50 µm (a) and 20 µm (b–e).

Figure 2 Images of folded integument cover fragments from Hesperapis rhodocerata larvae. Unstained preparations are observed by polarization (a,b,d,e) and fluorescence (c) microscopy. Polarized light images were obtained using the first-order red compensator to reveal the negative birefringence sign (γ) of the covering components and the details of a fine granular distribution of birefringent elements (b,e). Autofluorescence (c) and birefringence brilliance (d,e) are also verified on circular projections that appear with an ordered spatial distribution and which are attributed to the imprints of pits from which setae will arise. Scale bars equal 50 µm (a) and 20 µm (b–e).
The integument covering fragments of E. lata larvae revealed a variable spatial distribution of membranous elements, resembling a lacy structure (Figs. 3a–3e) that responded to the above-mentioned topochemical tests in the same way as H. rhodocerata samples. Mold spores, which were previously reported for the membranous structure of the larval covering of this bee species (Rozen & Buchmann, Reference Rozen and Buchmann1990), were detected in Sudan black B-stained preparations (Fig. 3c). A deep autofluorescence was revealed when using both 02 and 38 HE filter sets (Figs. 3d, 3e). Birefringence was detected in the covering flakes, highlighting the evenly distributed papillae images that correspond to places from where setae will arise (Figs. 3a, 4b, 4c). When adequately oriented with respect to the γ direction of the first-order red compensator, components of the flake fragments also exhibited negative birefringence (a blue interference color) (Fig. 4a). Examining the cover flakes using DIC optics revealed various interference colors that resulted from the varied distribution and thickness of the macromolecularly oriented material of the cover film (Figs. 4b, 4c).
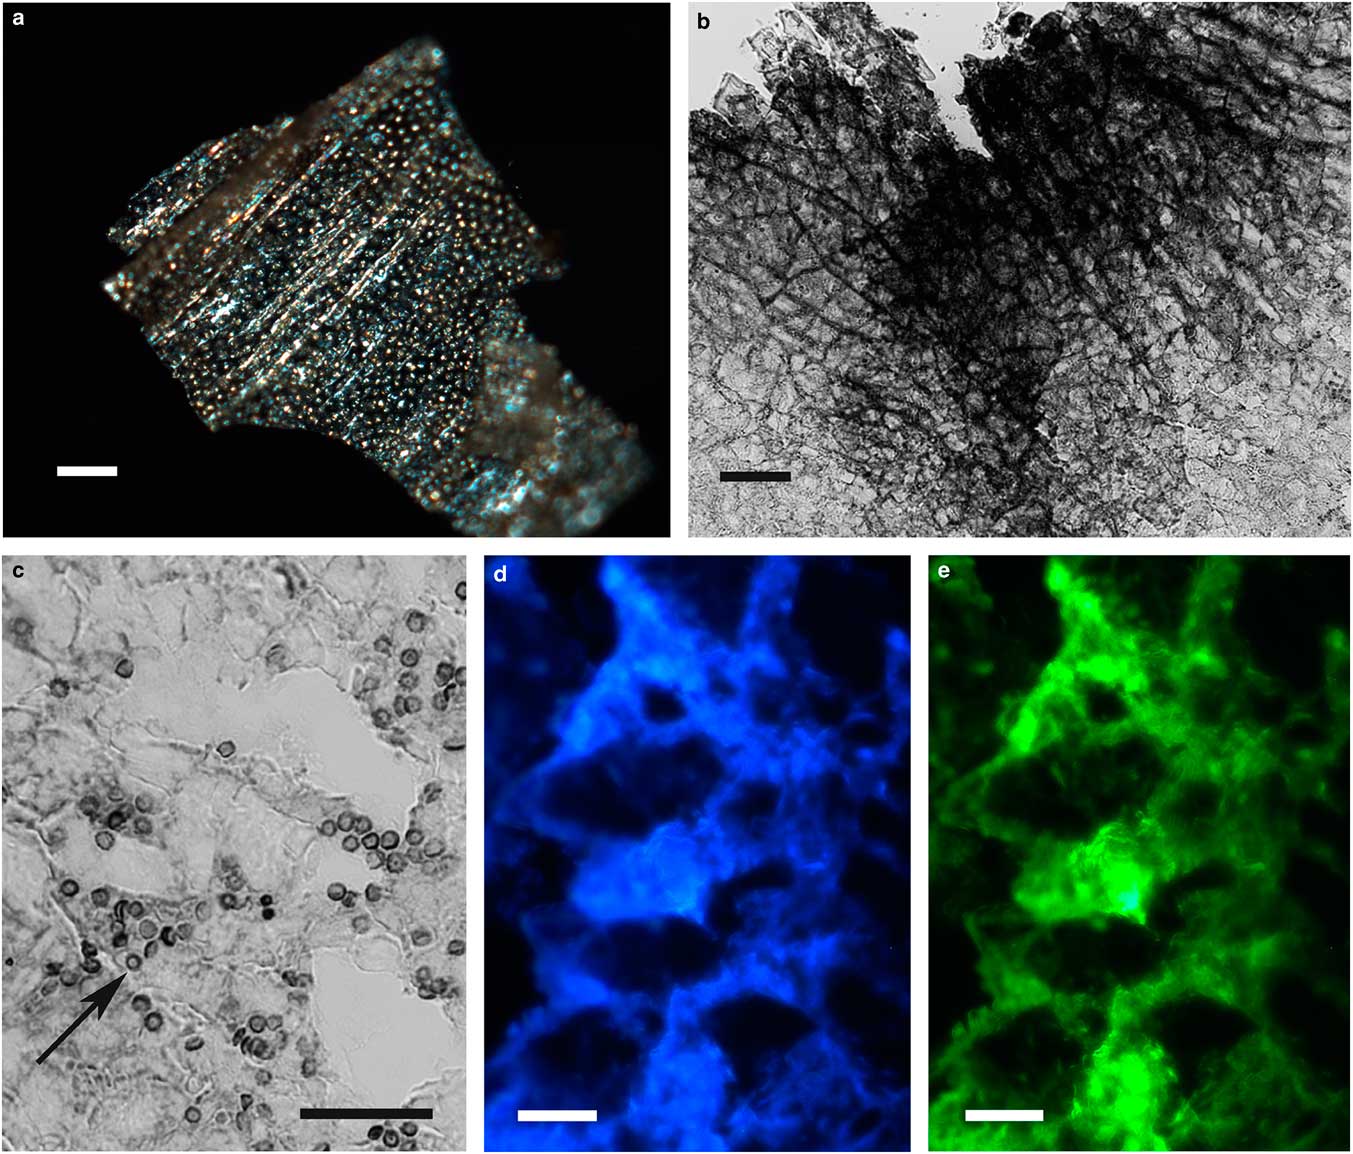
Figure 3 Images of fragments of the lacy integument cover film from Ericrocis lata larvae. Unstained preparations are observed using polarization (a) and fluorescence microscopy (d,e), and the Sudan black B-stained samples are observed by ordinary microscopy (b,c). Mold spores recovered by intense Sudan black B-positive staining are viewed amidst the cover elements (c, arrow). Scale bars equal 20 µm.
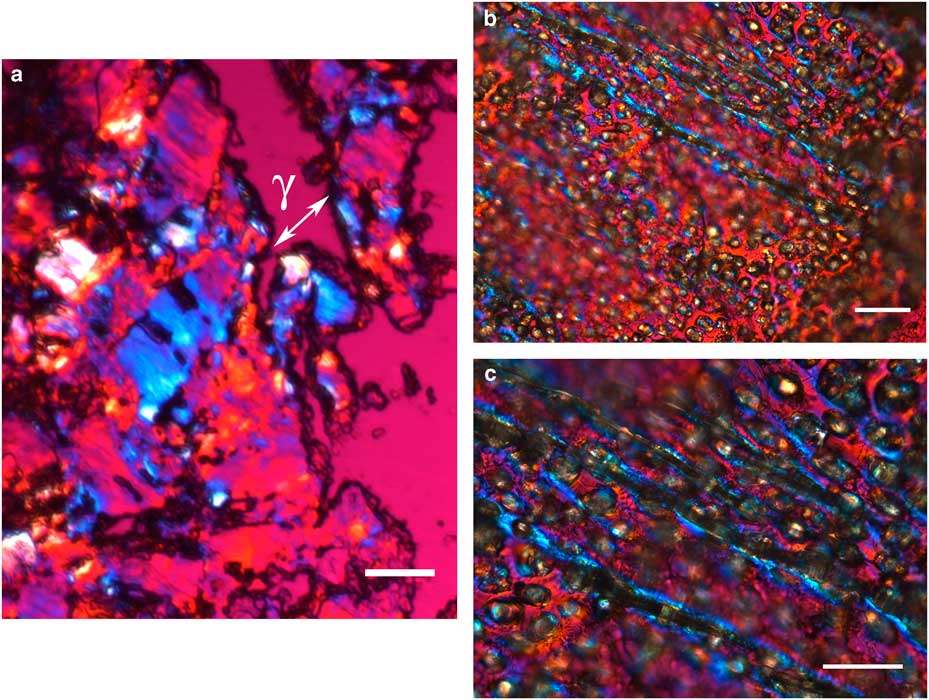
Figure 4 Polarized light images obtained for the cover film from Ericrocis lata larvae. A first-order red compensator demonstrates the negative birefringence sign typical of lipid-aligned elements (a, γ), whereas polarized light/differential interference contrast optics images against a black background not only demonstrate this interference color but also show different colors that indicate the various directional distributions and thicknesses of the birefringent materials (b,c). The ordered distribution of papillae images (b,c) probably results from the imprints of growing insect setae. Scale bars equal 20 µm.
FT-IR Microspectroscopy
The highest absorptions in the FT-IR spectra of the larval integument covering films that were obtained from both bee species were detected as sharp band peaks in the 2,921–2,916 cm−1 and 2,851–2,849 cm−1 spectral regions (Fig. 5a). These bands correspond to hydrocarbon –CH2 ν as and ν s vibrations, respectively, similar to the FT-IR spectral characteristics of the wax material used by Apis mellifera and some other social bees for building honeycomb cells (Pinzon et al., Reference Pinzon, Torres, Hoffmann and Lamprecht2013; Svecnjak et al., Reference Svecnjak, Baranovic, Vincekovic, Prdun, Bubalo and Gajger2015).
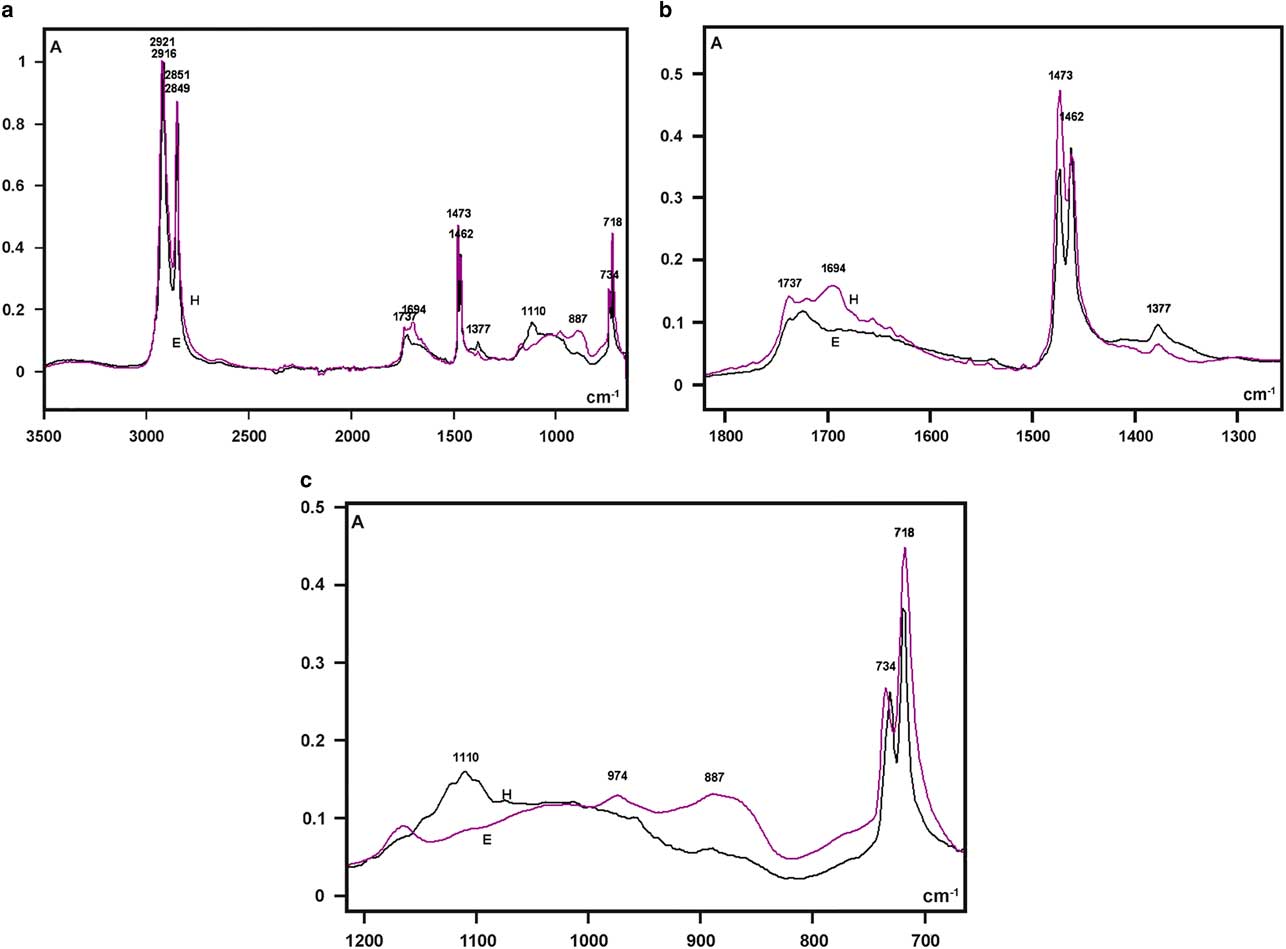
Figure 5 Fourier transform-infrared spectra of larval cover films are compared in the 3,500–700 cm−1 range (a) and detailed in the 1,800–1,300 cm−1 (b), and 1,200–700 cm−1 (c) spectral windows. A, absorbance; H, Hesperapis rhodocerata (purple line); E, Ericrocis lata (black line).
Regarding the FT-IR fingerprint spectral region, a low broad band at the 1,740–1,690 cm−1 spectral window was detected, with more elevated absorbances at ~1,694 cm−1 for H. rhodocerata and ~1,720 cm−1 for E. lata (Fig. 5b). The irregular shape of this band contrasts with the well-defined band peak exhibited by the A. mellifera wax at this spectral region (Pinzon et al., Reference Pinzon, Torres, Hoffmann and Lamprecht2013; Svecnjak et al., Reference Svecnjak, Baranovic, Vincekovic, Prdun, Bubalo and Gajger2015). However, it resembles the spectral band assigned to ester C=O stretching bands (Pavia et al., Reference Pavia, Lampman, Kriz and Vyvyan2009) and reported for the waxes of the stingless bees Plebeia sp. and Scaptotrigona sp. and the bumblebee Bombus pullatus (Pinzon et al., Reference Pinzon, Torres, Hoffmann and Lamprecht2013).
When examined in detail, a sharp band peak which appeared at the 1,480–1,460 cm−1 wavenumber region in Figure 5a, revealed two sharp components, with one at 1,473 cm−1 and another at 1,462 cm−1 (Fig. 5b). This characteristic was not reported for the wax spectra of A. mellifera and other social bees (Pinzon et al., Reference Pinzon, Torres, Hoffmann and Lamprecht2013; Svecnjak et al., Reference Svecnjak, Baranovic, Vincekovic, Prdun, Bubalo and Gajger2015), but was evident in the FT-IR spectrum of a Polish bee wax 10 min after the samples were heated to melting point temperature and quenched to room temperature (Zimnicka & Hacura, Reference Zimnicka and Hacura2006). In H. rhodocerata, the peak at 1,473 cm−1 was more prominent than that at 1,462 cm−1, and the inverse occurred for E. lata peaks (Fig. 5b). These peaks are usually associated with the hydrocarbon –CH2 during in-plane bending or scissoring (Pavia et al., Reference Pavia, Lampman, Kriz and Vyvyan2009; Svecnjak et al., Reference Svecnjak, Baranovic, Vincekovic, Prdun, Bubalo and Gajger2015).
A very low peak at 1,377 cm−1 was present in the spectral profile of both bee materials (Fig. 5b). It could be attributed to alcohol C–H symmetric flexion and/or deformation (Pinzon et al., Reference Pinzon, Torres, Hoffmann and Lamprecht2013). Low peaks at 1,110 cm−1 (H. rhodocerata, exclusively) and 887 cm−1 (E. lata, exclusively) were also detected (Fig. 5c); these peaks have been assigned to C–O stretching vibrations of ethers and alcohols (Pinzon et al., Reference Pinzon, Torres, Hoffmann and Lamprecht2013). One apparently sharp band peak which occurred in the 740–715 cm−1 spectral region in Figure 5a, was found to comprise twin sharp peaks (734 and 718 cm−1) (Fig. 5c). The peak at 718 cm−1 was higher than that at 734 cm−1 in the spectra of both bee materials (Fig. 5c). Vibrations at ~720 cm−1 are frequently assigned to the bending (rocking) motion associated with four or more –CH2 groups in an open chain (“long-chain band”) such as that of nujol (Pavia et al., Reference Pavia, Lampman, Kriz and Vyvyan2009). These vibrations have also been detected in the FT-IR spectra of A. mellifera wax (Knuutinen & Norrman, Reference Knuutinen and Norrman2000; Pinzon et al., Reference Pinzon, Torres, Hoffmann and Lamprecht2013; Svecnjak et al., Reference Svecnjak, Baranovic, Vincekovic, Prdun, Bubalo and Gajger2015).
No characteristic bands in the 3,600–3,200 cm−1 spectral range or at 1,040 cm−1 that could be attributed to O–H stretching vibrations (Pavia et al., Reference Pavia, Lampman, Kriz and Vyvyan2009) were verified in the spectral profiles of the samples from both bee species (Fig. 5a). This result resembles an observation by Pinzon et al. (Reference Pinzon, Torres, Hoffmann and Lamprecht2013) for the Africanized honeybee wax, and it differs from that reported for pure beeswax (Knuutinen & Norrman, Reference Knuutinen and Norrman2000; Zimnicka & Hacura, Reference Zimnicka and Hacura2006) and the waxes of some other social bees (Pinzon et al., Reference Pinzon, Torres, Hoffmann and Lamprecht2013).
Discussion
A lipid-based chemical composition is assumed for the integument covering films that were obtained from the diapausing larvae of both H. rhodocerata and E. lata. This conclusion is based on the positive Sudan black B staining of such films, demonstration of negative sign birefringence, and specific FT-IR spectral profiles, that are all typical of lipids. No evidence of overall proteins, glycoproteins, and AGAG or proteoglycans was found when using the Ponceau SS dye, the PAS reaction, and the toluidine blue tests, respectively. Under the same Ponceau SS staining conditions used here, proteins stain in a multitude of materials, from vertebrate collagens and noncollagenic proteins of the extracellular matrix to insect cocoon proteins (Vidal & Mello, Reference Mello and Vidal2005; Mello et al., Reference Mello and Vidal2016). Clear images of Ponceau SS-stained proteins have been recently reported in cocoons of the bee Lithurgus chrysurus (Mello et al., Reference Mello and Vidal2016). Ponceau SS is also widely used in electrophoresis studies as a dye of choice for locating polypeptides on Western blots for blot-sequencing. Regarding PAS reaction, it is a classic assay for glycoproteins (Lison, Reference Lison1960; Kiernan, Reference Kiernan2008). Toluidine blue staining usually reveals proteoglycans in extracellular matrices, mucins, bee salivary and Malpighian tubule secretions, and cocoon walls of bumblebees and solitary bees (Mello & Vidal, Reference Mello and Garófalo1971, Reference Mello and Vidal1979, 2003; Vidal & Mello, Reference Vidal, dos Anjos and Mello1974, Reference Vidal and Mello2016; Mello, Reference Mello1982; Mello & Garófalo, Reference Mello, dos Anjos, Vidal and Rozen1986; Mello et al., Reference Mello and Vidal2016).
The Sudan black B test, that provided a positive response in the integument covering films studied here, is a classic topochemical assay for lipids (Kiernan, Reference Kiernan2008).
Lipid structures with an ordered organization are characterized by negative birefringence, when studied using polarization microscopy (Schmidt, Reference Schmidt1936; Bennett, Reference Bennett1967; Vidal et al., Reference Vidal and Mello1980). This phenomenon was detected in the integument coverings of both H. rhodocerata and E. lata.
Finally, the proposal of a lipid composition for the integument coverings of H. rhodocerata and E. lata is confirmed by analyzing the FT-IR spectral signatures of these materials. FT-IR microspectroscopy is known to offer a reliable method for qualitative analysis of lipids (Pidgeon et al., Reference Pidgeon, Apostol and Markovich1989; Gibbs, Reference Gibbs1998; Zimnicka & Hacura, Reference Zimnicka and Hacura2006). FT-IR spectral profiles for proteins as assessed in several databases are different from those revealed for lipids.
The characteristic lipid bands in the IR spectra are those that are related to the aliphatic group’s symmetric and antisymmetric stretching vibrations (3,000–2,800 cm−1), the ester C=O stretching vibrations (~1,740–1,690 cm−1), the hydrocarbon –CH2 in-plane bending or scissoring (1,480–1,460 cm−1), the alcohol C–H symmetric flexion (1,377 cm−1), the C–O stretching vibrations of ethers and alcohols (1,110 and 887 cm−1), and the rocking motion associated with four or more –CH2 groups in a long-chain band (720 cm−1). All these bands are present in the FT-IR spectra of the integument cover films in H. rhodocerata and E. lata larvae.
On the basis of the FT-IR spectral results, this was the first report on the nature of the integument films that cover diapausing larvae of nonsocial bees and that are suggestive of the waxes used as construction materials in the honey cells of Apis mellifera and other social bees (Zimnicka & Hacura, Reference Zimnicka and Hacura2006; Pinzon et al., Reference Pinzon, Torres, Hoffmann and Lamprecht2013; Svecnjak et al., Reference Svecnjak, Baranovic, Vincekovic, Prdun, Bubalo and Gajger2015), although they are not fully identical. A few differences revealed between the FT-IR spectra of H. rhodocerata and E. lata, involved the vibronic frequency corresponding to ester C=O stretching bands, the prominence of the higher band peak assigned to –CH2 in-plane bending, and the intensity of band peaks assigned to ether and alcohol C–O stretching vibrations. These findings are not unexpected because of the complexity of the lipid-containing elements in bee waxes. A complex mixture of fatty acid esters and the esters of long-chain aliphatic alcohols have long been known to be present in honeybee wax (Blomquist & Jackson, Reference Blomquist and Jackson1979; Tulloch, Reference Tulloch1980). Approximately 300 different compounds have been estimated to be components of beeswax (Pinzon et al., Reference Pinzon, Torres, Hoffmann and Lamprecht2013).
Regarding the evidence for autofluorescence emissions by the wax films of H. rhodocerata and E. lata, no similar reference to other bee waxes has been found. The autofluorescence characteristics reported here might indicate the presence of unsaturated fatty acids with four or more –C=C– double bonds (Stockert, JC, 2016, personal communication). However, if that were the case, a band at 1,680–1,600 cm−1 would be revealed in the FT-IR spectra (Pavia et al., Reference Pavia, Lampman, Kriz and Vyvyan2009), which was not observed. Thus, the meaning of the autofluorescence findings could not be resolved with the present methods.
Although the integument covering films are conformed to the contour of the larvae of H. rhodocerata and E. lata, they are slightly separated from their bodies. The wrinkled and folded structure of the covering film from H. rhodocerata and the lacy material of the integument covering of E. lata that were especially demonstrated using polarization microscopy, probably result from the distribution of the secreted material over the entire body surface, which even imprints the sites where the larval setae arise on its surface. Only the spiracle openings remain uncovered. Particularly in the case of H. rhodocerata, the larval wax integument covering has possibly evolved as an important protection against water depletion during a long diapause (Hadley, Reference Hadley1980); the larvae of this bee species must withstand arid environmental conditions like those of the territories of the Arizona, New Mexico, and NE Mexico in the absence of a cocoon (Rozen, Reference Rozen2016). The diapausing larvae of H. rhodocerata are located ~30 cm below the surface in normally dry desert ground for at least 10 months, from the end of August to the following early July. The larval period may extend for as long as 5 years depending on the rains at the nesting site (J.G.R., unpublished data). It is suggested that surface waxes help protect plants and animals from a deadly rate of desiccation (Hadley, Reference Hadley1980). Indeed, it would not be surprising if wax coating on diapausing larvae would eventually be found characteristic of the entire subfamily Dasypodainae of the Melittidae.
Regarding E. lata, this bee may produce a cocoon that is not effective in protecting its larvae against desiccation (Rozen & Buchmann, Reference Rozen and Buchmann1990), for these cocoons apparently lack the sheet-like silk observed in bees like certain Megachilidae (Rozen et al., Reference Rozen, Rozen and Hall2011). Presumably, a wax integument covering endows the diapause larvae with a protective shield, establishing a waterproofing barrier that helps to preserve the water balance (Hadley, Reference Hadley1980).
Although the role of these coverings in water conservation could not be demonstrated through an assay in which larval specimens were manipulated and deprived of their integument coverings, due to technical experimental difficulties, we still believe that this is a role of these coverings.
The acquisition of a wax covering in H. rhodocerata and E. lata diapausing larvae may represent an example of parallel evolution between these two distantly related bee species. An outstanding case of parallel evolution with respect to the appearance of waxes with similar chemical compositions has already been proposed for two widely divergent groups such as plants and arthropods (Hadley, Reference Hadley1980). Further studies involving integument coverings and cocoons in the diapausing larvae of nonsocial bee species other than those analyzed here would certainly provide additional support for this hypothesis.
Acknowledgments
The authors thank Eli H. M. dos Anjos for formatting the figures. This investigation was supported by Fundação de Amparo à Pesquisa do Estado de São Paulo (FAPESP, Brazil; grants no. 2007/58251-8 and 2013/11078-0) and Conselho Nacional de Desenvolvimento Científico e Tecnológico (CNPq, Brazil; grant no. 304668/2014-1). The funders had no role in the study design, data collection and analysis, the decision to publish, or the manuscript preparation.