


Introduction
Over the last decades, an increasing number of new clean energy solutions have emerged to mitigate the greenhouse gas emissions. Such category of clean energy technologies includes concentrated solar power (CSP) and the next generation (Gen IV) of nuclear reactors. The CSP technology already exists on the grid and provides electricity on a commercial scale. Most commonly, current CSP designs use solar salts (NaNO3–KNO3) as heat transfer fluid (HTF). However, solar salts disintegrate at close to 600°C (Bradshaw et al., Reference Bradshaw, Cordaro and Siegel2009), which limits the thermal conversion efficiency. By replacing the solar salts with a fluid that is stable at higher temperatures, for example, liquid lead, one could achieve higher operational temperatures and thus increase the efficiency.
Gen IV energy solutions provide multiple benefits to the current clean energy market such as stable energy production, increased safety features, and the ability to reuse nuclear waste through recycling (Wallenius & Bortot, Reference Wallenius and Bortot2018; Wallenius, Reference Wallenius2019). Lead-cooled fast reactors (LFRs) use lead as HTF and are one type of Gen IV reactor that has established fundamental improvements in terms of safety and performance, when compared with commercial water reactors. Lead is a natural gamma radiation shield and has the capacity of retaining harmful fission products, which otherwise could have been released to the surroundings if the multiple safety barriers were to be breached. Also, due to the large density change of lead with temperature, natural circulation will occur and thus maintain cooling of the reactor core in case of station blackout (Wallenius et al., Reference Wallenius, Suvdantsetseg and Fokau2012). However, a major drawback of using liquid lead as HTF is the corrosive nature and it imposes on the structural components. Construction steels typically rely on the formation of a chromia (Cr2O3) layer to protect the material from any kind of corrosion attacks. In a lead-based reactor, where temperatures are high, the chromia scale will no longer be sufficient or stable enough to be a reliable corrosion barrier. This is especially true with lead temperatures going above 550°C as it may cause critical oxidation and metal dissolution of the steels (Müller et al., Reference Müller, Heinzel, Konys, Schumacher, Weisenburger, Zimmermann, Engelko, Rusanov and Markov2002; Lambrinou et al., Reference Lambrinou, Koch, Coen, Van den Bosch and Schroer2014; Ejenstam & Szakalos, Reference Ejenstam and Szakalos2015).
Alumina-forming ferritic steels, primarily FeCrAl, have shown superior oxidation properties in many extreme and high-temperature environments (Asher et al., Reference Asher, Davies and Beetham1977; Müller et al., Reference Müller, Heinzel, Konys, Schumacher, Weisenburger, Zimmermann, Engelko, Rusanov and Markov2002; Heinzel et al., Reference Heinzel, Kondo and Takahashi2006; Hattendorf et al., Reference Hattendorf, Hojda, Naumenko and Kolb-Telieps2008; Zhang, Reference Zhang2009; Lim et al., Reference Lim, Nam, Hwang and Kim2010, Reference Lim, Hwang and Kim2013; Weisenburger et al., Reference Weisenburger, Müller, Heinzel, Jianu, Muscher and Kieser2011; Fetzer et al., Reference Fetzer, Weisenburger, Jianu and Müller2012; Ejenstam et al., Reference Ejenstam, Halvarsson, Weidow, Jönsson and Szakalos2013, Reference Ejenstam, Thuvander, Olsson, Rave and Szakalos2015, Reference Ejenstam, Jönsson and Szakalos2017; Pint et al., Reference Pint, Dryepondt, Unocic and Hoelzer2014; Weisenburger et al., Reference Weisenburger, Mansani, Schumacher and Muller2014; Ejenstam, Reference Ejenstam2015; Ejenstam & Szakalos, Reference Ejenstam and Szakalos2015). Therefore, these types of alloys are often proposed as material solutions in many high-temperature applications. Commercial FeCrAl steels are typically alloyed with Cr at high concentrations (13–23 wt%), which renders them susceptible to phase separation issues, known as 475°C embrittlement. To avoid this embrittlement, a lean alloyed FeCrAl steel was previously developed, containing 10 wt% Cr and 4 wt% Al, using Ti, Nb, and Zr as reactive elements (REs) to optimize the oxidation properties for high-temperature lead environments. The addition of RE is known to significantly improve the oxidation properties, mainly by balancing the outward Al diffusion and the inward O diffusion through the oxide (Hultquist et al., Reference Hultquist, Tveten, Hörnlund, Limbäck and Haugsrud2001), as well as gettering of impurities (Hou & Stringer, Reference Hou and Stringer1992; Smialek et al., Reference Smialek, Jayne, Schaeffer and Murphy1994). This type of Fe–10Cr–4Al+RE (10-4) alloy has, in previous studies, shown promising oxidation properties and ductile behavior in liquid lead up to 800°C (Dömstedt et al., Reference Dömstedt, Lundberg and Szakalos2019, Reference Dömstedt, Lundberg and Szakálos2020).
In order to fully understand the oxidation properties, the formation, and thus the structure, of the oxide formed on the alloy needs to be characterized. Atom probe tomography (APT) is a high-resolution characterization technique that can be used to analyze both conductive materials such as metals and, due to the laser-pulsed analysis, semiconductors, and insulators such as oxides (Larson et al., Reference Larson, Alvis, Lawrence, Prosa, Ulfig, Reinhard, Clifton, Gerstl, Bunton, Lenz, Kelly and Stiller2008; Stiller et al., Reference Stiller, Viskari, Sundell, Liu, Thuvander, Andrén, Larson, Prosa and Reinhard2012; Chen et al., Reference Chen, Reed and Marquis2014; Miller & Forbes, Reference Miller and Forbes2014). APT analysis of oxides is, however, challenging. The brittle oxides can fracture easily, making data collection something of a challenge. The presence of molecular ions in the mass spectrum makes the evaluation hard, due to overlaps, and thus, careful deconvolution of peaks is needed. In addition, oxides containing more than one cation can make the overlap issue even more challenging. This paper is focused on characterization, and the details of the oxide formed on the 10-4 alloy when exposed to liquid lead at 600°C are analyzed using APT. The results are compared with data from transmission electron microscopy (TEM), and energy-dispersive X-ray spectroscopy (EDX) of the alloy aged at the same conditions. Furthermore, the same alloy exposed to 750°C liquid lead is analyzed using STEM/EDX, as a comparison to the lower temperature that is closer to the intended operating temperatures. It was also possible to analyze the thicker oxide formed at 750°C by X-ray diffraction (XRD), to identify the phases of the oxide. These complimentary techniques make it possible to study the oxide formed in detail.
Materials and Methods
Material
The alumina-forming ferritic material, 10-4, was produced in a vacuum induction furnace. The heat was hot rolled at 1,100°C, followed by homogenization at 1,050°C. Samples were cut into roughly 30 × 12 × 2 mm3 coupons and sanded with 500 grit (US #360) SiC grinding paper. The sanded samples were then cleaned with ethanol and deionized water. The nominal composition of the 10-4 steel can be seen in Table 1.
Table 1. Composition of the 10-4 Steel, Given Both in wt.% and at.%.
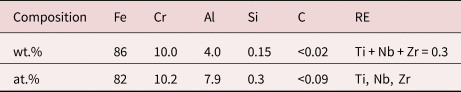
Reactive elements in the material is denoted as RE.
Liquid Lead Exposures
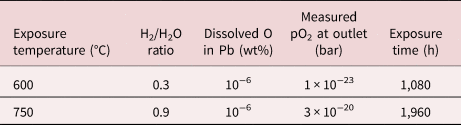
The liquid lead corrosion tests were carried out in a tube furnace. Samples were placed in alumina crucibles filled with lead and placed inside a sealed quartz glass tube located in the furnace. The system was flushed with an Ar–5%H2 gas mixture at the inlet for roughly 24 h before initiating the experiment. To achieve the desired oxygen activity at the set temperature, water vapor was added to the gas mixture. The gas mixture yields an H2/H2O ratio that can be translated into the amount of dissolved oxygen in the liquid lead. The oxygen content in the gas was measured at the outlet of the furnace using a ZIROX SGM5 oxygen sensor. For more information about the experimental setup and how the dissolved oxygen content is estimated can be found elsewhere (Müller et al., Reference Müller, Schumacher and Zimmermann2000, Reference Müller, Heinzel, Schumacher and Weisenburger2003; Ejenstam, Reference Ejenstam2015). Two exposures were performed in liquid lead, at 600°C for 1,080 h and at 750°C for 1,960 h. The 10-4 sample from the 750°C exposure has previously been investigated (Dömstedt et al., Reference Dömstedt, Lundberg and Szakalos2019) but will be studied in more detail in this work. To remove residual lead, samples were immersed into a solution consisting of hydrogen peroxide (H2O2), acetic acid (C2H4O2), and deionized water with the ratios of 1:1:7 for 1 h. The parameters used and the measured oxygen activities at the outlet for the two exposures can be seen in Table 2.
Table 2. Parameters Used, Estimated and Measured, for the Two Liquid Lead Exposures.
Characterization Techniques
The specimen preparation for APT and TEM was done using standard lift-out methods in an FEI Versa 3D focused ion beam/scanning electron microscope (FIB/SEM) (Larson et al., Reference Larson, Foord, Petford-Long, Liew, Blamire, Cerezo and Smith1999; Langford & Petford-Long, Reference Langford and Petford-Long2001; Thompson et al., Reference Thompson, Lawrence, Larson, Olson, Kelly and Gorman2007). Prior to the lift-out, the oxide was coated with a few nanometre of Pd in order to avoid charging. In some cases, an additional layer of ~70 nm Au was deposited on top of the Pd, to be used as a marker during final thinning to obtain the top part of the oxide in the APT specimen.
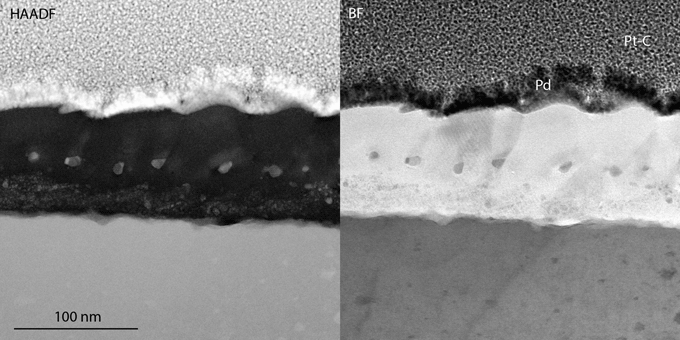
Scanning TEM (STEM) was performed in an FEI Titan 80-300 operated at 300 kV, using both high-angle annular dark-field (HAADF) and bright-field (BF) detectors. The instrument is equipped with an Oxford X-sight EDX detector, and the TIA software was used for EDX evaluation.
For diffraction, a Bruker D8 Advance and a Mat:Nordic small-angle X-ray scattering/wide-angle X-ray scattering/gracing incidence small-angle scattering (SAXS/WAXS/GISAXS) system (SAXSLAB) were used, both with Cu-radiation sources.
APT was performed in a LEAP 3000X HR (Imago Scientific Instruments) with a green laser (532 nm wavelength). The pulse frequency was 100–200 kHz, and the laser energy was 0.3–0.7 nJ. The temperature was set between 30 and 70 K. For the oxides, the higher laser energies (0.5–0.7 nJ) and temperatures (60–70 K) were used for most of the analyses, as the lower ones resulted in premature fracture and thus short runs. This affects the mass spectra, giving more complex ions and wider thermal tails, and higher background (Kirchhofer et al., Reference Kirchhofer, Diercks, Gorman, Ihlefeld, Kotula, Shelton, Brennecka and Green2014), but makes it possible to get datasets large enough to contain multiple types of oxides and features.
The APT data were reconstructed using the commercial software IVAS 3.6.14 (Cameca). Parameters for the reconstruction of the APT data were varied dependent on the location of the analysis. In the metal, the evaporation field during analysis was estimated to 23 V/nm and a field factor (k) of 4.5 was used. For the oxides, the field was set to 27 V/nm, and k was set to a value so that the reconstructed thickness of the oxide layers was not too large, as the total thickness of the oxide was known from TEM. For the reconstruction of all analyses, the image compression factor used was 1.65.
Results
The exposure at 600°C resulted in the formation of a thin oxide of high quality, which was analyzed by APT and STEM/EDX. The oxide formed during exposure at 750°C was thicker and contained some larger pores, making it less suitable for APT. The higher thickness, on the other hand, made XRD and electron diffraction feasible, which were performed in addition to STEM/EDX. In this section, the results are presented in the order of technique used, starting with X-ray diffraction, followed by STEM/EDX and APT.
X-Ray Diffraction
The material exposed to lead at 750°C was analyzed using XRD and grazing incidence X-ray scattering. The oxide of the material exposed in 600°C was too thin to give any significant contribution to the scattering. In the θ–2θ setup (Fig. 1a), the substrate gave a few reflections due to the small size of the specimen. However, the ferritic metal and the Al2FeO4 spinel could both be confirmed in the diffractogram (see Fig. 1b for a smaller part of the diffractogram). When performing grazing incidence (GI) diffraction at 1° and 5° incidence angles, the same two phases were found (Fig. 1c). The shape of the peaks is somewhat widened due to the geometry of the specimen; the small size and the low angle made it hard to hit only the top surface of the specimen. The spinel peak at roughly 45° can be distinguished from the ferrite peak in the XRD diffractogram, but not in the GI diffractogram due to broadening of the peaks. In addition to the ferrite and spinel, small peaks corresponding to γ-Al2O3 were found in this more surface-sensitive setup.
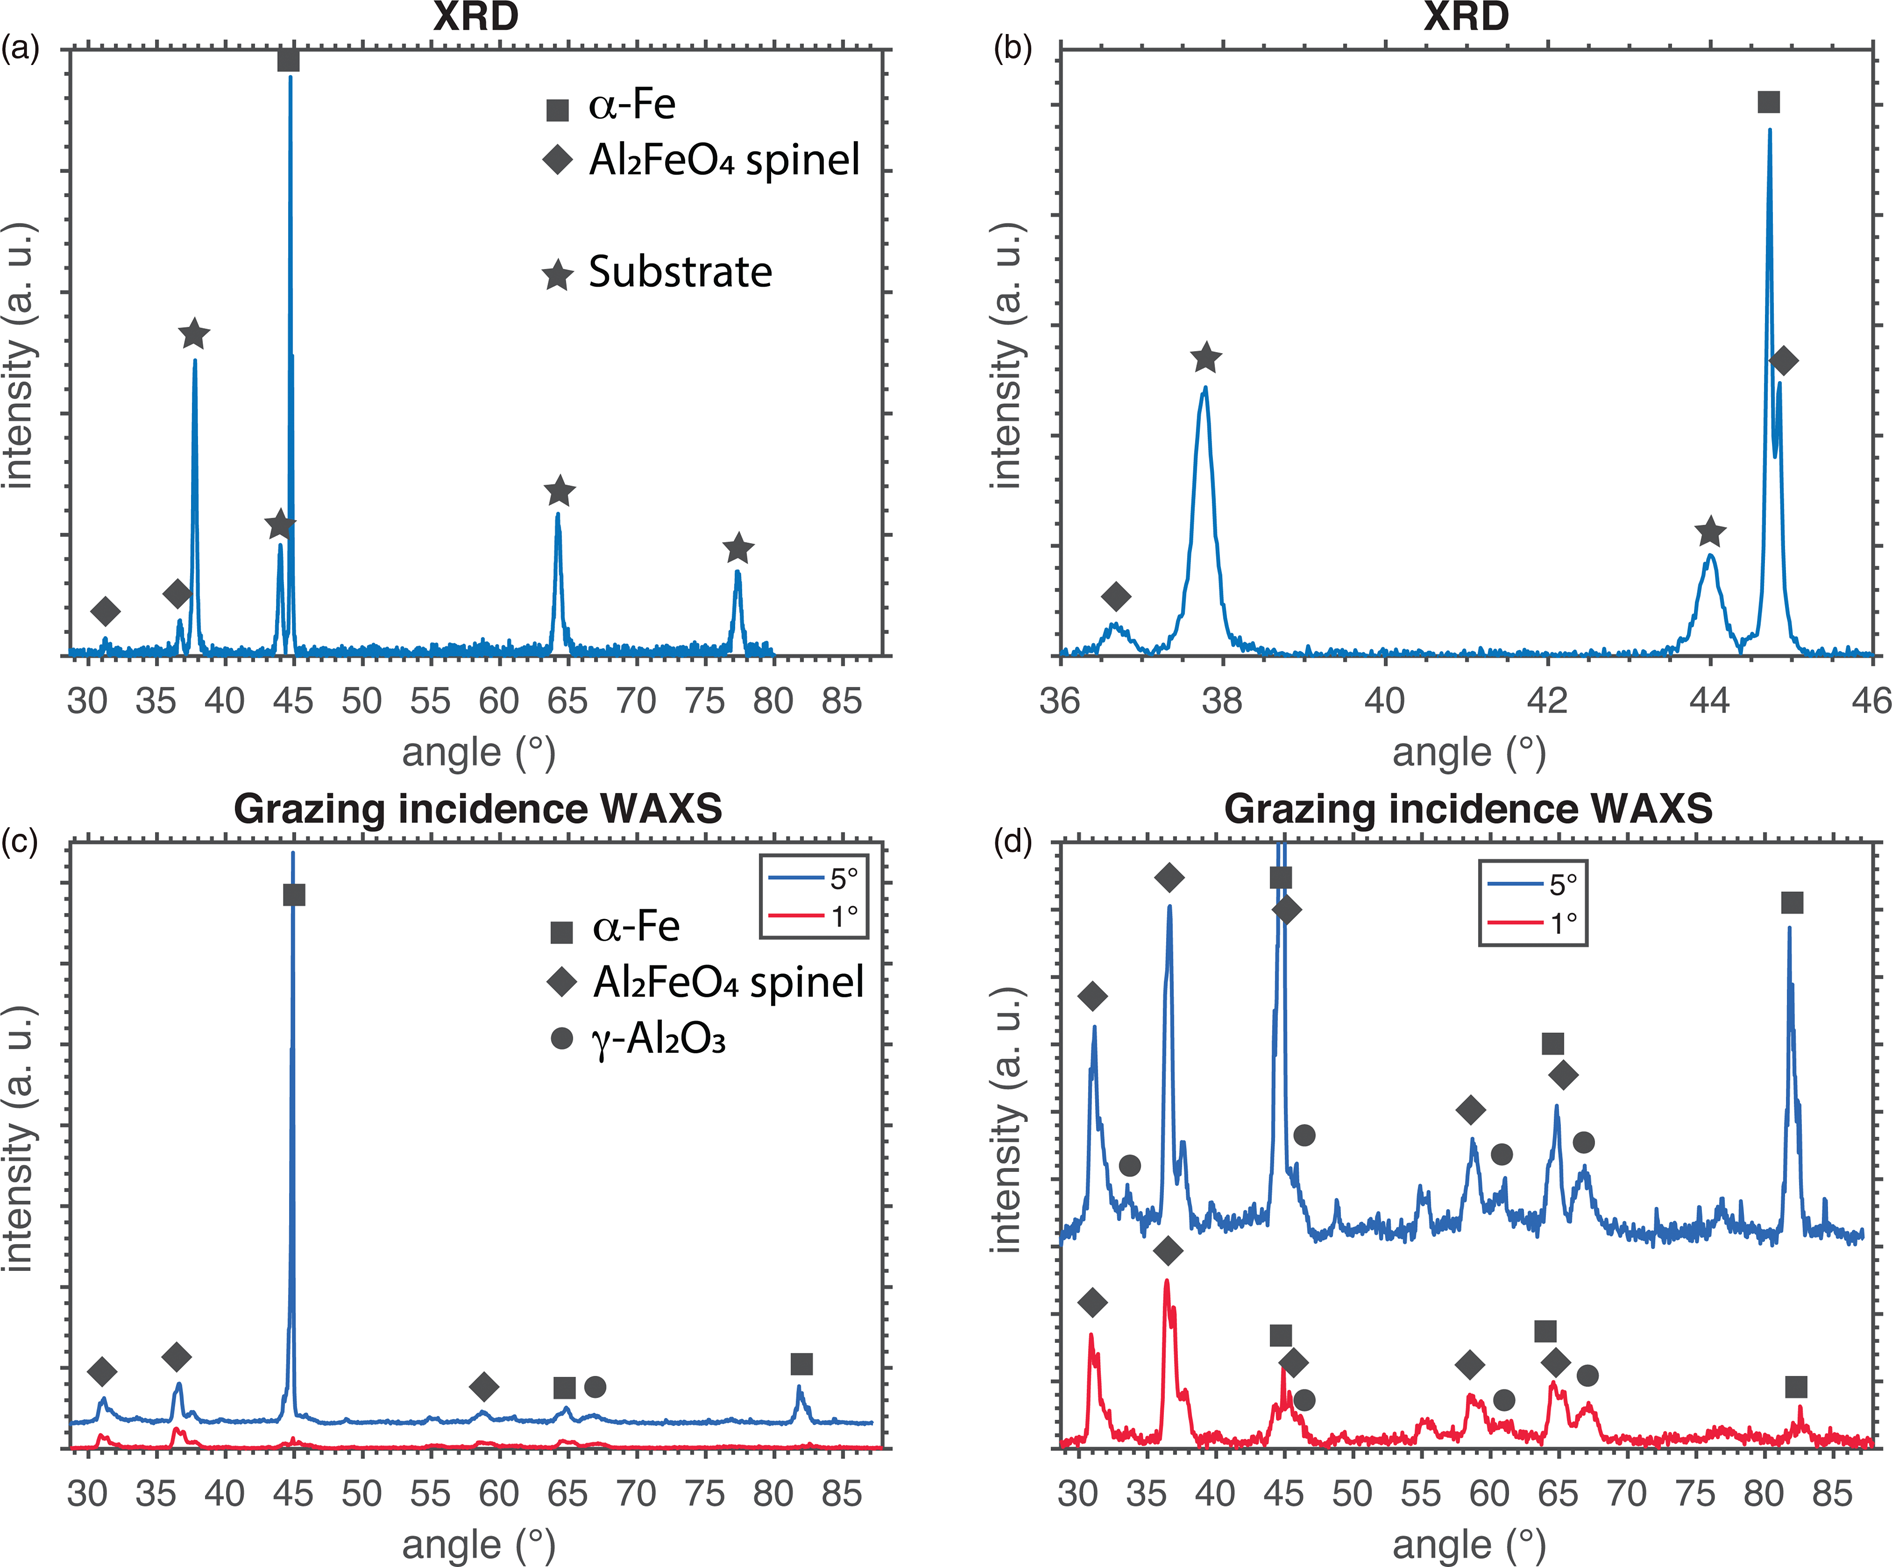
Fig. 1. X-ray diffraction of the material exposed in 750°C Pb. (a) A θ–2θ geometry was used for measurement. (b) A shorter part of the same diffractogram is shown. (c) Grazing incidence of 1° and 5° was used. (d) The same data as (c), but with a smaller range on the y-axis. and ((c and d) The 5° spectrum is shifted upwards in order to facilitate comparison.
Transmission Electron Microscopy
A STEM micrograph of the steel exposed at 750°C for 1,970 h can be seen in Figure 2a. The oxide scale thickness is ranging from 1.8 to 2.1 μm. There is a top layer rich in Al and Fe, with visible columnar grains, marked i) in the figure, with a grain width around 0.5 μm. This layer does not contain any Pb. Electron diffraction confirms that this is a spinel (Figs. 2b, 2c), presumably Al2FeO4 when considering the Fe/Al ratio measured by EDX (Table 3).
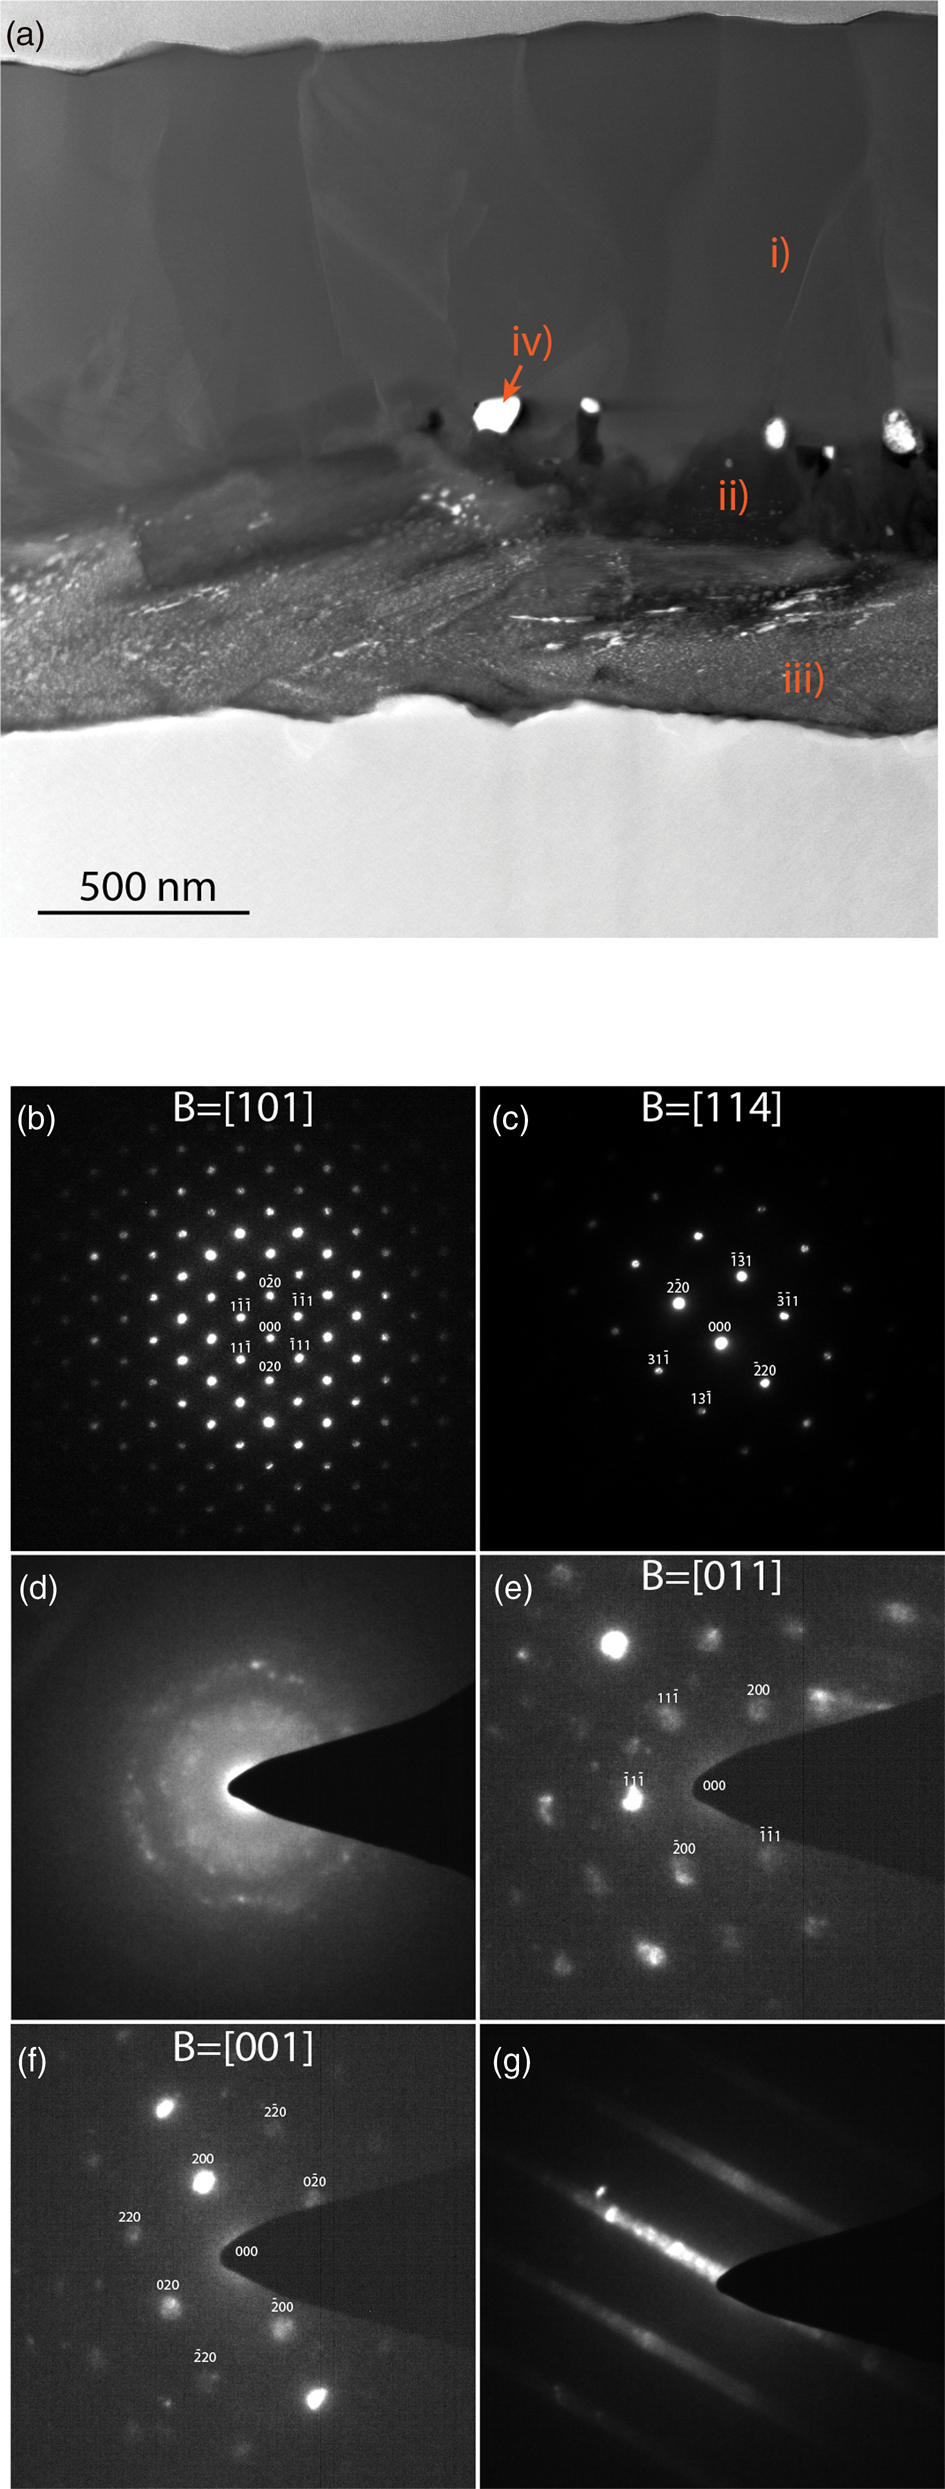
Fig. 2. (a) STEM-HAADF of the 750°C exposed material with marked locations for EDX analysis. (b and c) Indexed diffraction patterns of the top spinel layer, marked i) in (a). (d) The Al-rich oxide close to the metal, also containing Pb-rich nanocrystals, and (e–g) also from this layer (marked iii) in (a), but slightly further away from the metal.
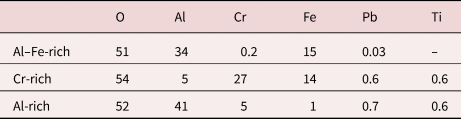
Table 3. Metallic Compositions (Given in Normalized %) From EDX in Points Marked in Figure 2.
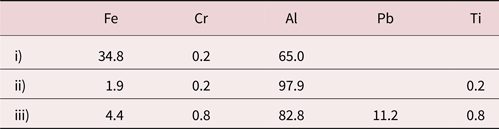
Larger amounts of oxygen were present in the EDX spectra but are removed in the normalization. Point iv) is not included in the table but was confirmed to be a Pb particle by EDX.
In the middle of the oxide, there is a dark contrast layer, that is, Al-rich (position ii) in Figure 2. The crystal structure of this layer is unknown. In this layer, there are Pb particles, marked iv) in the figure. These particles are in most cases in contact with dark contrast elongated features, that are interpreted as pores in the oxide. During the FIB lift-out sample preparation, there were pores visible in this middle layer, supporting this interpretation.
The inner oxide layer, closest to the metal substrate, is also Al-rich but contains a considerable amount of Pb. This layer is marked iii) in Figure 2a. The brighter contrast in this layer comes from small Pb particles. The size of these particles varies between 5 and 50 nm, and some of them are elongated. EDX analysis gives a small amount of Ti in the inner layer (0.8 at.% of the cations). The oxide close to the metal does appear amorphous in some regions where the oxide penetrates the metal slightly when studied by electron diffraction (Fig. 2d). The exact location of this specific diffraction pattern is outside the representative area shown in Figure 2a. In this pattern, there are rings that belong to the nanocrystalline Pb particles, in a diffuse background, that suggest an amorphous Al-rich oxide. However, electron diffraction shown in Figures 2e and 2f of the Al-rich oxide confirmed a crystalline γ-Al2O3 structure in some parts of the Al-rich inner layer, typically in regions like the one marked iii) in Figure 2a. For some tilt-angles, the diffraction patterns for this oxide contain streaks rather than points, as shown in Figure 2g, suggesting a faulted structure, with double diffraction in certain directions. The Pb particles were present in the γ-Al2O3 grains giving the diffraction patterns shown in Figures 2e–2g, but the diffraction is too weak in comparison to the reflections from the γ-Al2O3 to show in the patterns.
The steel exposed at 600°C was also analyzed using TEM. The STEM-HAADF and STEM-BF images in Figures 3 and 4 reveal a 100-nm thick oxide, containing three different layers. The top layer is rich in Al and contains some Fe, as seen in the EDX profile i) and the EDX map ii) in Figure 5, all excluding O from the quantification. The top surface appears to be facetted, which was confirmed by SEM of the surface (Supplementary Fig. S1). Beneath this layer, a thin Cr-enriched layer is present. The Cr in the EDX map does not appear to be evenly distributed within the layer, possibly due to overlaps of different oxide layers within the thickness of the TEM lamella, or due to variations in the composition of this part of the oxide. In connection with this layer, there are larger Pb particles (bright contrast in the HAADF image in Fig. 3 and seen in the EDX profile i) in Fig. 5). It is interesting to note that the volume around the Pb particle in the EDX map appears to be enriched in Cr and depleted in Al. Surrounding some of these particles is also a thin layer of dark contrast in the HAADF image, and bright contrast in the BF image (Fig. 3). At least some of these particles appear to be located in connection to grain boundaries of the top oxide layer. Under the Cr-rich layer, the oxide contains more Al, and only small amounts of Fe and Cr. This inner Al-rich oxide contains Pb particles that are smaller and more distributed than in the Cr-rich layer. These particles can be seen in the HAADF micrographs as bright spots and in the EDX map. In the metal–oxide interface, small amounts of RE (Nb, Ti, and Zr) were identified in the EDX map and profiles, as well as a few pores.

Fig. 3. 10-4 exposed in Pb at 600°C, STEM-HAADF and BF of the oxide.
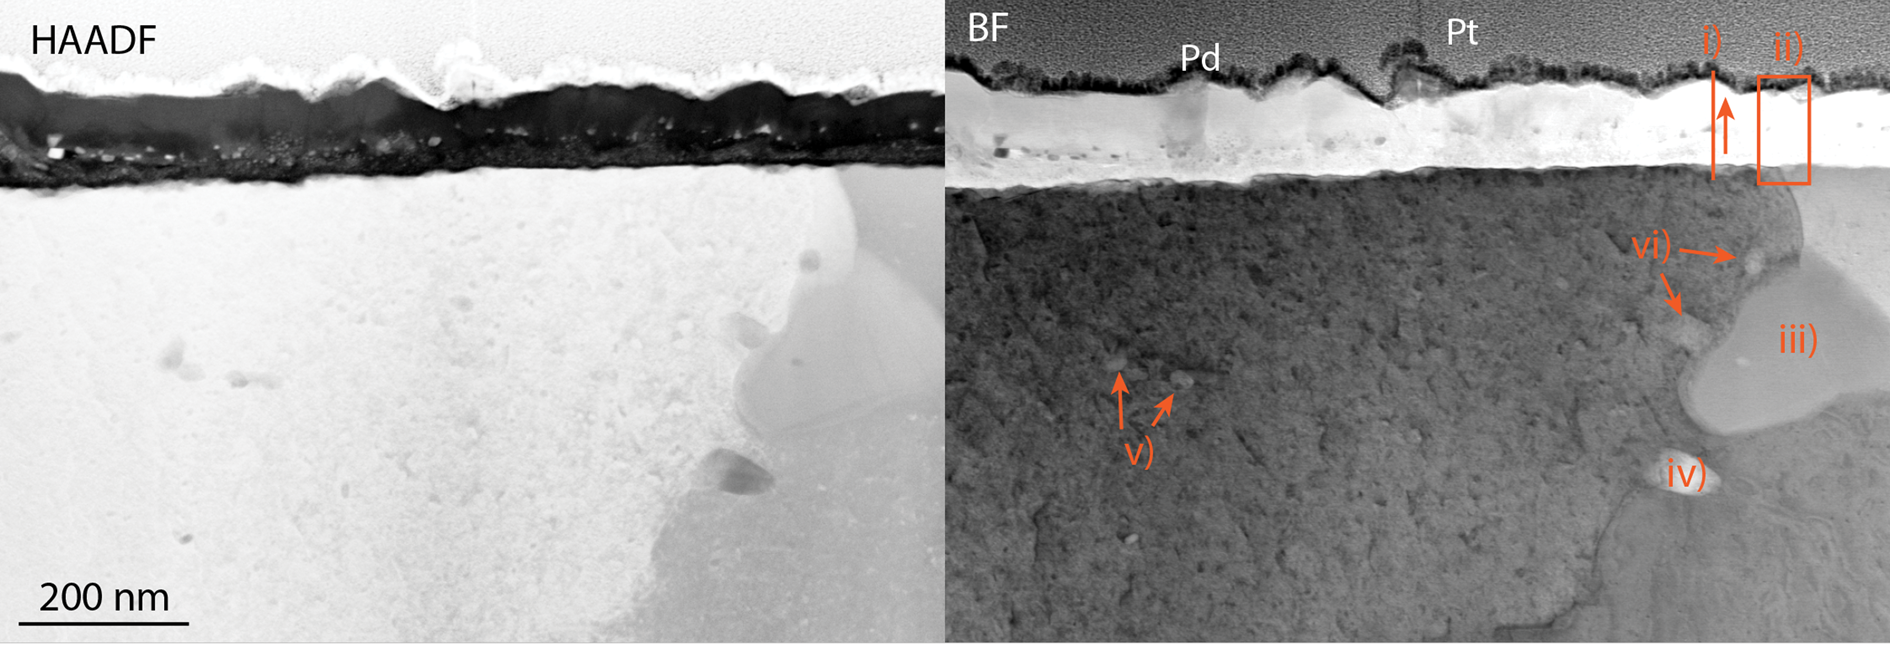
Fig. 4. HAADF and BF STEM of the 600°C exposed material, including references to the position and direction of the EDX line profile i), the position of map ii) (both in Fig. 5), and EDX spot analysis positions. iii) An intermetallic particle and iv)–vi) carbides.
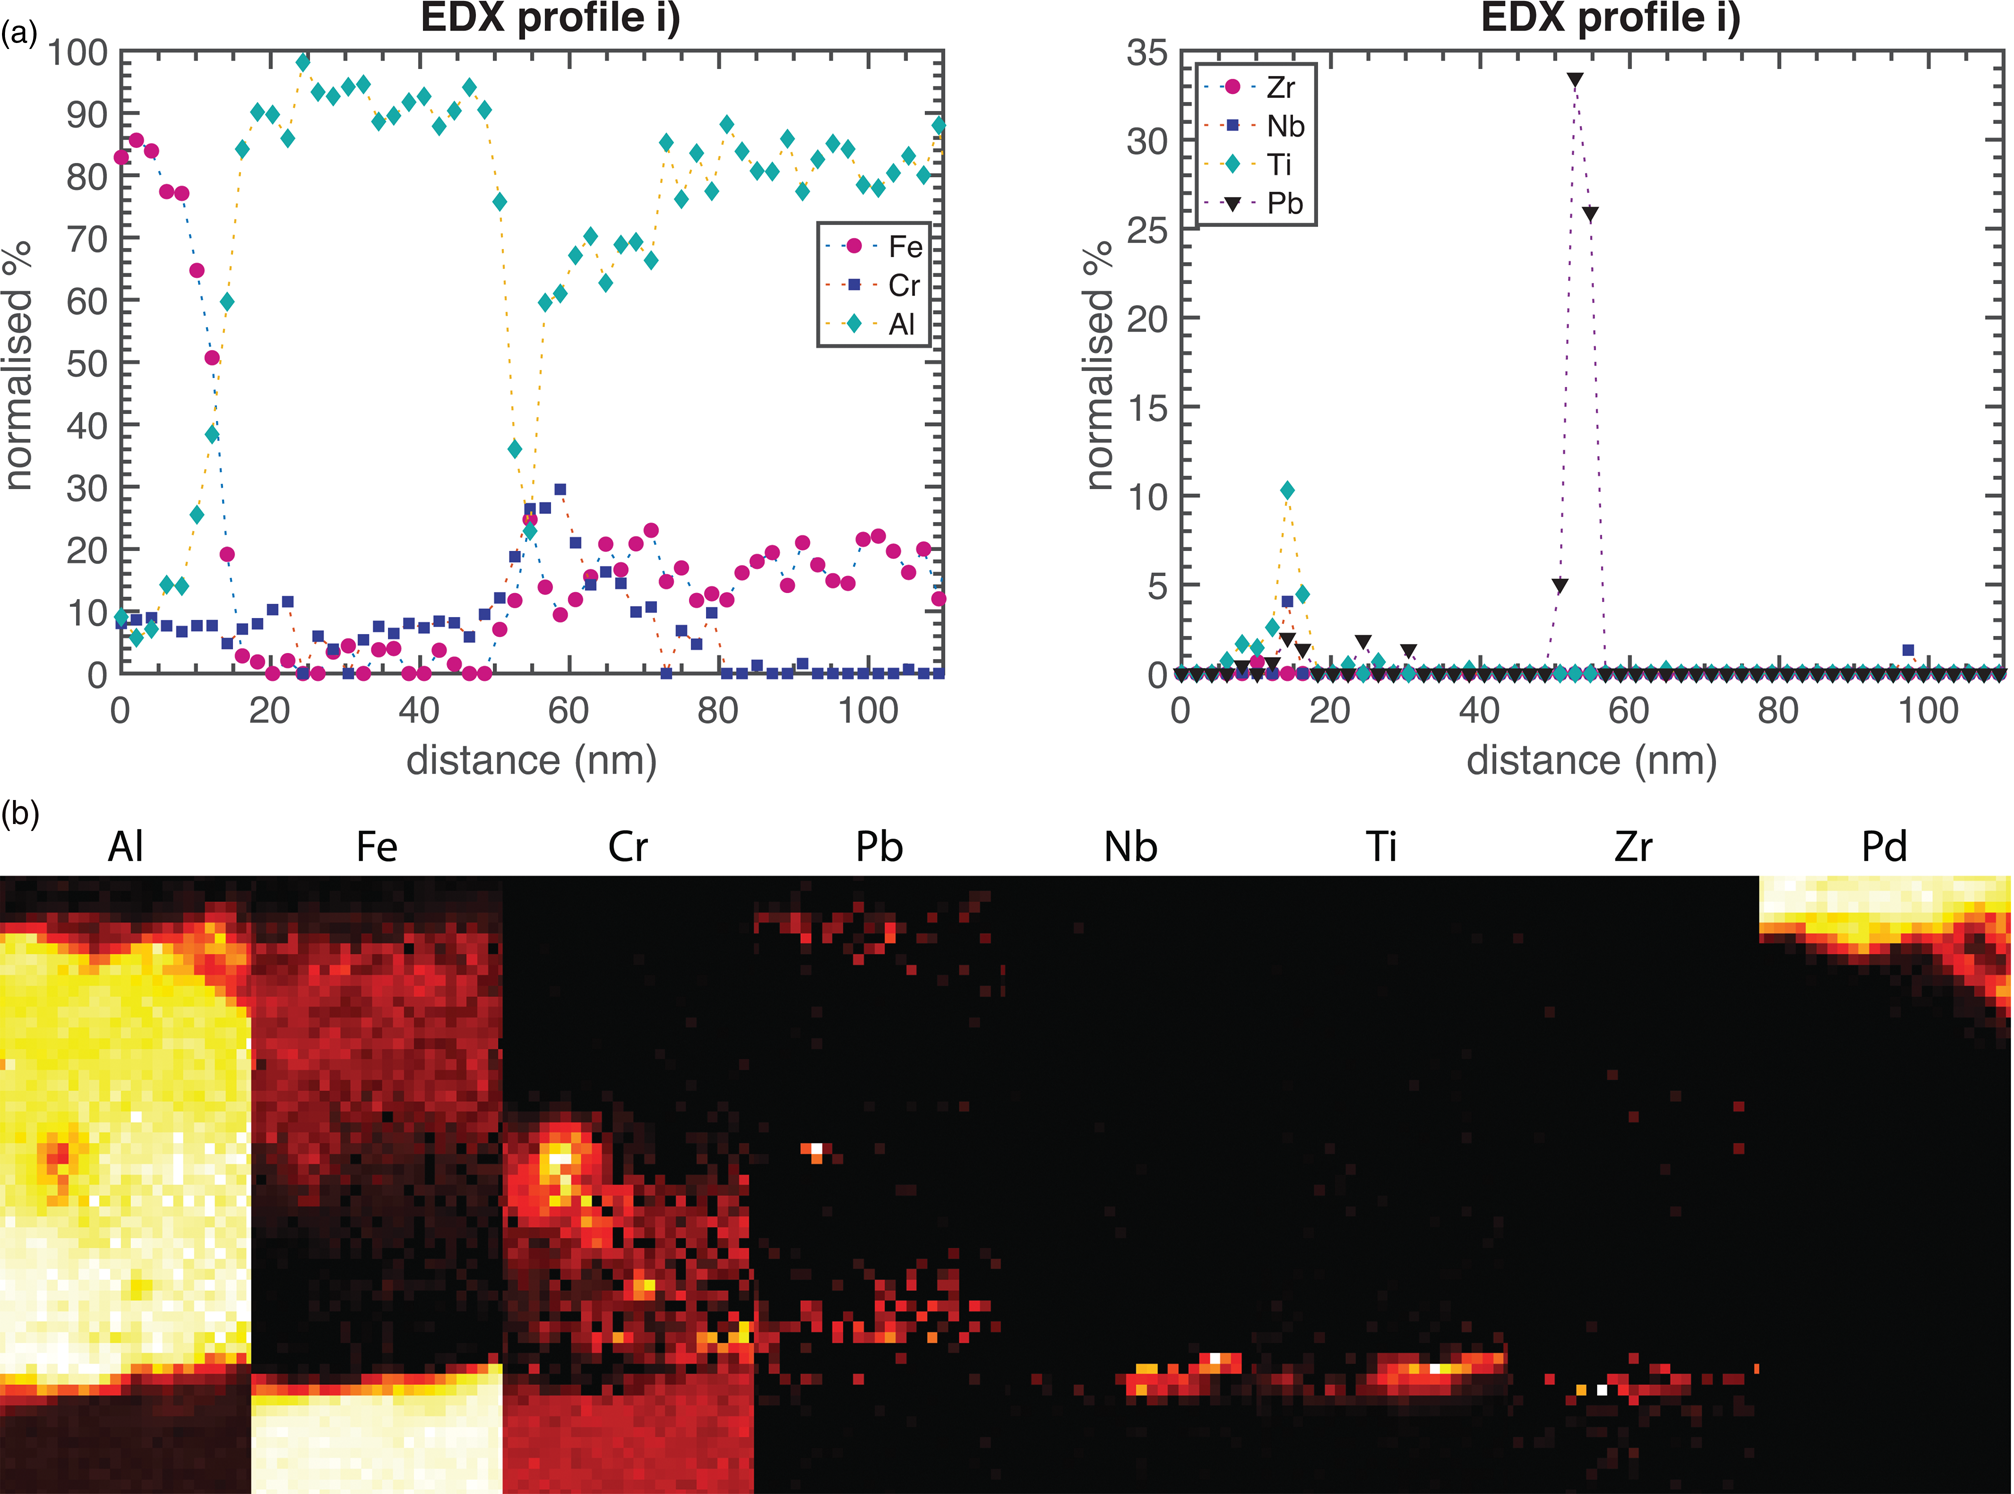
Fig. 5. EDX profiles and maps of the oxide formed at 600°C. The location of the maps is marked in Figure 4. The width of the EDX map is 50 nm. (a) An EDX line profile, normalized to exclude O, through the oxide thickness is shown. The oxide starts at 15 nm on the x-scale and is marked i) in Figure 4. (b) A map, marked ii) in Figure 4. The elements except O are shown individually.
In Figure 4, a number of small carbides are seen in the metal, marked iv), v), and vi). According to EDX, they are rich in Nb and Ti, with the atomic Nb/Ti ratios of between 0.6 and 1.1. Two of them also gave a small Zr EDX-signal. Area iii) in Figure 4 contains 62.7% Fe, 20.0% Nb, 11.7% Ti, 5.0% Cr, 0.6% Al, and 0.1% Zr (at.%) and is presumably Laves phase, located in a grain boundary.
Atom Probe Tomography
The different types of oxide observed by TEM was also analyzed by APT for the thin oxide in the 600°C exposed material, giving three-dimensional information. A cross section of the top oxide is shown in Figure 6. The Al- and Fe-rich oxide does not contain any Pb particles. The figure also shows a thin layer containing Cr, in the bottom left of the analysis. This could possibly be a grain boundary, showing the complexity of the oxide in 3D. There is also a volume that contains slightly more Al and less Fe seen in the bottom right of the volume.
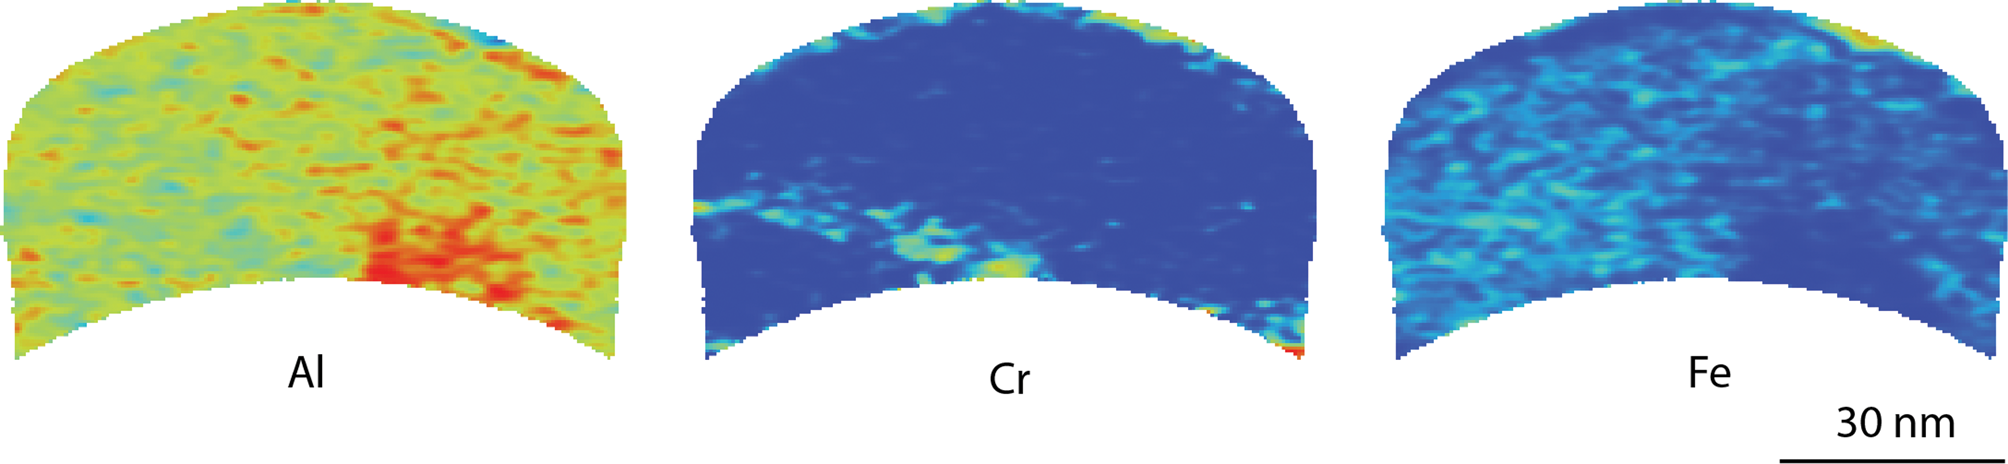
Fig. 6. Cross-section APT heatmap of Al, Cr, and Fe in the Al- and Fe-rich top oxide in material exposed at 600°C, showing concentration variations qualitatively. Red indicates high concentration and blue indicates low concentration. The peak at 27 Da was not used for these maps as there is an overlap between Al, Cr, and Fe.
In Figure 7, a cut through an APT analysis heatmap of the Cr-rich layer and the Al-rich inner oxide is shown. In these layers, Pb particles are present. No other elements were found to segregate with the Pb, and therefore, the Pb particles are assumed to be purely metallic. Figure 7 shows that the interface between the two inner oxides also has a complex structure, with Cr extending into the bottom oxide. The full shape of the reconstruction is based on the voltage curve, assuming the same evaporation field throughout the analysis. The change of composition is correlated with an increase in the diameter of the reconstruction. This increased diameter is mostly artificial, implying that the Al-rich oxide has a higher evaporation field than the Cr-rich oxide, thus needing a higher voltage to evaporate. The APT datasets shown do not contain any oxide/metal interfaces, due to the increased risk of specimen fracture during APT analysis in this region.
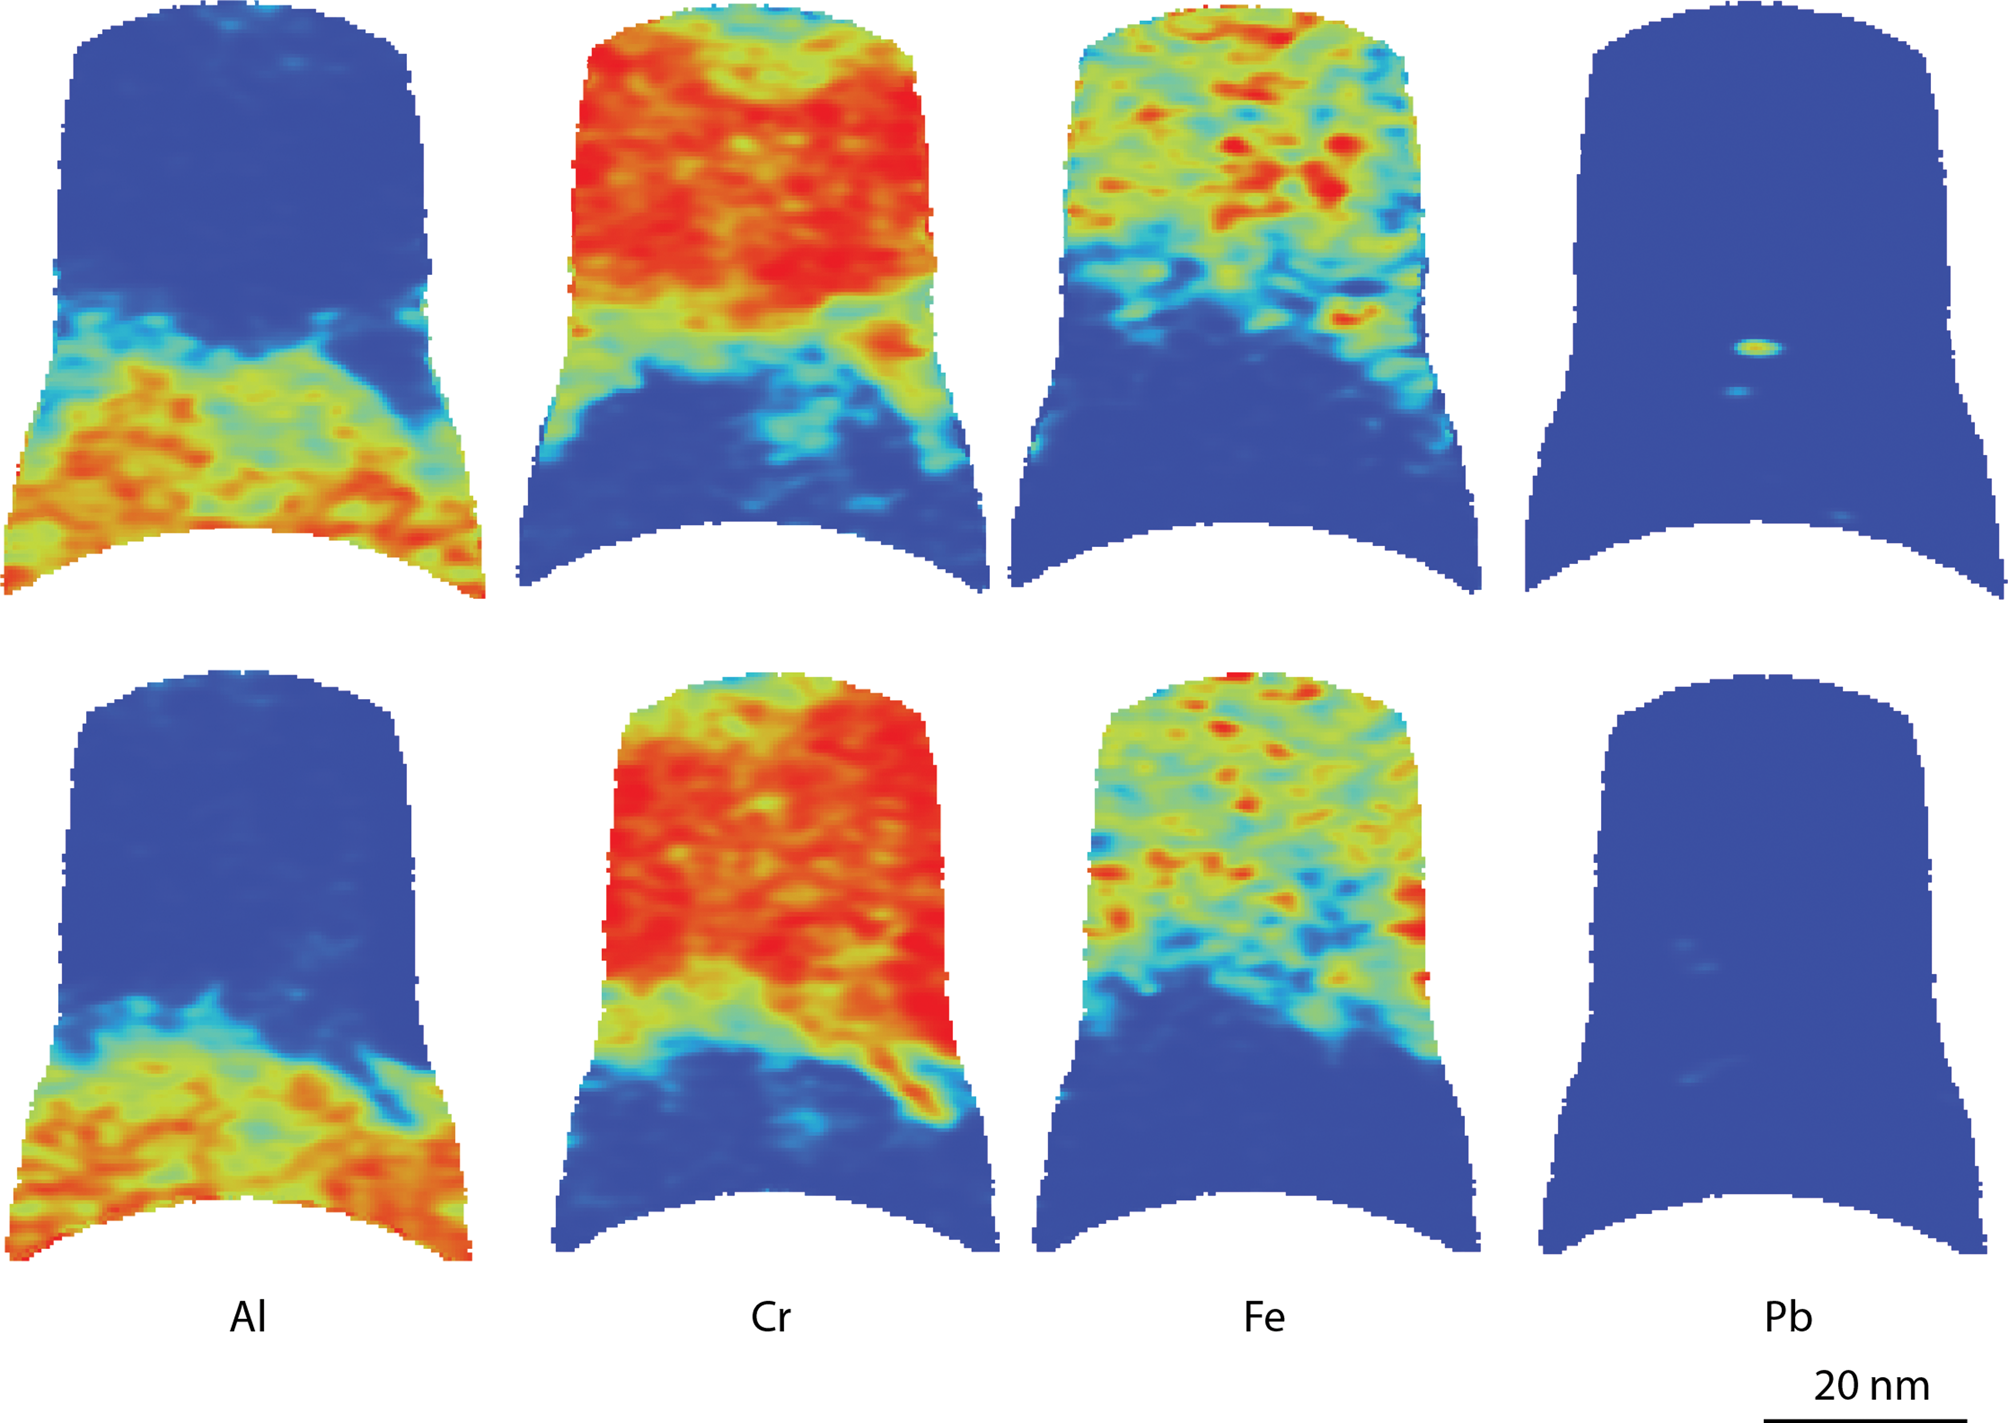
Fig. 7. APT cross-section heatmaps showing the qualitative distribution of Al, Cr, Fe, and Pb in the bottom two layers of the oxide from the material exposed at 600°C. Red indicates high concentration and blue indicates low concentration. The reconstruction was rotated by 90° between upper and lower rows of cross sections. The peak at 27 Da was not used for these maps as there is an overlap between Al, Cr, and Fe.
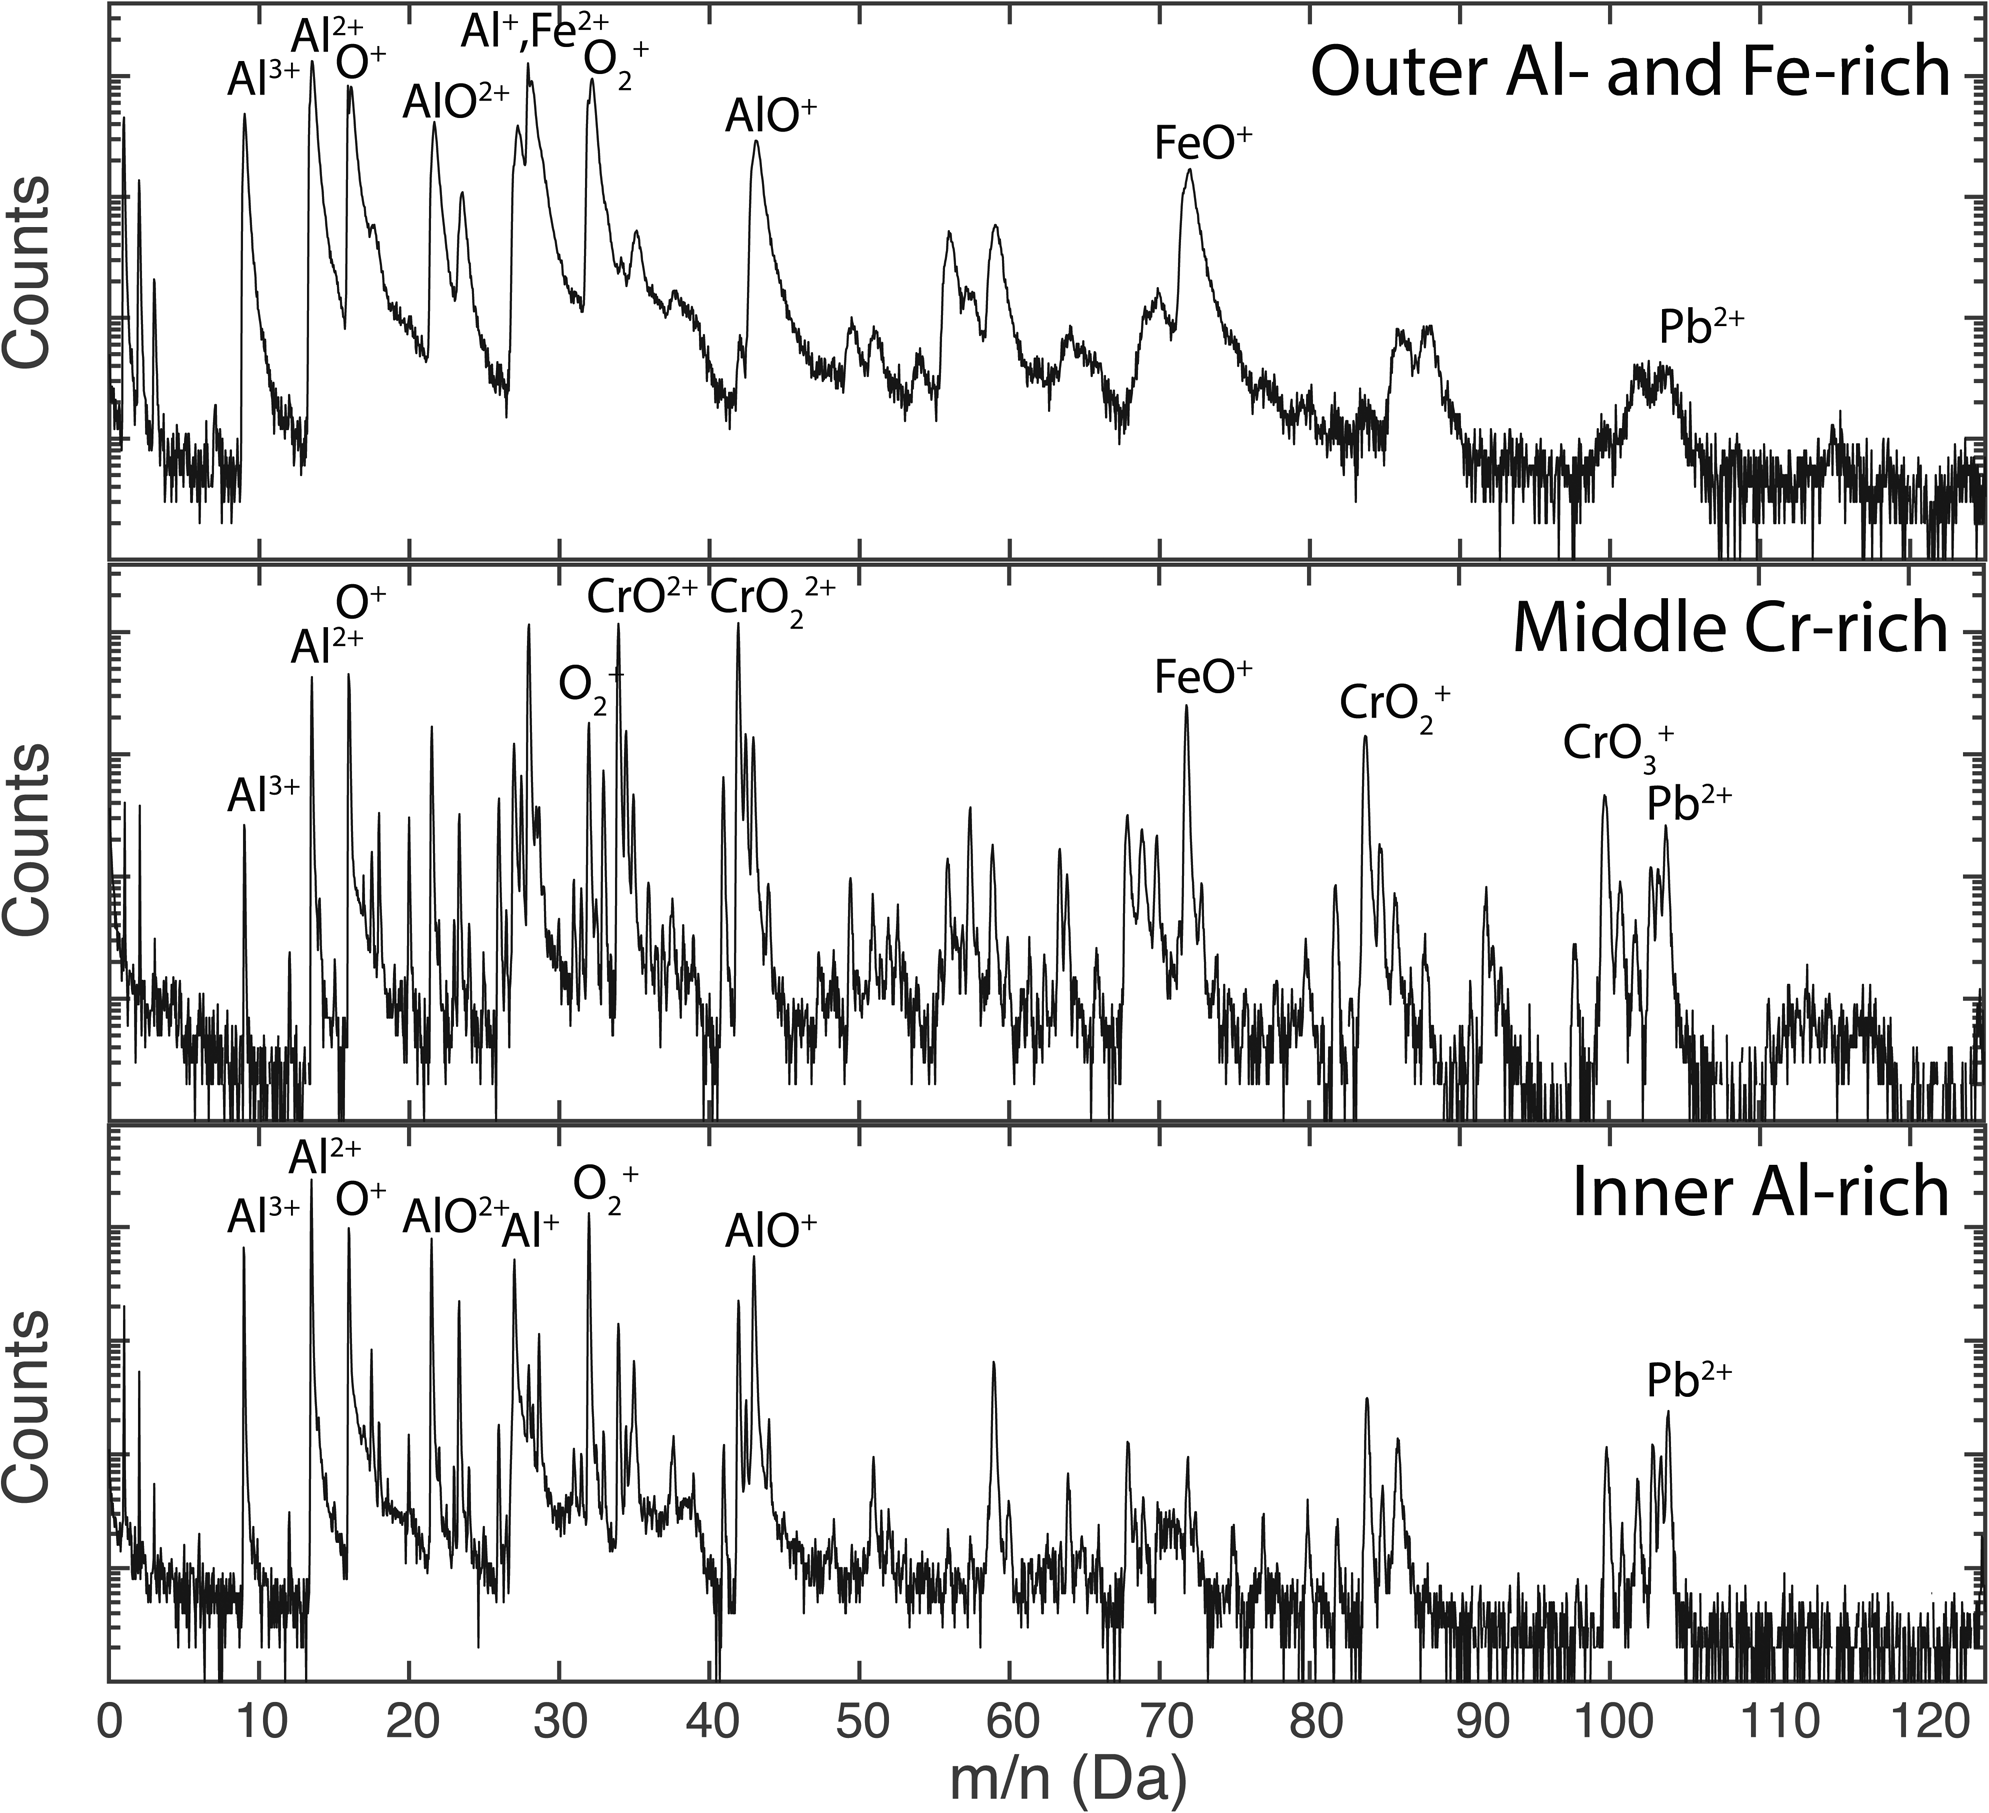
The mass spectra corresponding to the different parts of the oxides are shown in Figure 8. All three parts of the oxide contain Fe, Cr, and Al, contributing to the complex mass spectra, leading to several overlaps of molecular ions. The mass spectrum of the top Al–Fe-rich oxide contains wide peaks, due to the poor thermal conductivity and high laser pulse energy and temperature used. This spectrum is taken from a volume excluding the Cr-enriched boundary seen in Figure 6. The mass spectra of the Cr-rich volume (defined as the volume where the Cr concentration is higher than 20 at.% in the analysis shown in Fig. 7) and the Al-rich volume (Al more than 20% in the same analysis) show more well-defined peaks, probably due to better heat transfer away from the tip apex during APT analysis. The heat transfer could also be improved by the short distance to the metal. The spectra contain many complex molecular ions and thus also overlaps. Some peaks correspond to different ions in different volumes, such as the 27 Da peak that was found to be 99.5% Al+ and 0.5% Fe2+ in the Al-rich oxide, but 54% Fe2+, 45% Al+, and 1% Cr2+ in the Cr-rich oxide, using deconvolution based on the natural abundance of isotopes. This shows the importance of a careful evaluation of each type of oxide separately.
From these mass spectra, the compositions were determined, as seen in Table 4. The largest possible error is misidentification of ions, particularly in the Al–Fe-rich oxide, where the peaks are wide and might obscure smaller contributions. Extra care was taken to find REs in the oxides. The only RE found was Ti (as TiO2+ at 31–33 Da) in the Al-rich and the Cr-rich oxide, see Figure 9. The mass spectrum of the Al–Fe-rich oxide contained too much background and too wide peaks to see any traces of TiO2+, so the possible presence of small amounts of Ti can neither be confirmed nor refuted. The main naturally occurring TiO2+ isotope overlaps with  ${{\rm O}_2}^+$ at 32 Da, but the peaks at 31, 31.5, and 32.5 Da match the intensities well of TiO2+, and the peak at 33 Da is slightly higher, indicating an overlap with CrO2+, see Figure 9. About 35 and 4% of the ions in the 32 Da peak correspond to TiO2+ in the Cr-rich and Al-rich oxides, respectively. The location of Ti in the oxide is not random, but not directly related to any obvious grain boundaries. The Ti in the Cr-rich oxide is mainly located close to the boundary to the inner Al-rich oxide. It is possible that a small part of the 32 Da peak also comes from S+ ions, possibly originating from the lead. However, this is assumed to be a small contribution, which can hardly be confirmed by APT, and is not included in the analysis.
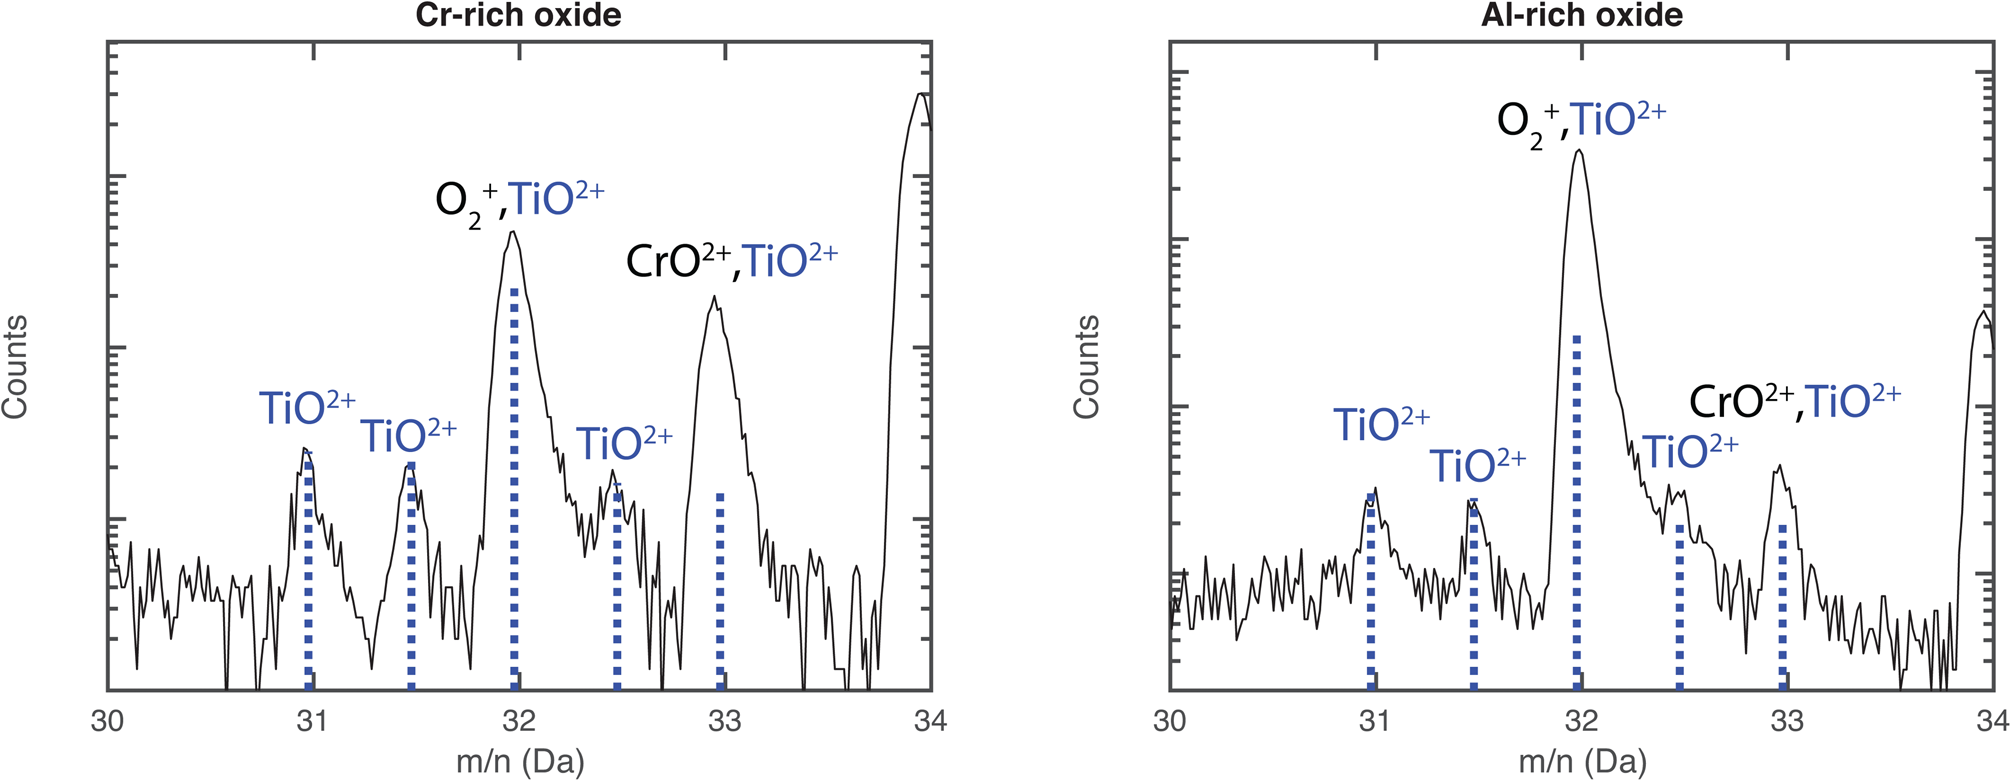
Fig. 9. Mass spectrum from 30 to 34 Da for the middle Cr-rich and bottom Al-rich oxide layers of the 600°C exposed material. The natural abundance of TiO2+ is marked in blue (fitted for 31 Da), overlapping with  ${{\rm O}_2}^+$ and CrO2+. The peak at 34 Da is the main peak of CrO2+.
Table 4. Measured Compositions of the Oxides in the 600°C Exposed Material, From APT (at.%).
Oxygen is most likely somewhat underestimated.
The compositions in Table 4 should be interpreted as tentative values but show a composition corresponding well to the ones obtained by EDX (profile i) in Figure 5, considering the Al–Fe-rich and Al-rich oxides. The middle Cr-rich oxide contains more Cr in the APT data, but this might be due to varying composition or overlaps in the TEM lamella, as the EDX map (Fig. 5b) shows a varying Cr content in this layer. There are a few unidentified peaks, corresponding to 0.3–1.7% of the total number of ions. The Al-rich oxide contains only 0.3% ions in unidentified peaks. The Cr-rich oxide contains 1.7% unidentified ions, if the 27.5 Da peak is assumed to be Mn2+ (resulting in a total of around 0.4 at.% Mn in this part of the oxide). This is not included in the table as Mn only has one naturally occurring isotope, making the identification somewhat uncertain. This would also mean that the Mn is enriched in the oxide, when comparing with the average of 0.08 ± 0.02 at.% Mn in the bulk according to APT analysis of the metal (see below).
The analysis shown in Figure 7 is also shown in Figure 10, where the entire volume is shown, and the Pb particles are outlined using iso-concentration surfaces chosen as Pb 7.9 at.%. Some of the Pb particles have volumes of high density in connection with them, sometimes connecting two particles. These high-density volumes are interpreted as pores. When a pore appears in an APT analysis, the edges of the pore will affect the direction of field evaporation, focusing or spreading the ions of the surrounding material into the volume corresponding to the pore, depending on the local evaporation field close to the pore (Krämer et al., Reference Krämer, Wells, Oberdorfer and Odette2017; Lloyd et al., Reference Lloyd, Abernethy, Gilbert, Griffiths, Bagot, Nguyen-Manh, Moody and Armstrong2019; Wang et al., Reference Wang, Hatzoglou, Sneed, Fan, Guo, Jin, Chen, Bei, Wang, Weber, Zhang, Gault, More, Vurpillot and Poplawsky2020). This effect often results in an artificially high ionic density in the reconstructed volume.
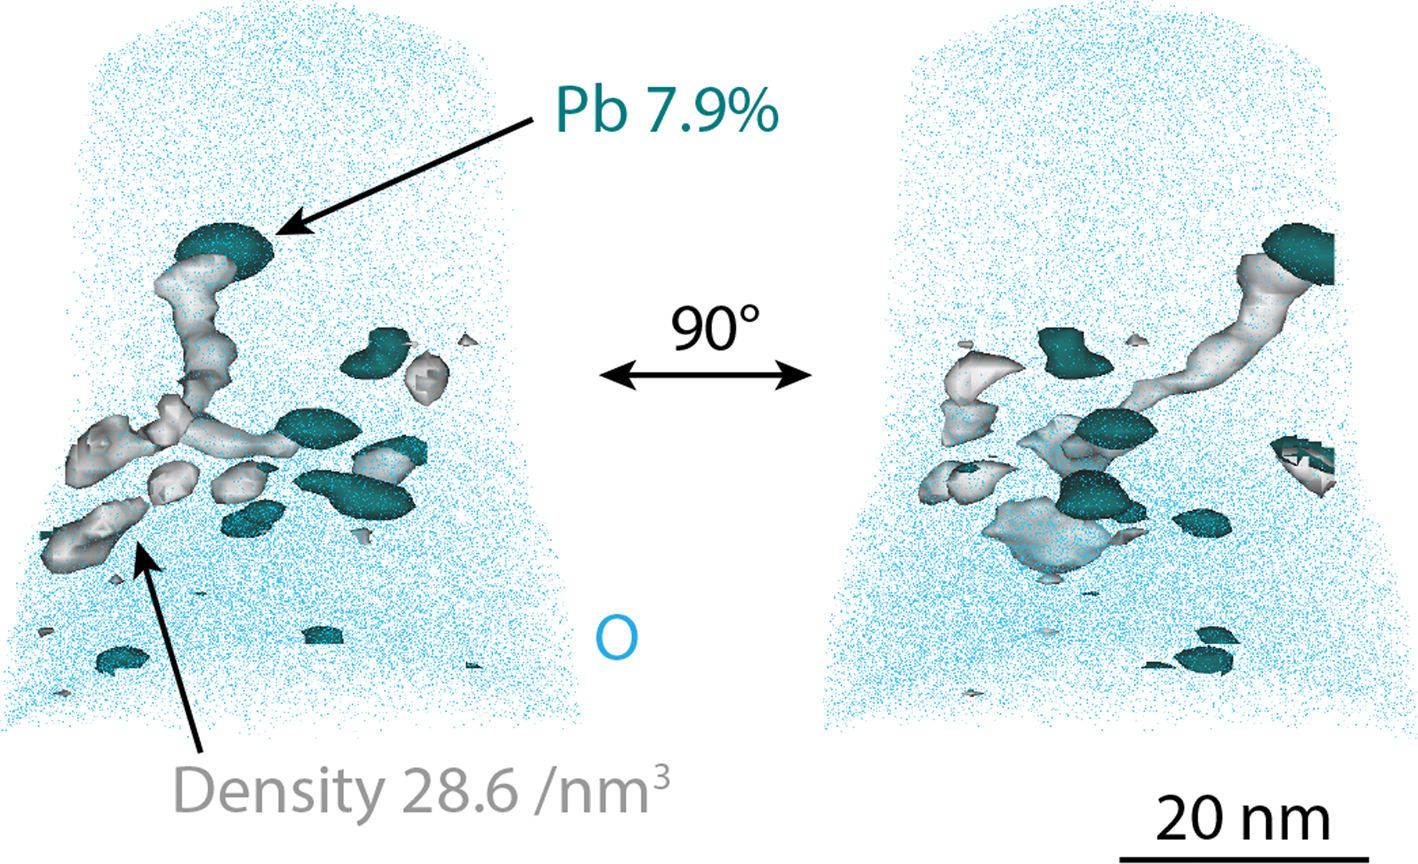
Fig. 10. Pb particles in the 600°C exposed material, visualized by 7.9 at.% Pb iso-concentration surfaces, and high-density volumes in connection with them, showed as 28.6 atoms/nm3 iso-density surfaces (corresponding to 77.3 atoms/nm3 when correcting for the detection efficiency of the LEAP). O atoms in blue show the extension of the analysis. The analysis is shown fin two different directions. This is the same analysis that is shown in Figure 7.
A slice of the same analysis, showing the Pb atoms and some of the oxide ions, is shown in Figure 11. Here, it is seen that the Pb atoms have evaporated into plates. The arrows in the figure are perpendicular to the curvature of the evaporating surface. An assumption is that this is an indication of the Pb particles having much lower evaporation field than the surrounding material. Thus, when the material above the particle is evaporated, most of the Pb will evaporate immediately, resulting in the disc-shaped particles in the reconstruction. This can be compared with similar effects from pores containing Xe observed by Estivill et al. (Reference Estivill, Audoit, Barnes, Grenier and Blavette2016). In Figure 11, it can also be seen that there are some unevenly distributed Pb atoms in the oxide.
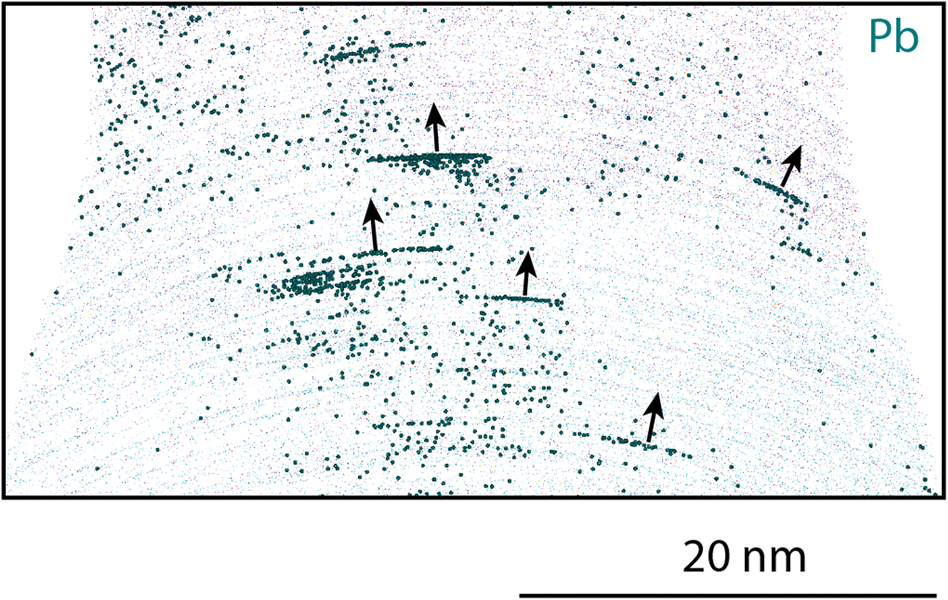
Fig. 11. A 5-nm thick slice of the APT reconstruction of the analysis in Figures 7 and 10 shows Pb atoms on layers in the 600°C exposed material. Ions belonging to the Al-rich oxide (blue) and Cr-rich oxide (pink) are also present to show the outline of the reconstruction. The arrows are perpendicular to the layers that follow the curvature of the needle during evaporation.
A few carbides in the metal were also analyzed by APT. One was found to sit on a grain boundary enriched in Nb, Zr, Ti, Si, and B, see Figure 12. Note that the APT analysis in question was run in laser pulsed mode, and thus, the Si distribution should be interpreted with some care, as Si moves on the surface when exposed to the laser beam (Gault et al., Reference Gault, Müller, La Fontaine, Moody, Shariq, Cerezo, Ringer and Smith2010; Hyde et al., Reference Hyde, Burke, Gault, Saxey, Styman, Wilford and Williams2011). In another APT reconstruction (not shown here), three carbides were present, within a distance of 50 nm from each other, and not apparently close to any enriched boundary. The APT of the carbides confirms the Ti- and Nb-rich composition given by STEM/EDX. In the carbides, the Nb/Ti ratios (in at.%) varied between 0.51 and 0.74 in the carbide in the figure and the three carbides in the other analysis. The carbides also include small amounts of Zr (0.4–2 at.%). The carbides are assumed to be of MC type, where typically the measured C content in APT (43 at.% when not corrected in the carbides here) is a bit lower than expected due to multiple events during field evaporation (Thuvander et al., Reference Thuvander, Weidow, Angseryd, Falk, Liu, Sonestedt, Stiller and Andren2011). It is also possible that the carbides are slightly sub-stoichiometric. The carbides analyzed show slightly different compositions in terms of Ti, Nb, and Zr content, which is to be expected due to local variations in the material.
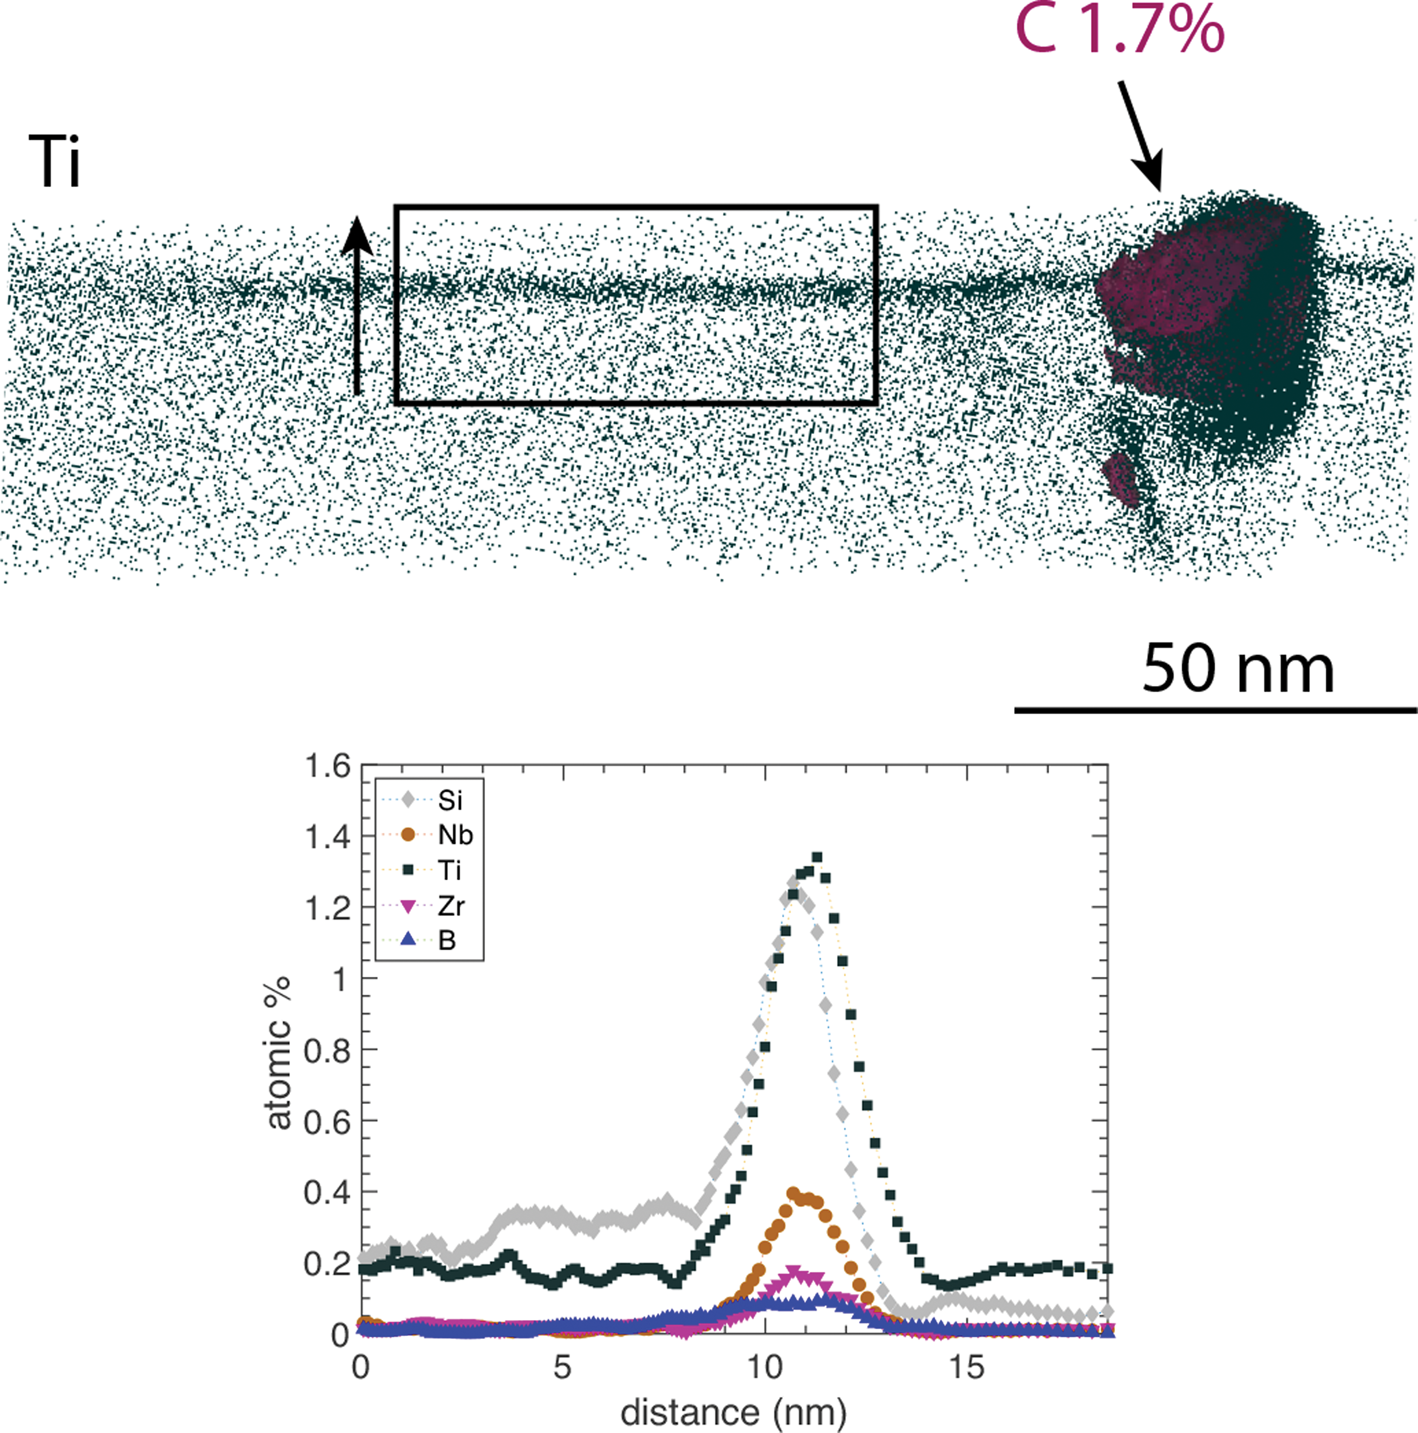
Fig. 12. A carbide in the 600°C exposed material, visualized by a C 1.7 at.% C iso-concentration surface, located at a grain boundary in the metal, aligned perpendicularly to the image plane. The full APT reconstruction is shown. The vertical arrow indicates the direction of the composition profile through the grain boundary.
The metal matrix composition, as measured by APT, was found to match the expected composition in terms of the Cr content, see Table 5. The Al content was somewhat lower than expected, possibly due to migration to the oxide (the bulk analysis was done within a micrometer of the oxide) or varying content within the material. Small amounts of Nb, Ti, and Zr were measured in the metal matrix (0.004 ± 0.003, 0.14 ± 0.04, and 0.008 ±0.005 at,%, respectively, where the error is the standard deviation between the four APT measurements used for composition determination).
Table 5. Metal Composition, From APT Analysis of the Material Exposed in 600°C, Given in at.%.

The error is the standard deviation between different analyses.
Discussion
In this paper, a detailed analysis of the oxides formed on a ferritic steel when exposed to lead at 600 and 750°C is presented. Here follows a discussion concerning the characterization of the oxide combining APT, TEM, and X-ray diffraction, as well as a few comments on the oxidation and corrosion properties of the material itself. The main focus of the discussion is the interpretation of the APT data, and the conclusions that can be made in combination with the other techniques.
APT Analysis of the Oxide Formed at 600°C
The oxide of a FeCrAl alloy exposed to lead at 600°C was successfully analyzed using APT. The cation composition corresponds well to the content as measured by STEM/EDX, except from the middle oxide layer that appears uneven in the EDX Cr-distribution, and thus possibly is overlapping with the inner and outer oxides in the TEM lamella, decreasing the Cr content in the EDX measurement. The correspondence between APT and EDX was generally good, despite the fact that green laser was used. It has been shown that a UV-laser gives a mass spectrum with lower background, fewer thermal tails and possibly fewer complex ions when analyzing oxides (Santhanagopalan et al., Reference Santhanagopalan, Schreiber, Perea, Martens, Janssen, Khalifah and Meng2015; Boll et al., Reference Boll, Unocic, Pint and Stiller2017). In the present study, this seems not to have had a significant influence on the measured compositions.
The outer oxides of both exposures are rich in Al and Fe and show a facetted surface (Supplementary Fig. S1). It was confirmed by diffraction that this oxide was Al2FeO4 spinel for the material exposed at 750°C, making it likely that the same oxide was formed also during exposure at 600°C. The phase constitution of the inner Al-rich oxide of the 600°C exposed alloy is unknown, but the 750°C material shows a combination of γ-Al2O3 and amorphous alumina.
The 51–54 at.% O in the oxides in the APT measurements (Table 4) can be compared with the possible phase Al2O3 containing 60 at.% O, and a spinel, M3O4, containing 57 at.% O. The O content of oxides is often observed to be too low when measured by APT (Maier et al., Reference Maier, Pfeiffer, Volkert and Nowak2016). This might be due to a large fraction of multiple events (leading to detector pile-up), evaporation of O as neutrals, and dissociation of evaporated molecules that can make the O content deviate from the expected value (Karahka & Kreuzer, Reference Karahka and Kreuzer2013; Liu & Stiller, Reference Liu and Stiller2013).
The possible presence of RE in the oxide is of interest. EDX could miss small quantities of RE as the number of counts in the spectra are limited due to the oxide being electron beam sensitive. APT can give compositions of trace elements with as low content as a few tens of ppm under favorable conditions. However, the peaks in the mass spectra of the 600°C formed oxide are wide, and there are some unidentified peaks, and with a number of possible molecular ions and overlaps, makes the mass spectrum evaluation complex, and thus, the detection limit is higher. Both Zr and Ti have a number of naturally occurring isotopes, giving them a distinct “fingerprint” in the spectra, which usually helps identification. Nb only has one naturally occurring isotope (93Nb) and is thus harder to distinguish from other peaks in the mass spectra. By experience and observations from other materials, which ions are usually found in oxides containing Ti, Zr, or Nb, the following ions are typical examples of what was looked for in the mass spectra: Ti+, Ti2+, TiO2+, TiO+,  ${{\rm TiO}_2}^+$, Zr2+, ZrO2+, ${{\rm ZrO}_2}^+$, Nb+, Nb2+, NbO+, NbO2+, and ${{\rm NbO}_2}^+$. Out of these, TiO2+ was observed in the mass spectrum (Fig. 9). TiO2+ overlaps with Nb3+ at 31 Da, but this peak is probably mostly TiO2+ due to that the natural abundance was matching this peak well, see Figure 9. The Ti found using EDX in the Al-rich layer of the 750°C exposed sample supports the possibility of the inner oxide containing Ti. Nb and Zr were not observed in this EDX spectrum, nor in the APT data of the oxide of the alloy exposed at 600°C.
Dependent on the solubility of Ti in γ-Al2O3, and in amorphous alumina, different locations of Ti would be expected. In the case of RE in an oxide that does not dissolve any RE, like α-Al2O3, the RE are expected to be found in grain boundaries, as previously observed by APT (Chen et al., Reference Chen, Reed and Marquis2014; Boll et al., Reference Boll, Unocic, Pint and Stiller2017; Unocic et al., Reference Unocic, Chen, Shin, Pint and Marquis2018; Vayyala et al., Reference Vayyala, Povstugar, Naumenko, Quadakkers, Hattendorf and Mayer2020). In the oxide formed on FeCrAl studied in this paper, the Ti atoms appear not to be distributed randomly, but not in boundary layers or oxide particles either. In the oxide of the material exposed at 750°C, we know that the oxide is partly γ-Al2O3, and probably partly amorphous. For the 600°C case, the crystal structure of the Al-rich oxide is unknown, but possibly it is amorphous to a larger degree due to the lower exposure temperature. If the alumina does dissolve some Ti, the atoms can be evenly distributed in this oxide layer. Another possibility is that the oxide does not dissolve that much Ti, but is nanocrystalline, containing these RE in the grain boundaries, similar to what was observed in a FeCrAl alloy exposed to high temperature (900–1,000°C) O2, H2O, and/or N2 (Mortazavi et al., Reference Mortazavi, Geers, Esmaily, Babic, Sattari, Lindgren, Malmberg, Jonsson, Halvarsson, Svensson, Panas and Johansson2018). However, the grains would have to be a few nanometers only for this to be a possibility, considering the observed Ti distribution.
APT Analysis of the Pb Particles
The Pb particles appear as ultra-thin discs parallel to the specimen surface in the APT reconstructions, but TEM supports that these actually are mostly spherical. The Pb particles are, thus, expected to have a much lower evaporation field than the oxide surrounding them. The Pb mostly evaporates as 2+ ions, although there are a few 1+ ions as well. No complex ions containing Pb were identified. Comparing the charge states with Kingham curves (Kingham, Reference Kingham1982), gives an indication that the field of the particles is close to the crossover of 1+ and 2+ ions, that is slightly higher than 20 V/nm. The field of the surrounding oxide is believed to be considerably higher than this, and 27 V/nm was used for the reconstruction. The applicability of the Kingham curves to laser-pulsed APT is, however, questionable. The fact that the Pb particles appear very flat indicates that all the Pb atoms from one particle were evaporated during a very short time span. Maybe the laser pulses even caused the small Pb particles to melt (the melting point of Pb is 600 K). It is not well known how nanometer-sized metallic particles in a nonconducting oxide are affected by the laser beam. In case the temperature increase of the Pb particles is high, the atoms are expected to evaporate easily, at a very low local field. The post-ionization, on the other hand, is mainly given by the field strength at a slightly larger scale, making it reasonable to obtain 2+ ions, even if the local field of the small particles might be lower than 20 V/nm.
Bursts of Pb and O in lead oxides (Pb(Ti,Zr)O3) observed by Kirchhofer et al. (Reference Kirchhofer, Diercks, Gorman, Ihlefeld, Kotula, Shelton, Brennecka and Green2014) indicate a low evaporation field also of lead oxide. In our case, O was not associated with the Pb particles. Furthermore, the Pb in the mass spectra of our materials did not evaporate as molecular ions including O (as was the case in the study by Kirchhofer et al.), supporting that the particles are metallic Pb rather than Pb oxide.
Pores
In the 750°C exposed material, the pores appearing in connection with the Pb particles are clearly visible in the TEM lamella, see Figure 2. In Figure 3, showing the 600°C material, there is some dark contrast around the largest Pb particles in the middle oxide layer in the HAADF image. The high-density volumes observed in the APT data are much smaller, and thus probably not possible to be observed in the TEM micrograph due to overlapping structures and a high density of small Pb particles in this part of the oxide. However, the occurrence of larger pores supports the interpretation of the high-density regions in the APT reconstructions as pores in the case of the smaller particles as well. The morphology seen in the STEM micrographs also supports the assumption that the Pb particles are solid, sitting inside the pore, rather than covering the inside of the pore as a shell or a hollow particle. Considering the size of the pores, Wang et al. (Reference Wang, Hatzoglou, Sneed, Fan, Guo, Jin, Chen, Bei, Wang, Weber, Zhang, Gault, More, Vurpillot and Poplawsky2020) observed that the size of the density variation volume within the APT reconstruction is similar to that of the pore in the oxide.
Open questions regarding the pores with Pb particles inside are their formation; when and why they are formed. Furthermore, it is possible that the pores impact the protectiveness and mechanical stability of the oxide. However, the effect is assumed to be small, as no spallation of the oxide was observed in the exposures.
Oxidation and Corrosion Properties
After exposure at 600°C for 1,008 h, the formed oxide is only around 100 nm thick with three identified layers. The outer facetted layer is rich in Al and Fe, which could be an Al2FeO4 spinel. The inner layer is an Al-rich oxide with small and distributed Pb particles and the middle layer is Cr-enriched with larger Pb particles. The Pb particles could have been encapsulated during the early stages of oxidation. The Cr-enriched oxide layer could represent the initial surface, assuming that the first oxide layer to be formed on the surface when the material is exposed is a mixture of Fe–Al–Cr oxides. The growth process would then be followed by an outwards growing spinel and an inwards growing Al-rich oxide. Similar observations were made by Ejenstam et al. (Reference Ejenstam, Halvarsson, Weidow, Jönsson and Szakalos2013) on FeCrAl materials exposed to liquid lead at 550°C.
The REs in the 10-4 alloy were mainly identified in carbides in the metal, in metal grain boundaries, and at the oxide/metal interface. Smaller amounts of Ti were found in the inner Al-rich oxide layer for both exposure temperatures. Previous work by Ejenstam et al. (Reference Ejenstam, Jönsson and Szakalos2017) showed that an excess amount of C in similar alloys as used in this study, promoted the formation of Cr-rich carbides at the surface, obstructing the formation of the Al-oxide. By balancing the RE addition with respect to the C content, the Cr-rich carbides could be suppressed and thus improving the oxidation properties. In this work, no Cr-rich carbides were identified but rather, small and distributed RE-carbides were observed. These RE-carbides are found throughout the metal substrate and are likely not disrupting the formation of the protective oxide. The different REs were identified at the metal–oxide interface, which could increase the adherence of the oxide by the so-called keying/pegging effect. While no clear evidence of any key-effect was noted in this work, the observation of such effect has previously been on the same type of 10-4 alloy (Dömstedt et al., Reference Dömstedt, Lundberg and Szakálos2020), as well as in other FeCrAl alloys with different RE additions (Golightly et al., Reference Golightly, Stott and Wood1976; Hindam & Whittle, Reference Hindam and Whittle1982; Nowok, Reference Nowok1982). It is also possible that RE oxides are formed at the surface, which operate as nucleation sites for continued oxide growth (Josefsson et al., Reference Josefsson, Liu, Svensson, Halvarsson and Johansson2005), as well as limiting void formation beneath the oxide during growth (Pint, Reference Pint1996).
When comparing the results from exposure of the same material at higher temperatures (800°C) in an earlier publication by Dömstedt et al. (Reference Dömstedt, Lundberg and Szakálos2020), the oxide was slightly thicker (up to 5 μm) than the one formed at 750°C (2 μm) studied here, but qualitatively similar. Both exposures resulted in an Al–Fe-rich top layer and an Al-rich inner oxide. The outer Al2FeO4 spinel was of similar total thickness in the two exposures (around 1 μm). However, the inner Al-rich oxide was thicker in the 800°C exposed material, which indicates a more favorable formation of the alumina.
In conclusion, the different characterization techniques used in this study worked well to complement each other for the nanoscale characterization of an oxide formed during exposure to liquid Pb at high temperatures. STEM gave a good overview of the oxide in the case of the thick oxide formed at 750°C, and TEM diffraction made it possible to identify phases. The X-ray scattering helped identifying the phases of the thick oxide. However, more details of the complex small-scale structure of the 600°C exposure oxide could be revealed using APT. The complex structure of the small pores surrounding the Pb particles was clearer in the APT data, as well as the local compositions in the different parts of the oxide.
Conclusions
In this paper, the detailed microstructure of a Fe–10Cr–4Al–RE alloy exposed to liquid lead (with 10−6 wt% O dissolved) at 600 and 750°C has been explored by TEM, APT, and X-ray diffraction. It was found that:
• It is possible to analyze the oxide using APT, and get the compositions of different layers, in good agreement with TEM/EDX data, although there are many overlap issues in the APT spectra due to mixed oxides containing both Al, Fe, and Cr.
• The alloy performs well at 600°C—after 1,008 h a 100-nm oxide layer has formed that protects the surface.
• At 750°C, a thicker oxide (2 μm) was formed after 1,970 h.
• For both exposures, there was an Al-rich inner oxide and an outer Fe–Al spinel formed.
• At 600°C, a middle layer containing Cr in addition to Fe and Al was found. APT revealed that the most abundant cation in this oxide layer is Cr.
• Inside the middle and lower part of the oxide, there are metallic Pb particles, in many cases surrounded by pore structures. These were possible to analyze with APT in the case of 600°C, where the pores were small.
Supplementary material
To view supplementary material for this article, please visit https://doi.org/10.1017/S1431927621000337.
Acknowledgments
Kanthal, part of Sandvik Group, is acknowledged for the production of the material. Dr. Olof Bäcke and Dr. Mohammad Sattari at Chalmers are acknowledged for assistance with TEM. Prof. Krystyna Stiller and Mr. Pratik Lokhande at Chalmers are acknowledged for fruitful discussions, and Dr. Michal Strach for help with the diffraction measurements. The characterization was performed at Chalmers Materials Analysis Lab (CMAL).
Financial support
This work was funded by the Swedish Research Foundation (VR) within project 2017-06458.


 Open access