


Introduction
Atom probe tomography (APT) provides 3D compositional (Miller & Forbes, Reference Miller and Forbes2009; Larson et al., Reference Larson, Prosa and Kelly2013; Gault et al., Reference Gault, Chiaramonti, Cojocaru-Mirédin, Stender, Dubosq, Freysoldt, Makineni, Li, Moody and Cairney2021), and sometimes crystallographic information (Gault et al., Reference Gault, Moody, Cairney and Ringer2012) from a material's microstructure with sub-nanometer resolution (De Geuser & Gault, Reference De Geuser and Gault2020; Jenkins et al., Reference Jenkins, Danoix, Gouné, Bagot, Peng, Moody and Gault2020). To enable field evaporation, the material of interest must be shaped into a sharp needle with a uniform geometry and a radius of curvature in the range of 100 nm at the tip. However, not all materials of interest are fully consolidated or solid. Many recent studies have sought to apply APT to porous materials (El-Zoka et al., Reference El-Zoka, Langelier, Botton and Newman2017; Mouton et al., Reference Mouton, Printemps, Grenier, Gambacorti, Pinna, Tiddia, Vacca and Mula2017; Barroo et al., Reference Barroo, Akey and Bell2019), nanoparticles (Li et al., Reference Li, Bagot, Christian, Theobald, Sharman, Ozkaya, Moody, Tsang and Smith2014; Yang et al., Reference Yang, Danaie, Young, Broadley, Joyce, Martin, Marceau, Moody and Bagot2019; Lim et al., Reference Lim, Kim, Aymerich Armengol, Kasian, Choi, Stephenson, Gault and Scheu2020), and materials with cracks (Meisnar et al., Reference Meisnar, Moody and Lozano-Perez2015) or voids (Wang et al., Reference Wang, Hatzoglou, Sneed, Fan, Guo, Jin, Chen, Bei, Wang, Weber and Zhang2020). Leaving these pores and cracks open introduces stress concentrators that make specimen preparation difficult and complicate the reconstruction of the analyzed specimens due to trajectory aberrations and premature fractures during analysis (Pfeiffer et al., Reference Pfeiffer, Erichsen, Epler, Volkert, Trompenaars and Nowak2015). To deal with this problem, the APT community has established the elimination of these pores/voids/cracks using foreign chemical methods, for instance, electrodeposition (El-Zoka et al., Reference El-Zoka, Howe, Newman and Perovic2018a; Kim et al., Reference Kim, Lim, Sahu, Kasian, Stephenson, Scheu and Gault2020), electron beam-induced deposition (Barroo et al., Reference Barroo, Akey and Bell2020), atomic layer deposition (Larson et al., Reference Larson, Giddings, Wu, Verheijen, Prosa, Roozeboom, Rice, Kessels, Geiser and Kelly2015), organic polymer resin deposition (Perea et al., Reference Perea, Liu, Bartrand, Dicken, Thevuthasan, Browning and Evans2016), and other physical or chemical vapor deposition methods (Felfer et al., Reference Felfer, Benndorf, Masters, Maschmeyer and Cairney2014, Reference Felfer, Li, Eder, Galinski, Magyar, Bell, Smith, Kruse, Ringer and Cairney2015; Taylor et al., Reference Taylor, Liu, Zhang, Arey, Kovarik, Schreiber, Perea and Rosso2019).
Although the surface of sputter-coated samples appears dense, this process cannot penetrate and efficiently fill voids within porous materials. Chemical vapor deposition from C-containing materials typically leads to nonhomogeneous field-evaporation conditions and highly complex mass spectra due to carbon-containing molecular ions (Nishikawa et al., Reference Nishikawa, Taniguchi, Watanabe, Yamagishi and Sasaki2006; Prosa et al., Reference Prosa, Kostrna Keeney and Kelly2010). The key challenge in designing a pore infiltration approach is devising a method that does not alter the chemistry and/or structure of the original material while ensuring maximum pore infiltration. This could be difficult for metals that tend to corrode or dissolve due to their relative reactivity, such as iron. The electrodeposition methods reported previously, with materials such as Cu and Ni from sulfate solutions, work for noble metal materials such as Au (El-Zoka et al., Reference El-Zoka, Langelier, Korinek, Botton and Newman2018b), Pt (El-Zoka et al., Reference El-Zoka, Langelier, Korinek, Botton and Newman2018c), and Pd (Kim et al., Reference Kim, Kang, Park, Seol, Ahn, Lee and Choi2018). However, with a reactive metal such as iron, electrodeposition of Cu and Ni will more likely result in dissolution of Fe due to galvanic replacement (Kim et al., Reference Kim, Kang, Park, Seol, Ahn, Lee and Choi2018), or lead to the formation of FeS on the surfaces during the negative polarization of the sample (Lyon, Reference Lyon2010).
Herein, we demonstrate the use of BiSnIn, a low melting point alloy known as Field's metal, for infiltrating porous Fe samples formed by direct hydrogen-gas reduction of a single iron oxide crystal. We drew inspiration from a previous report that demonstrated that the re-deposition of a fusible alloy enables the embedding of freestanding nanoparticles (Kim et al., Reference Kim, Lee, Ahn and Choi2019), and we devised a suitable infiltration method for porous transition metals. We used a heating stage inside the scanning electron microscope (SEM) to heat up the Field's metal and filled micron-sized pores inside of the FeO sample with the molten metal. Then, we used a cryogenically cooled stage during the focused ion beam (FIB) milling of a needle-shaped specimen suitable for atom probe from the Fe-Field metal composite. Cryo-FIB has recently proven advantageous for avoiding the ingress of Ga (Dantas De Morais et al., Reference Dantas De Morais, Chevalliez and Mouleres2014; Lilensten & Gault, Reference Lilensten and Gault2020), preserving specimen's compositions (Chang et al., Reference Chang, Lu, Guénolé, Stephenson, Szczpaniak, Kontis, Ackerman, Dear, Mouton, Zhong, Raabe, Gault, Zhang, Dye, Liebscher, Ponge, Korte-Kerze, Raabe and Gault2019; Rivas et al., Reference Rivas, Babayigit, Conings, Schwarz, Sturm, Manjón, Cojocaru-Mirédin, Gault and Renner2020), and preparing APT specimens from low melting point materials (Schreiber et al., Reference Schreiber, Perea, Ryan, Evans and Vienna2018; El-Zoka et al., Reference El-Zoka, Kim, Deville, Newman, Stephenson and Gault2020). By using this approach, we were able to successfully analyze the microporous, reduced iron that exhibits a bimodal pore distribution and obtain data on both the Fe and the filling material. APT analysis enables the identification of the structure and chemistry of the hydrogen-reduced Fe samples (Kim et al., Reference Kim, Zhang, Ma, Souza Filho, Schweinar, Angenendt, Vogel, Stephenson, El-Zoka, Mianroodi, Rohwerder, Gault and Raabe2021), including oxide inclusions, and provides a clear advantage in the identification of peaks in the mass spectra compared with C-based Pt or W precursors, for instance, that lead to a flurry of peaks as shown for instance in Barroo et al. (Reference Barroo, Akey and Bell2020). Our approach to APT sample preparation allows to measure the atomic-level chemistry of not only nanoporous materials but also different structural materials. For instance, by implementing this technique, the dopant content inside a hollow electrode for Li-ion batteries (Wang et al., Reference Wang, Zhang, Al-Mamun, Dou, Liu, Su, Wang, Zhang, Wang and Zhao2019; Liu et al., Reference Liu, Chen, Jiang, Zhao, Guo and Ma2020) or elemental distributions at a stress/corrosion-induced crack inside a metal can be investigated (Razmpoosh et al., Reference Razmpoosh, Langelier, Marzbanrad, Zurob, Zhou and Biro2021).
Materials and Methods
Materials
A piece of 5 × 5 × 0.5 mm single crystalline, (100)-orientated FeO (wüstite, MaTech) was sliced into four pieces and 20 g of the as-received Bi–In–Sn fusible alloy (Field's metal, Alfa Aesar) was cut into a 0.5 × 1.0 × 0.5 cm piece. The sliced wüstite was first fabricated into an APT specimen followed by running APT measurements. The same sliced wüstite was then reduced in an in-house designed furnace with pure dihydrogen gas with a flow rate of 30 L/h at 700°C for 2 h.
APT Specimen Preparation
For APT specimen preparation, we used an SEM-FIB FEI Helios Nanolab 600, equipped with a stage that can perform heating. The stage can also be cryogenically cooled by a cold gaseous nitrogen (Gatan C1001). Specimens from the wüstite before and after reduction were prepared using the lift-out protocol outlined in Thompson et al. (Reference Thompson, Lawrence, Larson, Olson, Kelly and Gorman2007). All scanning electron micrographs were taken at 30 kV and 1.6 nA. A final annular ion-beam milling process at 30 kV and 48 pA was performed. A Ga-contamination cleaning protocol at 5 kV was not done on the fabricated APT specimens since a cryo-prepared sample has less critical issue with Ga implementation due to the anticipated decrease in Ga penetration rate (Thompson et al., Reference Thompson, Lawrence, Larson, Olson, Kelly and Gorman2007; Lilensten & Gault, Reference Lilensten and Gault2020). Following heating to room temperature in the SEM-FIB, the APT specimens were taken out under ambient conditions and loaded inside a local electrode atom probe (LEAP) 5000 XS system (CAMECA). A specimen base temperature of 50 K, a pulse frequency of 100 kHz, a detection rate of 0.5%, and a pulse energy of 10 pJ were set for APT measurement. Cameca's Atom Probe Suite 6 was used for the 3D reconstructions and data analysis.
Results
Before and After H Reduction on a Single-Crystalline Wüstite
Figure 1a shows the morphology of the as-received wüstite sample. Following specimen preparation, the APT measurement was successful (Figs. 1b, 1c). The 3D atom map of a dataset from the wüstite is shown in Figure 1d. As expected, Fe and O are homogeneously distributed, and the atomic composition of Fe and O is 50.6 and 49.4 at%, respectively.

Fig. 1. Characterization on wüstite before and after H reduction. (a) Surface and (b) cross-sectional SEM images of as-received wüstite. (c) A final APT specimen of wüstite. (d) 3D atom map of wüstite from the acquired dataset. (e,f) Surface and (g) cross-sectional SEM images of as-reduced iron.
After the hydrogen reduction process of the wüstite, a sponge-like structure of iron is formed with large cracks and micron-sized open pores (Matthew et al., Reference Matthew, Cho and Hayes1990), as shown in Figures 1e–1g. In our preliminary trials, the standard lift-out method is no longer applicable to fabricate needle-shaped APT specimens from the reduced iron, since there are too many defects with a critical size within the specimen's failure. The specimen itself cannot stand its own weight during the Ga-ion annular milling process and mechanically fails. When a specimen survived the preparation, voids and cracks cannot tolerate the field evaporation and eventually result in early fracture of the specimen in the atom probe.
Encapsulation of Porous Sample with Bi–In–Sn Alloy and APT Specimen Preparation
To eliminate the risk of premature failures in APT measurement of porous reduced wüstite, the encapsulated specimen was fabricated as follows. First, the sliced fusible alloy is placed on a blank Si holder and tilted to 52° toward an e-beam column in the FIB to mill a clear pattern. Rectangular trenches (15 × 3 μm2) are milled till 10 μm in depths on the front and the back sides of the region of interest using a Ga-ion beam current of 2.8 nA at 30 kV. Because of ion-beam induced local heating and re-deposition, an uncontrollable milling behavior appears and, therefore, the trenches are uneven (Fig. 2a). The stage is then tiled back to 0° and the L-shape horizontal cut is made at the bottom of the lamella (Fig. 2b). The sample is lifted-out in situ using the micro-manipulator, and welding with Pt/C assisted by the Ga ion beam (Fig. 2c).

Fig. 2. A lifted-out Bi–In–Sn alloy and porous iron on a Cu clip before in situ heating and cooling process. (a) The Bi–In–Sn alloy before lift-out. (b) L-horizontal cut is made and a micro-manipulator is inserted to lift the lamella. (c) I-vertical cut releases the lamella from the bulk. (d) A prior trench on the Cu clip. (e) A manipulator with the sample attached is inserted. (f,g) The lamella is mounted on a Cu trench. (h) The porous Fe lamella is mounted on the top. (i) The stacked sample before heating process.
The sample is then dropped on to a commercial Cu clip (CAMECA). In order to prevent the spreading of the liquid metal droplet on the Cu clip, a trench (2 × 15 × 1 μm3) is milled as shown in Figure 2d. The lifted-out lamella is carefully attached on the side of the trench using FIB-Pt/C deposition (Figs. 2e–2g). Then, a lamella is lifted out of the reduced porous iron sample and the lamella is placed on top of the fusible alloy (Figs. 2h, 2i).
After the attachment, the Cu clip is taken out and the FIB stage is switched to the heating/cryo stage, and the sample remounted and imaged once again to ensure alignment. Using the temperature controller, the stage is heated up to melt the fusible alloy which has the melting point of 62°C. The lamella of the alloy gradually melts and subsequently becomes a droplet-like feature at 70°C (see Figs. 3a–3c). We let the liquid infiltrate the porous iron for approximately 5 min, and then the stage is cooled back down to room temperature.

Fig. 3. In situ experiment: (a–c) heating up to 70°C and (d–f) cooling back to 20°C.
Figures 3d and 3e show that cooling below the melting point of the fusible alloy leads to the solidification of the melt and the formation of a composite structure. The open micro-pores are filled with the Field's metal matrix. Figure 3f shows the cross-sectioning of the porous iron embedded in the fusible alloy matrix. The cross-sectional composite lamella is prepared with a lower ion-beam current (93 pA) to avoid potential melting. No open pores or cracks are observed in the SEM, and back-scattered electron (BSE) imaging showed no difference between the iron and the matrix (not shown here), indicating that the melted alloy filled the voids.
Kim et al. (Reference Kim, Lee, Ahn and Choi2019) reported uncontrollable Ga-ion milling behavior when the diameter of the fusible alloy is less than 1 μm due to the size-dependent reduction of the melting temperature; therefore, after the composite sample is mounted on a commercial Si micro-tip coupon, the stage is cooled to cryogenic temperature, at −190°C, to avoid the melting of the Field's metal within the needles (Fig. 4a). Figures 4b and 4c show the controlled ion milling, which is performed at 30 kV and 48 pA. Overall, with this approach, a porous sample difficult to analyze by APT was fabricated into a dense needle-shaped specimen suitable for APT.

Fig. 4. In situ cryogenic annular milling of the composite. (a) The specimen post is cooled down to cryogenic temperature. (b) After a rough annular FIB milling step. Inset shows BSE image of the specimen. (c) A final APT specimen milled at cryogenic temperature.
APT Analysis
Figure 5a shows the 3D atom map acquired from the reduced iron. The detected atomic composition is 99.87 at% Fe and 0.13 at% O, indicating that most of O were removed by the hydrogen reduction process, even in the middle of the Fe-ligaments. From the 2D contour map of Fe, calculated within the cyan, cuboidal region-of-interest, a clear pattern showing the (011) pole and (020) pole indicates that the reduced sample has a nonamorphous body-centered cubic structure that corresponds to α-Fe. No constituent elements of the fusible alloy are detected which implies that the liquid metal penetration does not proceed into the iron, as expected.

Fig. 5. (a) 3D atom map of the α-Fe sample. Pink dots represent reconstructed Fe atoms. Inset shows 2D desorption map histogram of Fe with crystallographic pole features. (b) Extracted atom map of impurity oxide region. Blue, red, and gray dots represent reconstructed O, Mg, and Ca atoms (a). (c) 3D atom map of the Bi–In–Sn alloy. Blue-gray, purple, and Green represent reconstructed Bi, In, and Sn atoms. Mass spectra from (d) the α-Fe and (e) the Bi–In–Sn alloy 3D atom maps.
Within the α-Fe, interestingly, an oxide particle is detected as shown in Figure 5b. Although the as-received sample was manufactured in a laboratory by the Czorlaski process, it still contained impurities such as Mg and Ca which are commonly known as gangue elements in an iron ore (Kim et al., Reference Kim, Zhang, Ma, Souza Filho, Schweinar, Angenendt, Vogel, Stephenson, El-Zoka, Mianroodi, Rohwerder, Gault and Raabe2021). In the α-Fe, these impurities are in a precipitate-like feature with a diameter of approximately 4 nm. During the H-reduction process, gangue oxide cannot be reduced and impurities that cannot be expelled from the metal at the reduction front are trapped inside the α-Fe, forming small particles. On the macro scale, CaO was reported to have no significant effect on the reduction kinetics (Turkdogan & Vinters, Reference Turkdogan and Vinters1971; Turkdogan et al., Reference Turkdogan, Olsson and Vinters1971), whereas reduction was found to be accelerated by MgO (Chen et al., Reference Chen, Zeilstra, van der Stel, Sietsma and Yang2019). Chemical probing and nanostructural analysis using APT could reveal the presence of these impurity oxides and provide valuable information helping to understand the effects of nanostructure and nanochemistry of the iron ores on the efficient production of greener steel.
It is reported that the Bi–In–Sn alloy has three distinctive phases, namely BiIn2, In2Sn9, and In3Sn. Here, in Figure 5c, the 3D atom map of the fusible alloy shows a homogeneous elemental distribution and the composition is 91.92, 8.06 and 0.02 at% for Sn, In, and Bi, respectively, which corresponds to the In2Sn9 phase. Within the matrix, no iron-related peak nor impurities oxide peaks from the porous iron are detected, allowing us to confirm that no galvanic replacement happened during the sample preparation.
Even though no low energy Ga cleaning was performed for these specimens, the α-Fe and the Field's metal contain less than 0.16 and 0.25 at% Ga, respectively. The Ga implantation was reported to be low, owing to the low temperatures used during final stages of sample preparation. The interaction and diffusion rate of Ga into the specimen are decreased at lower temperatures (Lilensten & Gault, Reference Lilensten and Gault2020).
Summary and Discussion
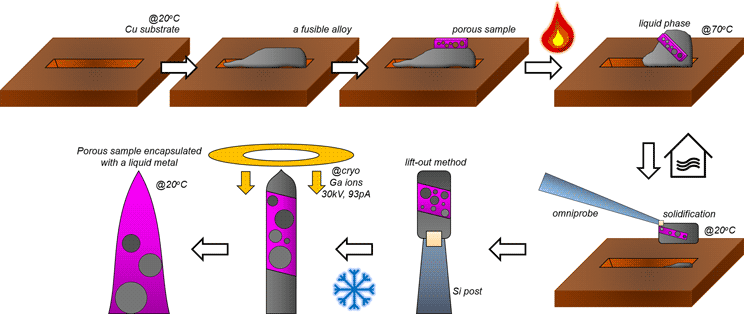
To summarize, the overall process for filling voids in porous materials using fusible alloys are schematically shown in Figure 6. First, a trench was milled on the Cu clip to load the lifted-out fusible alloy and subsequently, the porous material. The lift-out process was performed according to Miller et al. (Reference Miller, Russell, Thompson, Alvis and Larson2007) and Thompson et al. (Reference Thompson, Lawrence, Larson, Olson, Kelly and Gorman2007). The stage temperature was first raised up to 70°C in order to melt the fusible alloy. After the stacked samples are mixed into a single composite, the stage is cooled down to room temperature. After solidification of the molten metal, a region of interest was extracted using the micromanipulator and attached to a Si support using ion-beam induced Pt/C deposition. Once the sliced samples were attached onto the pillar, the stage was cooled down to cryogenic temperature (approx. −190°C) to avoid ion-beam induced melting of the Field's metal.

Fig. 6. A schematic illustration of encapsulation of porous sample in a fusible alloy.
The combination of in situ FIB heating and cooling, combined with a liquid metal yields a versatile approach to infiltrate and encapsulate micro-to-nanoporous materials, thus enabling APT measurement successfully. An advantage of this method is that the encapsulating material is conductive. According to Seol et al. (Reference Seol, Kwak, Kim and Park2016), the surface modification from the conductive layer coating improves the overall evaporation sequences. Unlike ceramic coating approaches (Sundell et al., Reference Sundell, Hulander, Pihl and Andersson2019; Webel et al., Reference Webel, Weber, Vardo, Britz, Kraus and Mücklich2021), a high quality data could be acquired here because a fusible alloy has relatively high thermal (0.19 W/cm °C) and electrical conductivity (0.57 nΩ m) which allows to dissipate the energy and electrons quickly to the base of the specimen (Lipchitz et al., Reference Lipchitz, Harvel and Sunagawa2015). This can explain the high (3:3) success rate of sample preparation in this investigation, with over 10 million ions collected for each specimen, and without premature or micro-fractures. A difficulty with this protocol is to position the material of interest toward the specimen's apex, otherwise only the matrix is collected during the atom probe measurement.
Development and use of other low melting point alloys for encapsulation could be very beneficial to further optimize this method. One of the main criteria to be taken into consideration is that none of the metals in the alloy are miscible with the material to be analyzed. This was the case for Fe and BiSnIn (von Goldbeck, Reference von Goldbeck1982a, Reference von Goldbeck1982b, Reference von Goldbeck1982c). The melting point of BiSnIn is also suitable in our case so as not to coarsen the porous structure. We imagine that a dip-coating process can be performed for aggregated powder in the future using a suitable liquid metal. After lifting the interested lamella, the sample can be immersed in a preheated liquid metal and it allows penetrates pores or spaces inside (see Fig. 7).

Fig. 7. A modified encapsulating approach for a porous nanomaterial using a liquid metal.
To preserve the initial state of nanoporous materials, nonchemical interaction and low-temperature range operation should be considered in APT sample preparation. For example, an Au nanoporous metal is sensitive to heat and when the temperature increases, its structure changes due to coarsening (Hakamada & Mabuchi, Reference Hakamada and Mabuchi2009; El-Zoka et al., Reference El-Zoka, Howe, Newman and Perovic2018a). The well-known atomic layer deposition encapsulation technique could not be applied in such a system since its operating temperature is often above 200°C (Johnson et al., Reference Johnson, Hultqvist and Bent2014) and introduces carbon contaminants from organic precursors that could change the evaporation field of the specimen and the chemical composition analysis (Choi et al., Reference Choi, Lyons, Janotti and Van de Walle2013).
Conclusion
Due to the difficulty of applying APT to porous materials, their near-atomic-scale compositional distribution remains elusive. We have demonstrated a new method for preparing APT specimens from a sample containing micro- to nanopores. A sponge-like iron sample prepared by hydrogen reduction from a single crystal of wüstite was infiltrated and embedded in a fusible Bi–In–Sn alloy. The complete encapsulation was achieved by melting and solidifying the alloy using an in situ SEM-FIB. No corrosion or dissolution in the sample was observed during the sample preparation and high-quality APT data were collected. This approach allows to explore a variety of porous materials using APT, including noble metals such as nanoporous Au but also nanoporous W, Re, Mo, and Raney Ni. There is also a range of fusible alloys (e.g., eutectic Ga–In alloy) beyond Field's metal (Yatsenko et al., Reference Yatsenko, Sabirzyanov and Yatsenko2008; Chang et al., Reference Chang, Guo, Sun, Wang, Hou, Wang, Rao and Liu2018) that could be used depending on the melting point and susceptibility to cause corrosion. To conclude, liquid metal encapsulation makes a range of complex nanostructured materials amenable to APT analysis.
Acknowledgments
The authors are grateful to Uwe Tezins, Andreas Sturm, and Christian Broß for their support to the APT and FIB facilities. We also thank Dr. Xue Zhang, Dr. Michael Rohwerder, and Dr. Dierk Raabe for providing samples and collaborating on the direct-hydrogen reduction of iron ore project. S.-H.K., A.E.-Z., and B.G. acknowledge financial support from the ERC-CoG-SHINE-771602.


 Open access