


Introduction
Atom probe tomography (APT) is a 3D compositional mapping technique used to examine the chemical structure of materials with a sensitivity in the range of ppm and with subatomic resolution of ~0.2 nm. For more information about the development of APT and its physical principles, the reader is referred to recent textbooks (Kelly et al., Reference Kelly, Camus, Larson, Holzman and Bajikar1996; Tsong, Reference Tsong2005; Gault, Reference Gault2012; Larson, Reference Larson2013; Miller & Forbes, Reference Miller and Forbes2014; Lefebvre-Ulrikson et al., Reference Lefebvre-Ulrikson, Vurpillot and Sauvage2016). Through the introduction of laser-assisted field desorption, APT broken through several material boundaries and broadened the range of its application, even though the complexity of the data and observed artifacts has increased simultaneously.
Especially the emergence of focus ion beam (FIB) instruments as a standard tool for sample preparation (Prosa & Larson, Reference Prosa and Larson2017), extend the application range in comparison to the more classical sample preparation methods like electrochemical processes (Marquis et al., Reference Marquis, Bachhav, Chen, Dong, Gordon and McFarland2013; Devaraj et al., Reference Devaraj, Perea, Liu, Gordon, Prosa, Parikh, Diercks, Meher, Kolli, Meng and Thevuthasan2018; Hawkes & Spence, Reference Hawkes and Spence2019). Semiconductors (Rigutti et al., Reference Rigutti, Bonef, Speck, Tang and Oliver2018) and biomineral materials (Gordon & Joester, Reference Gordon and Joester2011; Gordon et al., Reference Gordon, Tran and Joester2012, Reference Gordon, Cohen, MacRenaris, Pasteris, Seda and Joester2015; La Fontaine et al., Reference La Fontaine, Zavgorodniy, Liu, Zheng, Swain and Cairney2016; Langelier et al., Reference Langelier, Wang and Grandfield2017; Sundell et al., Reference Sundell, Dahlin, Andersson and Thuvander2017) could be assessed regularly. The ongoing innovation process allowed the measurement and analysis of polymers and biological materials, such as poly(3-alkylthiophene) (Kelly et al., Reference Kelly, Nishikawa, Panitz and Prosa2009; Prosa et al., Reference Prosa, Keeney and Kelly2010) and biomolecules deposited via adhesion on aluminum support tips (Rusitzka et al., Reference Rusitzka, Stephenson, Szczepaniak, Gremer, Raabe, Willbold and Gault2018), ferritin embedded in epoxy resin (Perea et al., Reference Perea, Liu, Bartrand, Dicken, Thevuthasan, Browning and Evans2016) or immunoglobulin (IgG) embedded in a silica glass matrix (Sundell et al., Reference Sundell, Hulander, Pihl and Andersson2019), and for example mammalian cells fixed between gold layers (Narayan et al., Reference Narayan, Prosa, Fu, Kelly and Subramaniam2012). But the class of “soft matter” and liquids, in general, is still a wide open field, having tremendous questions to be answered and hurdles to be overcome.
The development of cryogenic transfer suitcases, which allow the transport of actively cooled samples between different analytical instruments under vacuum conditions, laid the foundation for the analysis of frozen samples (Schreiber et al., Reference Schreiber, Perea, Ryan, Evans and Vienna2018; Stephenson et al., Reference Stephenson, Szczepaniak, Mouton, Rusitzka, Breen, Tezins, Sturm, Vogel, Chang, Kontis, Rosenthal, Shepard, Maier, Kelly, Raabe and Gault2018; El-Zoka et al., Reference El-Zoka, Kim, Deville, Newman, Stephenson and Gault2020; Perea et al., Reference Perea, Schreiber, Ryan, Wirth, Deng, Lu, Du and Vienna2020; Qiu et al., Reference Qiu, Garg, Zhang, Chen, Li, Taylor, Marceau and Fu2020a, Reference Qiu, Zheng, Garg, Chen, Gervinskas, Li, Dunstone, Marceau and Fu2020b, Reference Qiu, Zheng, Zhou, Dong, Shi, Garg, Cheng, Marceau, Sha and Fu2020c; Schwarz et al., Reference Schwarz, Weikum, Meng, Hadjixenophontos, Dietrich, Kästner, Stender and Schmitz2020, Reference Schwarz, Dietrich, Ott, Weikum, Lawitzki, Solodenko, Hadjixenophontos, Gault, Kästner, Schmitz and Stender2021; Stender et al., Reference Stender, Gault, Schwarz, Woods, Kim, Ott, Stephenson, Schmitz, Freysoldt, Kästner and El-Zoka2021). Consequently, various new approaches and preparation routes were developed, providing a further step toward the reliable analysis of frozen liquids (Stender et al., Reference Stender, Gault, Schwarz, Woods, Kim, Ott, Stephenson, Schmitz, Freysoldt, Kästner and El-Zoka2021).
Recently, we demonstrated the preparation and analysis of bulk frozen liquids with the example of water tips (Schwarz et al., Reference Schwarz, Weikum, Meng, Hadjixenophontos, Dietrich, Kästner, Stender and Schmitz2020) and a saturated glucose solution (Schwarz et al., Reference Schwarz, Dietrich, Ott, Weikum, Lawitzki, Solodenko, Hadjixenophontos, Gault, Kästner, Schmitz and Stender2021). Quite extended datasets of frozen liquids allow a fundamental study of the evaporation and fragmentation behavior of liquids, hopefully, in the future, also leading to reliable studies of biological samples using liquids as an embedding matrix, studies of catalytic reactions at liquid/solid interfaces or interfaces in emulsions and wet corrosion mechanism. In addition to aqueous solutions, the class of carbon organic solvents attracts further investigations, especially in order to improve our understanding of the evaporation and fragmentation behavior of simple carbon compounds in a high electric field. For the most part, all organic compounds are composed of carbon atoms; therefore, it is important to characterize their evaporation behavior as a prerequisite for the investigation of more complex systems.
Alkane or paraffin consists of only carbon and hydrogen. In this category, n-alkane reveals the simplest linear structure and, due to its nonpolar nature, it is clearly different from the polar medium water. Moreover, the main construction element, the C–C chain bond, frequently exists in many polymers. Therefore, the investigation of n-alkane should help to gain a general understanding of the fragmentation of polymeric material during field evaporation and could help to determine patterns and field dependence in complex mass spectra, as have already been observed from polypyrrole (Nishikawa & Kato, Reference Nishikawa and Kato1986), poly(3-alkylthiophene)s (Kelly et al., Reference Kelly, Nishikawa, Panitz and Prosa2009; Prosa et al., Reference Prosa, Keeney and Kelly2010), and self-assembled monolayers (Gault et al., Reference Gault, Yang, Ratinac, Zheng, Braet and Ringer2010; Stoffers et al., Reference Stoffers, Oberdorfer and Schmitz2012; Dietrich et al., Reference Dietrich, Schuldt, Born, Solodenko, Schmitz and Kästner2020). This knowledge is a key point when continuing the analysis of organic compounds and more complex biological samples.
Independent studies of n-alkane under different conditions have reported already a fragmentation and decomposition behavior. Watanabe et al. (Reference Watanabe, Tsukagoshi, Hirakoso, Adschiri and Arai2000) discovered that n-hexadecane (n-C16) decomposed into predominantly n-alkanes and 1-alkene at 673–723 K in a high-pressure batch-type reactor. In the mass spectroscopy study of Lavanchy et al. (Reference Lavanchy, Houriet and Gäumann1979), the authors reported the decomposition of n-hexane (n-C6), n-nonane (n-C9), and n-tetradecane (n-C13) by electron impacts. This was caused either by the direct C–C bond cleavage or the secondary olefin loss from an alkyl cation. Kawashima & Iwamoto (Reference Kawashima and Iwamoto2016) observed the decomposition of n-octane (n-C8) into small alkanes or alkenes at near room temperature on highly oriented pyrolytic graphite surfaces, which was assumed to act as a catalyst.
Recent cryo-APT studies focused on pure water (Schwarz et al., Reference Schwarz, Weikum, Meng, Hadjixenophontos, Dietrich, Kästner, Stender and Schmitz2020) and deuterium oxide (El-Zoka et al., Reference El-Zoka, Kim, Deville, Newman, Stephenson and Gault2020) or aqueous solutions (Schwarz et al., Reference Schwarz, Dietrich, Ott, Weikum, Lawitzki, Solodenko, Hadjixenophontos, Gault, Kästner, Schmitz and Stender2021). Especially in the latter one, the importance of a profound knowledge about the basic evaporation and fragmentation behavior of linear alkane chains was emphasized. In the present study, the fragmentation behavior of carbohydrate chains when field-evaporated out of a quench-frozen liquid of tetradecane in a high electric field is presented.
Experimental
Materials and Methods
Nearly pure n-tetradecane (>99% Sigma-Aldrich), which is a colorless liquid at room temperature, was used as basic material. According to the protocols developed for the analysis of water (Schwarz et al., Reference Schwarz, Weikum, Meng, Hadjixenophontos, Dietrich, Kästner, Stender and Schmitz2020), tungsten wires with a diameter of 50 μm were placed into liquid nitrogen (−190 °C) and fractured by the application of a tensile force. This created rough fracture surfaces that have proved to be especially useful for wetting and freezing a droplet on top of it. Using a micropipette, a droplet was dipped onto a precooled tungsten post, which itself is located in a liquid nitrogen bath. A droplet of 90–150 μm in diameter is created on top of the post. Subsequently, the sample is transferred into a modified cooled transfer shuttle VCT500 from Leica (T = −184 °C) and pumped to a pressure of 6 × 10⁻¹ mbar. A following freeze etching process is carried out in a high-vacuum coater (Leica EM ACE600) in order to remove ice crystals that were formed by contact of the frozen droplet with ambient moisture during the initial pump process. This “freeze etching” was performed at a temperature of −90 °C and a residual pressure of 9 × 10⁻⁷ mbar for 30 min (Schwarz et al., Reference Schwarz, Weikum, Meng, Hadjixenophontos, Dietrich, Kästner, Stender and Schmitz2020, Reference Schwarz, Dietrich, Ott, Weikum, Lawitzki, Solodenko, Hadjixenophontos, Gault, Kästner, Schmitz and Stender2021; Stender et al., Reference Stender, Gault, Schwarz, Woods, Kim, Ott, Stephenson, Schmitz, Freysoldt, Kästner and El-Zoka2021).
At the same time, the pressure in the transfer unit is improved sufficiently so that the transfer into the FIB becomes possible for further processing. The FIB dual-beam microscope is equipped with a custom-made cryo stage, which is cooled to a temperature of −150 °C by flexible copper bands connected to a dewar filled with liquid nitrogen.
SEM imaging of the frozen tetradecane was performed at low energy (5 kV and 50 pA) and minimized exposure time to protect the sample from excessive electron bombardment and thus preventing it from melting.
For the tip sharpening, we first used a circular pattern with a standard azimuthal milling process (Prosa & Larson, Reference Prosa and Larson2017) down to a radius of 50 μm. The initial voltage and current of the Ga ion beam were set to 30 kV and 15 nA. The ion beam current was gradually reduced while decreasing the inner diameter of the circular pattern.
We initially continued the conventional annular milling procedure (Prosa & Larson, Reference Prosa and Larson2017) to the final nanometric radius. However, these attempts produced hollow cone-shaped specimens. It is assumed that the material inside the cylinder evaporated and so left a hollow cylinder (see Fig. 1c). This problem showed up frequently in the step when the column diameter was reduced to below 50 μm with annular milling. The origin of this phenomenon is unclear. A first explanation could point to the low thermal conductivity of n-alkanes in relation to water. Instead of using azimuthal milling patterns, rectangles were arranged tangentially around the post to be cut and processed serially, as depicted in Figure 1b, which avoids this issue.
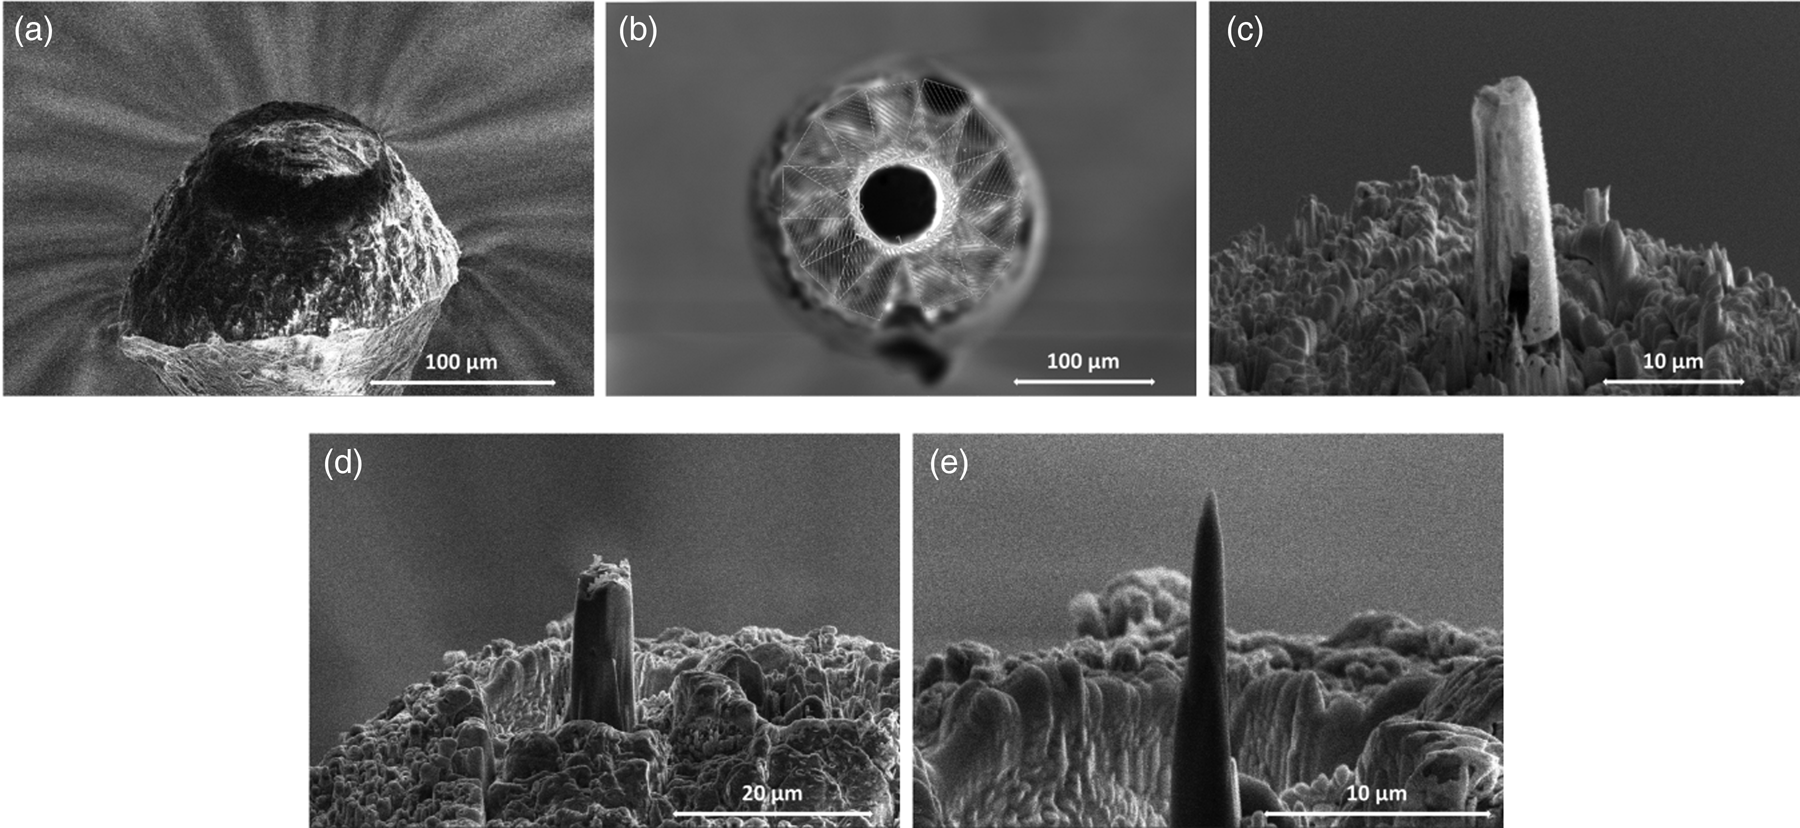
Fig. 1. (a) SEM imaging of n-tetradecane droplet before the preparation process. (b) Instead of using azimuthal milling patterns, rectangles were arranged tangentially around the post to be cut and processed serially. (c) Showing the produced hollow cone shape material. (d) Intermediate state during the milling process. (e) Final APT specimen after the milling process performed with an annular pattern and a decreasing inner diameter and current until the radius is less than 300 nm.
To monitor the shaping process, only few snapshots were taken to avoid melting of the sample. The shaping process was performed until the radius of the acicular sample was below 300 nm (Fig. 1e). Afterward, the finished APT tip was transferred back into the shuttle system and transferred into the atom probe.
APT Analysis and Reconstruction
The presented data in this article were obtained by using a custom-made atom probe (Schlesiger et al., Reference Schlesiger, Oberdorfer, Würz, Greiwe, Stender, Artmeier, Pelka, Spaleck and Schmitz2010) with a laser operating at a wavelength of 355 nm, a pulse length of 250 fs, and a spot size of 50 microns. The atom probe is equipped with a 120 mm delay line detector system and an open area ratio of 50%. A custom-made cryo transfer port was adapted to the atom probe to enable the transfer of frozen samples through the Leica VCT 500 shuttle system. The resulting datasets were analyzed using the SCITO (Stender & Balla, Reference Stender and Balla2021) software package. Multiple measurements (seven), with tip lengths of above 10 μm and sharp apex radii of <100 nm (Fig. 1e), were made with at least 30 million atoms per dataset. The first 10 million atoms were cropped to exclude misinterpretation from Ga or other residue contaminations of the preparation process. The experimental conditions were chosen in the following way. The laser power was adjusted to 15 mW at a repetition rate of 100 kHz, which is equal to a pulse energy of 150 nJ. The base temperature was set to 55 K. The evaporation rate was adjusted to a atoms per pulse ratio of 0.8%, which corresponds to 800–900 atoms/s. With these conditions, the highest success rate was achieved while keeping the number of multihit events to a reasonably low fraction. The resulting datasets were reconstructed based on the original point projection protocol following Bas et al. (Reference Bas, Bostel, Deconihout and Blavette1995) with the geometric reconstruction boundary conditions by Jeske et al. (Reference Jeske and Schmitz2001).
Results
Analysis of the Mass Spectra
All measurements revealed a steadily increasing voltage curve (voltage plotted against the measuring time) without abrupt changes, a constant evaporation rate with a largely homogeneous detector image, and a minimum number of 30 million events.
The mass spectra revealed a complex evaporation and fragmentation behavior (Fig. 2). In total, 92 peaks could be identified and assigned. Assuming a pure tetradecane solution, the multiplicity of observed peaks must be described by simple alkane combinations of CxHy.
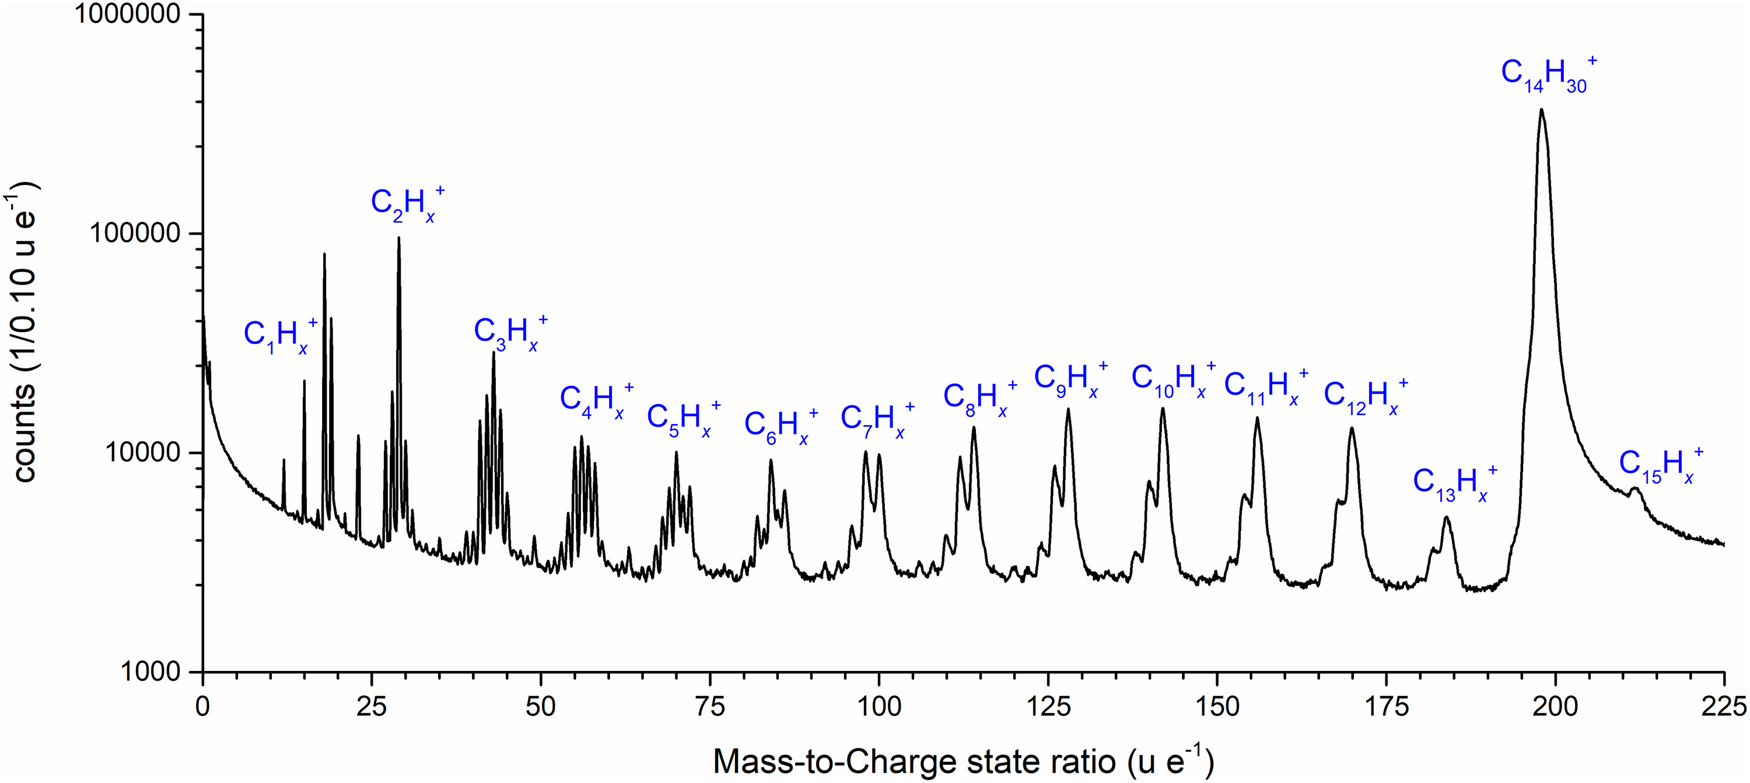
Fig. 2. Mass spectrum of n-tetradecane with a mass-to-charge state ratio from 0 to 225 u/e as a logarithmic plot. The molecule sequences of C1–15Hx are labeled.
However, peaks occurring at m/q = 18 and 19 u/e, could be also interpreted as H2O+ and H3O+ rather than C32+ and C3H22+, since water appears in many measurements as an impurity contribution. The high purity of the tetradecane that we used and the fact that we omitted the first 10 million atoms make the measurement of water less probable. The interpretation as water peaks leads to a constant water fraction of 6.9 at%, which is, to our experience, too high to simply be explained by the residual water content in the measurement chamber. Thus, the interpretation by doubly charged hydrocarbons would be more consistent, and the existence of C32+ clusters was described in earlier work by Peng et al. (Reference Peng, Zanuttini, Gervais, Jacquet, Blum, Choi, Raabe, Vurpillot and Gault2019).
All other peaks can safely be identified by alkane-related molecule fragments starting from the methane group C1Hx to the pentadecane C15Hx group. Remarkably, the highest intensity is detected at m/q = 198 u/e, which corresponds to the full-length molecule. The fraction of detected full chain n-tetradecane contributes to 73% of all events. Only about one-fourth of the detected events represent smaller fragments. Among the fragmented peaks from the methane (C1) to the tetradecane (C13) group, a striking variation of the internal structure of the mass peaks is noticed, which subdivides the peak groups into three categories. For the first range from C1 to C3, the highest peaks at m/q = 15, 29, and 43 u/e can be identified to CnH2n+1+ with n = 0–3, that is, alkyl chains having lost one hydrogen. Similar distributions have already been observed in various measurements of polymer layers (Kelly et al., Reference Kelly, Nishikawa, Panitz and Prosa2009; Prosa et al., Reference Prosa, Keeney and Kelly2010) or of dissolved glucose molecules in an aqueous solution (Schwarz et al., Reference Schwarz, Dietrich, Ott, Weikum, Lawitzki, Solodenko, Hadjixenophontos, Gault, Kästner, Schmitz and Stender2021). In the range between C4 and C7, the highest peak of the group occurs at m/q = 56, 70, 84, and 98 u/e, which corresponds to the molecular formula of C4+nH8+2n, an alkyl having lost two hydrogen atoms. Finally, between C8 and C15, the highest peak occurs with the molecular formula of C8+nH18+ 2n, which represents a complete alkyl chain.
Caused by the limited mass resolution power m/Δm of the short straight flight path geometry of the instrument, the produced signals are increasingly overlapping with increasing mass, resulting in convoluted signals. At higher masses, only three peaks in a single family of peaks are visible. From C14 and above, only one single peak can be identified.
Interestingly, with m/q = 212 u/e, a mass signal appears beyond the available full chain mass of 198, which can be identified as pentadecane C15. Aside from the trivial explanation of impure molecular mass content, the existence of this peak group may evidence that the field evaporation process of n-alkane molecules not only involves the fragmentation of alkane chains, but also a recombination of molecular fragments in the high field is possible, which has been previously proved (Brian & Mitchell, Reference Brian and Mitchell1990; Table 1).
Table 1. Abundance of Different C1–14Hx Fragments.
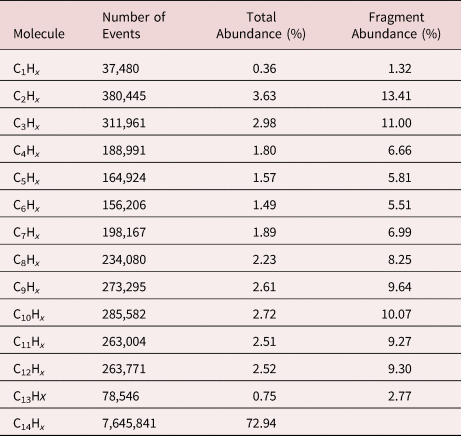
To verify the peak interpretation, the elemental ratio of carbon to hydrogen was calculated. For this purpose, a baseline correction was performed. All peaks were identified, integrated, and subsequently split into their elemental constituents.
Different approaches were tested for this. In the first approach, the majority signal n-tetradecane (73%) is included and not surprisingly, the overall resulting composition is very close to the theoretical C/H ratio of tetradecane. In a second approach, however, only the fragmented molecules are considered, and also, in this case, the calculated ratio deviates by only 0.11% from the expected value. This confirms that the suggested peak identification is probably correct (Table 2).
Table 2. Different Approaches for the Calculation of the C/H Ratio.

Volume reconstructions of the datasets were performed following the above-described molecule interpretation (Fig. 3). Considering the individual molecules in the reconstructed volume, no significant inhomogeneity is observed, which implies a controlled evaporation of the fragments from the surface of the tip, with constant evaporation field.
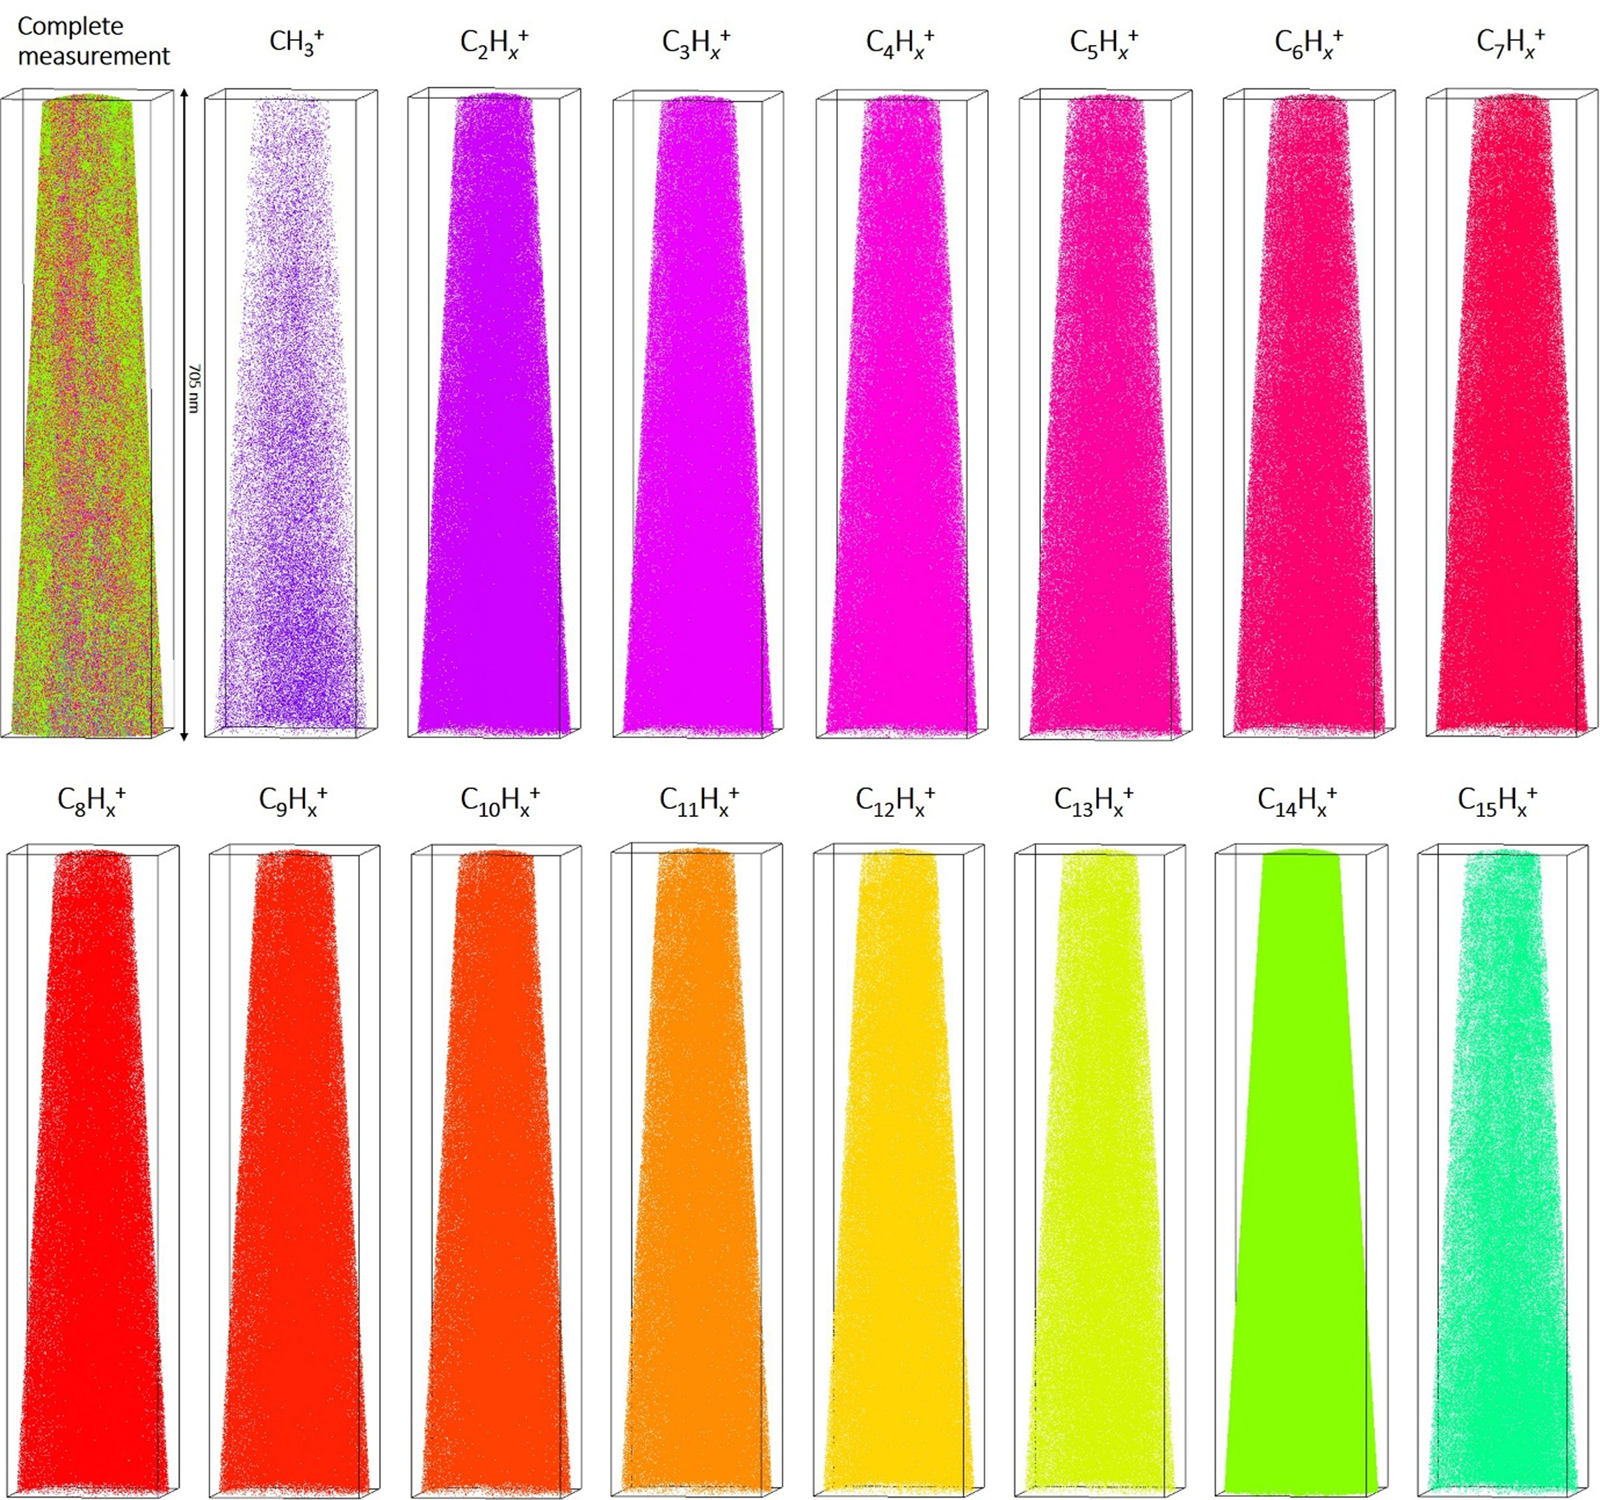
Fig. 3. Representative 3D reconstruction of the measured volume of a frozen tetradecane sample with a total length of 705 nm. Individual maps of the reconstructed volume for the most common molecule sequences C1–15Hx are shown.
The total desorption map in Figure 4 displays slight local fluctuations for the individual molecule fragments, especially for larger fragments. Localized areas can be detected by a one-third higher number of events per voxel than the average value. The desorption maps of single prominent events (Figs. 4b–4e) and different carbohydrate chains of Figures 4f–4r exhibit no dependence on the laser incidence direction. The angle of incidence of the laser relative to the maps shown is 45° from the upper right corner (indicated by a red line).
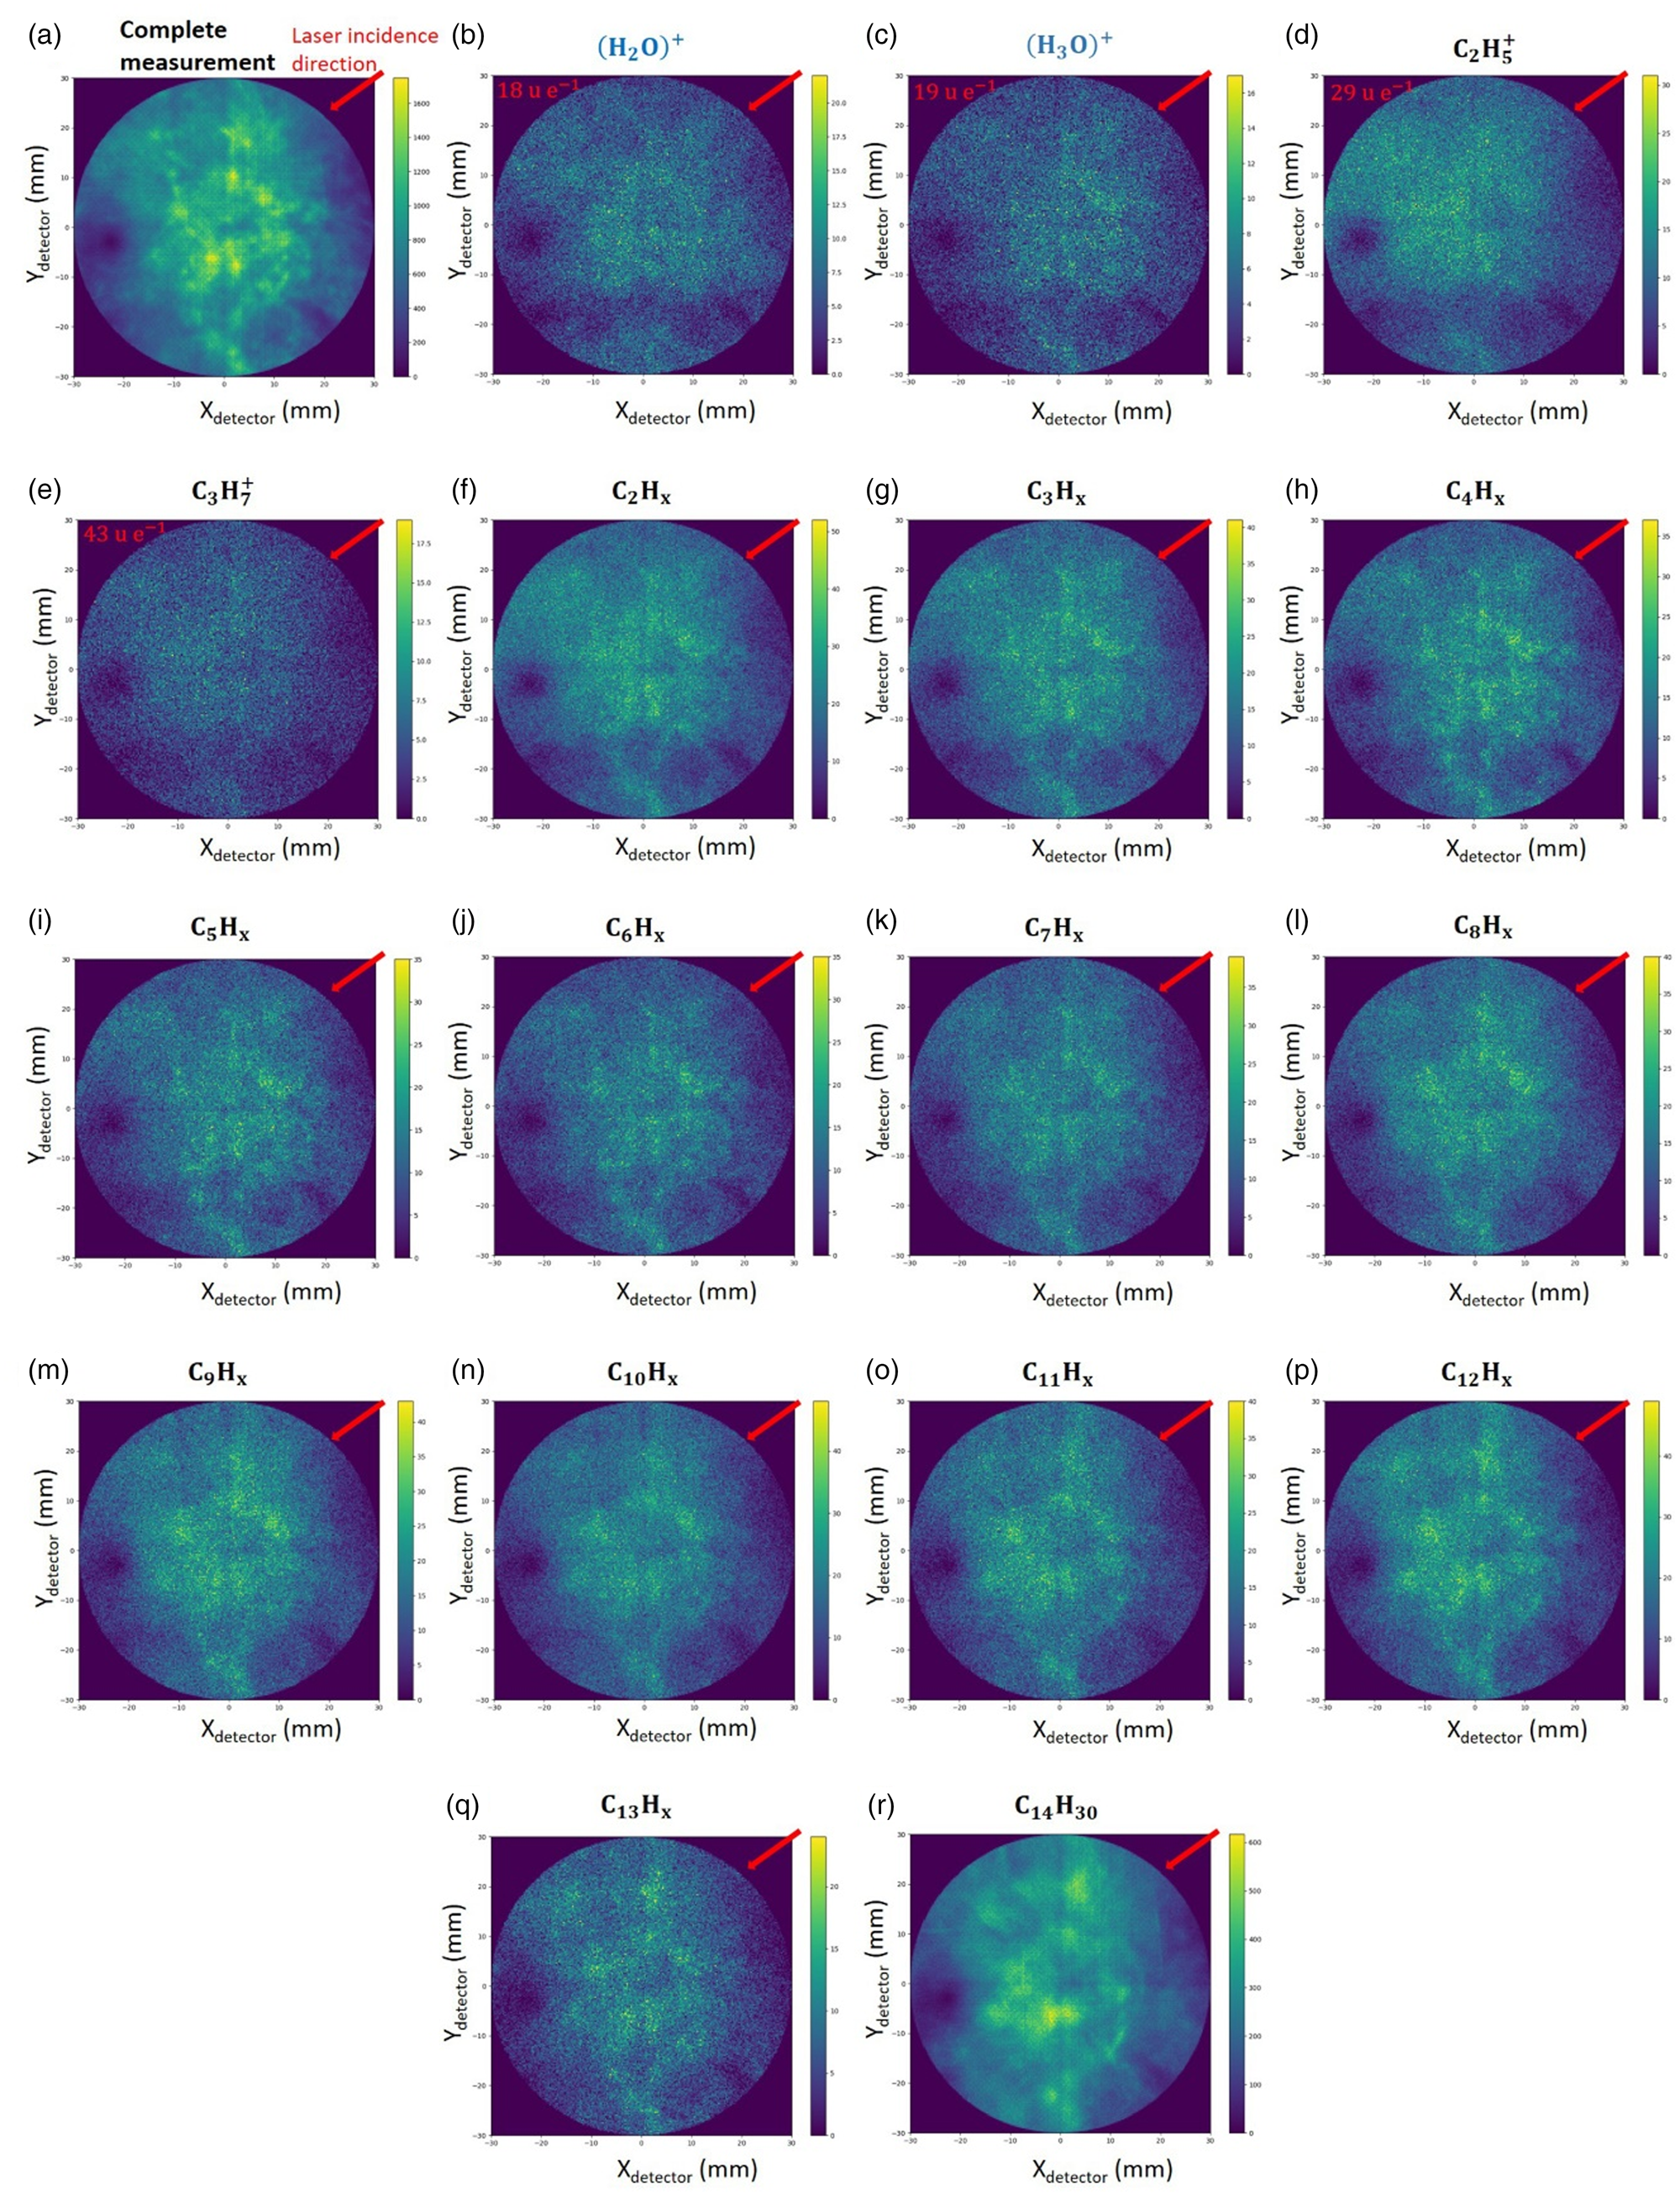
Fig. 4. Desorption maps of (a) all events of a representative measurement, and (b–r) of selected ions as labeled.
Discussion — Correlation Analysis
Preferably, the evaporation rate is adjusted to detect ideally one species per pulse to avoid problems with the event identification and to reduce the loss due to the detector dead time. Nevertheless, at least in a small fraction of the pulses, a multiplicity of detector signals is detected that indicates the arrival of several molecular fragments. These are called multihit events, which are further consecutively numbered with double, triple, or quadruple depending on the total number of detected fragments per pulse (Yao et al., Reference Yao, Gault, Cairney and Ringer2010; Saxey, Reference Saxey2011; Peng et al., Reference Peng, Vurpillot, Choi, Li, Raabe and Gault2018). The physical background of multihit events is the variation of the critical evaporation field of the atoms in multicomponent systems, which depends on the bonding between the atoms and other atomic properties (Peng et al., Reference Peng, Vurpillot, Choi, Li, Raabe and Gault2018). In particular, poorly conductive materials under laser-assisted evaporation are prone to exhibit a high number of multihit events (Müller et al., Reference Müller, Saxey, Smith and Gault2011). Multihit events show a strong correlation between time and location, and therefore their detectability depends strongly on the detector system (Yao et al., Reference Yao, Gault, Cairney and Ringer2010; Müller et al., Reference Müller, Saxey, Smith and Gault2011).
The analysis of multihit events within the atom probe dataset can provide new insights into the evaporation behavior of the system, even though only a tiny fraction of events is comprised. Several phenomena can be observed such as dissociation traces, co-evaporation of two ions, delayed evaporation, or dissociation into neutral species.
To this aim, for double events, the mass of the first striking ion m 1 is plotted against the mass of the second striking ion m 2, and the resulting plot is called the Saxey or correlation plot (Saxey, Reference Saxey2011). In Figure 5a, an exemplary correlation plot of a tetradecane measurement is shown. Several dissociation events can be deduced from Figure 5.
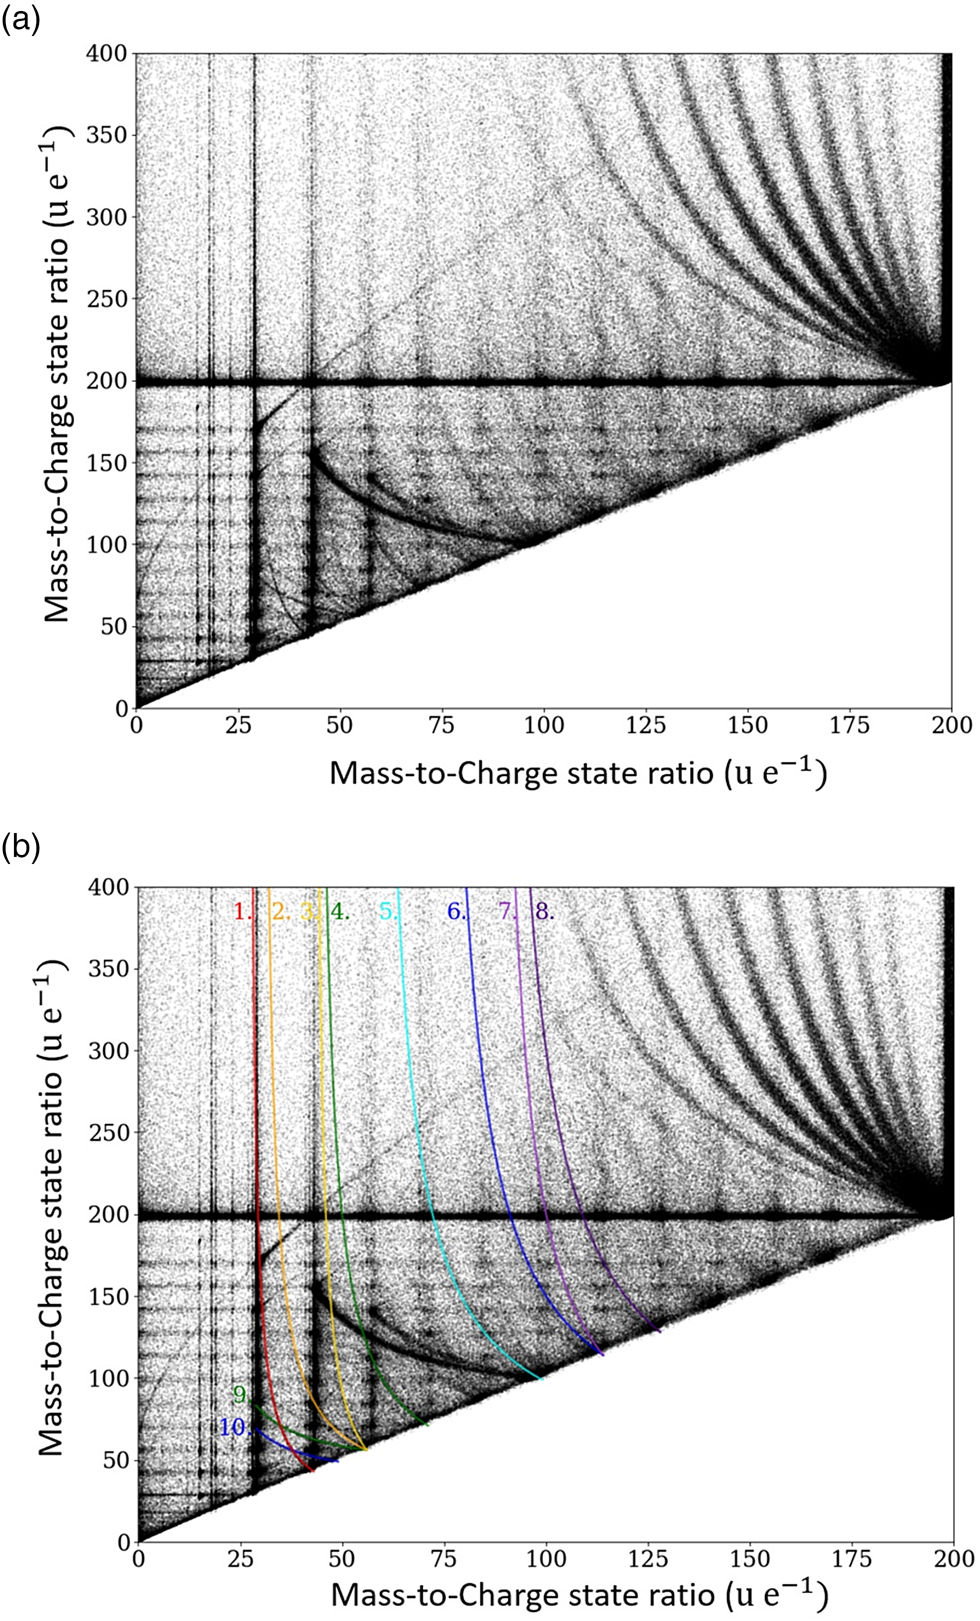
Fig. 5. Correlation histogram for pure tetradecane specimen, the measured mass-to-charge ratio m 2/q 2 of the second event is plotted versus the measured mass-to-charge ratio m 1/q 1 of the first event. In (b), the dissociation tracks are highlighted.
Uncorrelated ion pairs would only lead to a scattered background in the plot, while correlated events lead to local clustering points of increased incidences. However, since a single-event mass spectrum already has pronounced intensity maxima, it is natural to expect product maxima at the respective intersections between the mass spectra of the first and second events.
Some of these clusters are visible in the correlation plot, representing the preferred evaporation events of certain ion pairs. The cluster points with the highest incidence correspond to the molecular groups described previously.
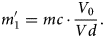
However, more significantly, in most cases, the high electric field has a destabilizing effect and leads directly to the dissociation of large molecules on their trajectory toward the detector. It is noteworthy that molecules can be evaporated even in a metastable state stabilized by the field (shift of the bonding orbitals whereby in the field-free state this molecule would never be formed). With the decreasing field along their pathway, molecules can subsequently dissociate into two or more fragments. The detected flight time and thus the detected mass-to-charge state ratio  ${m}^{\prime}_1$ of an ion (with actual mass-to-charge state ratio m 1), which is formed by splitting from a larger emitted compound (with a mass-to-charge state ratio m c), depend on the local potential at the actual position of dissociation, conveniently expressed by the experienced voltage drop V d until dissociation.
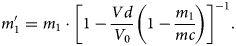 $${m}^{\prime}_1 = m_1\cdot \left[{1-\displaystyle{{V_\rm d} \over {V_0}}\left({1-\displaystyle{{m_1} \over {m_\rm c}}} \right)} \right]^{{-}1}.$$
In equation (1), V 0 and m c denote the potential at the tip surface and the mass of the initial larger compound molecule before dissociation, respectively. The equation allows the investigation of the dissociation processes by constructing correlation tracks, as some of them are highlighted and labeled in Figures 5b and 6a, 6b. These tracks are characterized by the mass-to-charge state ratio of the initially emitted compound (m c/q c) and both dissociation products (m 1/q 1 and m 2/q 2) and describe the dissociation path: m c/q c → m 1/q 1 + m 2/q 2. The track starts (upper left side) at the point (m 1/q 1; m 2/q 2), where V d/V 0 ≈ 0, which implies dissociation close to the sample surface. Here, the velocities and thus the time of flight of both dissociation products are given by their respective mass-to-charge state ratios. The end point of a track (located on the diagonal of the correlation plot diagonal: m c/q c; m c/q c) represents dissociation far away from the tip's surface. Thus, most of the potential energy is already transferred to the initial compound before the dissociation takes place (V d/V 0 ≈ 1), and consequently, the time of flight of both dissociation products is given by the mass-to-charge ratio of the compound.
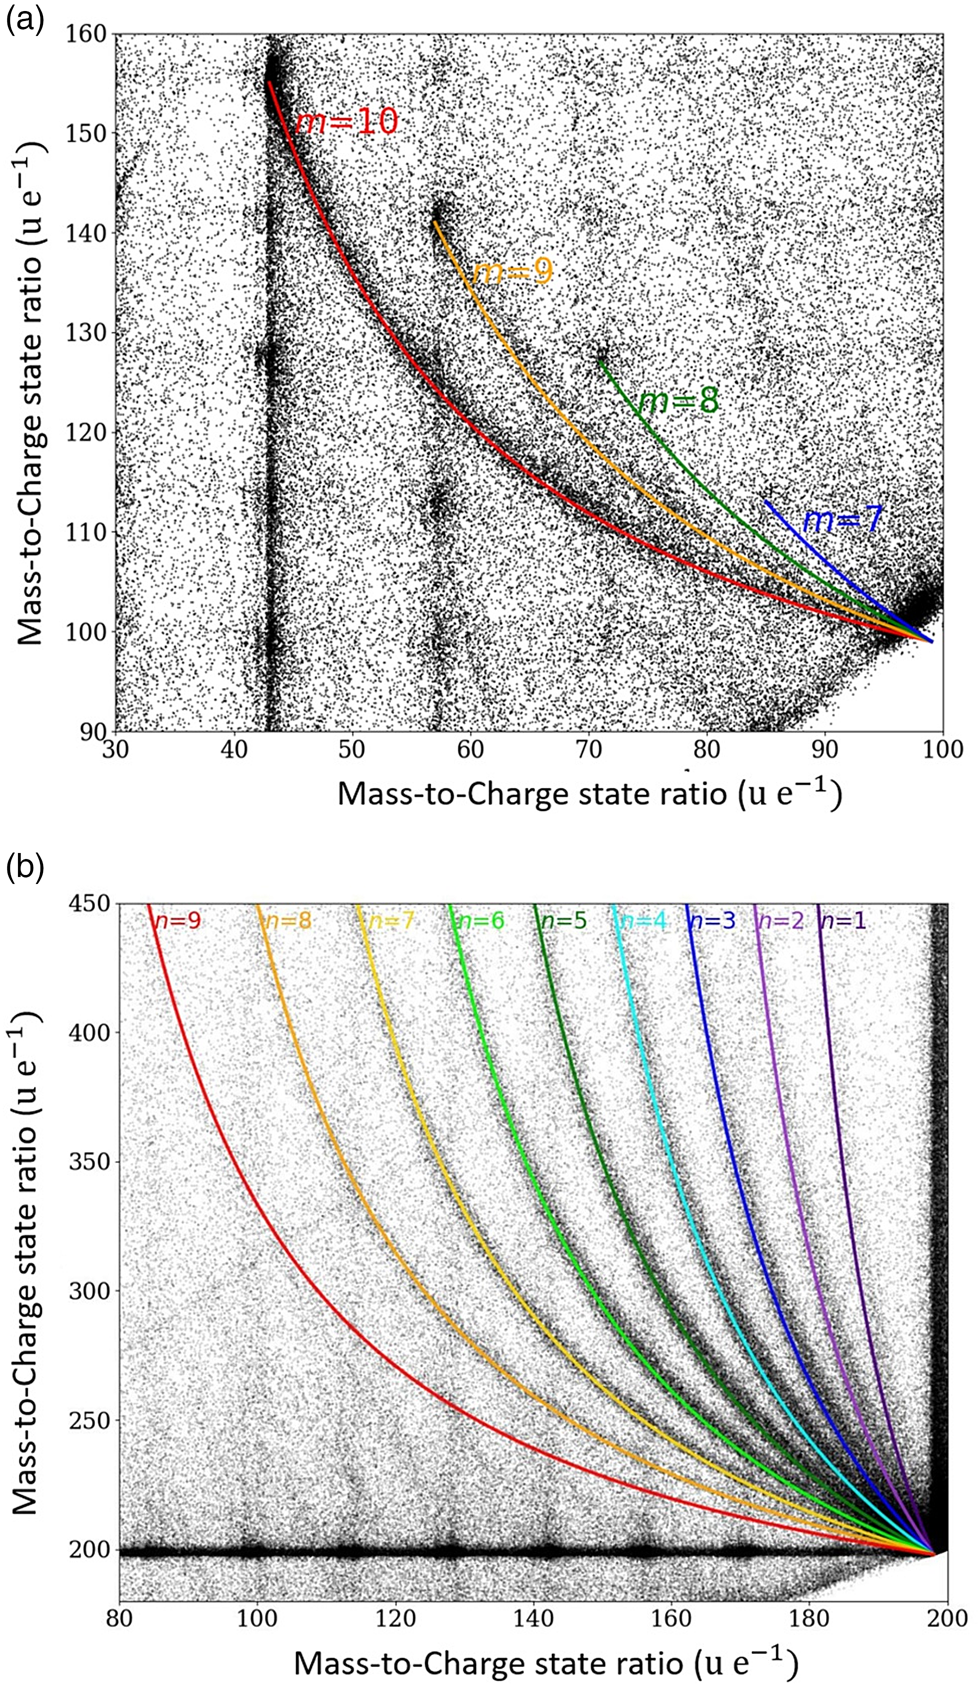
Fig. 6. Areas of the correlation histogram with periodically ordered dissociations tracks. In (a), the dissociation of the starting molecule C14H302+ into CH3(CH2)m + and CH3(CH2)12−m+ with m = 7–10. In (b), the neutral dissociation of the origin tetradecane molecule C14H301+ into neutral species of CH3(CH2)n− 1CH3 and a charged species of (CH2)13−n+ with n = 1–9.
The start and end points of the marked dissociation tracks in Figure 5b are listed in Table 3. The possibility of fitting curves with slightly different masses to the correlation plot suggests an error of about 1 u/e for the stated mass-to-charge ratios. Two further remarkable areas of periodically arranged dissociation tracks are explained in more detail below.
Table 3. Start and End Points of the Marked Dissociation Tracks in Figure 5b.
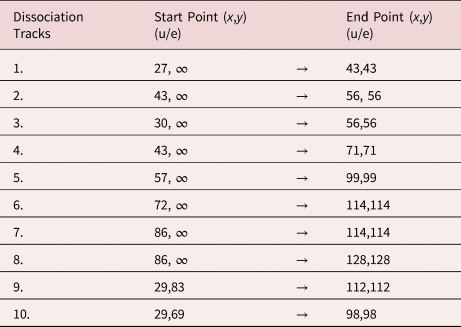
Tracks 1–8 indicate the dissociation of the initial compound into one charged and one neutral molecule. Dissociation tracks 9 and 10 suggest the dissociation of a doubly charged molecule into two singly charged fragments.
If both fragments are charged as in the case of tracks 9 and 10, the initially evaporated compound must be obviously multiply charged. The corresponding “chemical” reactions are as follows:
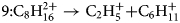 $$9\colon {\rm C}_8{\rm H}_{16}^{2 + } \to {\rm C}_2{\rm H}_5^ + { + } {\rm C}_6{\rm H}_{11}^ +$$
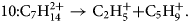 $$10\colon {\rm C}_7{\rm H}_{14}^{2 + } \to {\rm C}_2{\rm H}_5^ + { + } {\rm C}_5{\rm H}_9^ + .$$
Similarly, a remarkably regular track pattern merging at the compound mass m c = 99 is highlighted in Figure 6a. It represents a systematic dissociation of the doubly charged full chain molecule C14H302+ into two charged fractions CH3(CH2)m + and CH3(CH2)12−m+ with m = 7–10.
 $${\rm C}_{14}{\rm H}_{30}^{2 + } \to {\rm C}{\rm H}_3( {{\rm C}{\rm H}_2} ) _m^ + { + } {\rm C}{\rm H}_3( {{\rm C}{\rm H}_2} ) _{12-m}^ + .$$
Typically, dissociated charged fragments strike the detector with a large distance between them, because the molecules are repelled by the Coulomb repulsion of two positively charged particles and, thus, acquire a slightly different trajectory (Blum et al., Reference Blum, Rigutti, Vurpillot, Vella, Gaillard and Deconihout2016). This could lead to local resolution problems in reconstruction.
If the initially evaporated molecule is only singly charged, one of the dissociation products must be neutral as has been already reported elsewhere (Saxey, Reference Saxey2011; Gault et al., Reference Gault, Saxey, Ashton, Sinnott, Chiaramonti, Moody and Schreiber2016). If the dissociation product has no charge (m → ∞), equation (1) takes on the form:
 $$m_1^{\prime} = m_\rm c\cdot \displaystyle{{V_0} \over {V_\rm d}}. $$
Therefore, the corresponding dissociation tracks have no clear start point and can be fitted with infinitely large mass-to-charge state ratio (neutral particles), as shown in Figure 5b for the marked tracks 1–8. The suggested reactions are as follows:
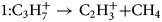 $$1\colon {\rm C}_3{\rm H}_7^ + \to {\rm C}_2{\rm H}_3^ + { + } {\rm C}{\rm H}_4$$
 $$2\colon \;{\rm C}_4{\rm H}_8^ + \to {\rm C}_3{\rm H}_7^ + { + } {\rm CH}$$
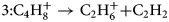 $$3\colon {\rm C}_4{\rm H}_8^ + \to {\rm C}_2{\rm H}_6^ + { + } {\rm C}_2{\rm H}_2$$
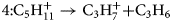 $$4\colon {\rm C}_5{\rm H}_{11}^ + \to {\rm C}_3{\rm H}_7^ + { + } {\rm C}_3{\rm H}_6$$
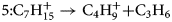 $$5\colon {\rm C}_7{\rm H}_{15}^ + \to {\rm C}_4{\rm H}_9^ + { + } {\rm C}_3{\rm H}_6$$
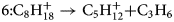 $$6\colon {\rm C}_8{\rm H}_{18}^ + \to {\rm C}_5{\rm H}_{12}^ + { + } {\rm C}_3{\rm H}_6$$
 $$7\colon {\rm C}_8{\rm H}_{18}^ + \to {\rm C}_6{\rm H}_{14}^ + { + } {\rm C}_2{\rm H}_4$$
 $$8\colon {\rm C}_9{\rm H}_{20}^ + \to {\rm C}_6{\rm H}_{14}^ + { + } \;{\rm C}_3{\rm H}_ 6 .$$
Again, even more striking is the systematic set of the dissociation of the singly charged chain molecule C14H301+ into one neutral smaller species of CH3(CH2)n −1CH3, and a larger charged species of (CH2)13−n+ with n = 1–9 (Fig. 6b) following the general reaction equation:
 $${\rm C}_{14}{\rm H}_{30}^ + \to ( {{\rm C}{\rm H}_ 2} ) ^ + _{13-n} + {\rm C}{\rm H}_3( {{\rm C}{\rm H}_2} ) _{n-1}{\rm C}{\rm H}_3 .$$
Such regular set of dissociations in an atom probe experiment is presumably reported for the first time.
To evaluate the relative probability among the different dissociations as well as the probability for dissociation along a selected trajectory, the correlation tracks were cut from the complete dataset with a filter of ±2 u/e, as illustrated in Figure 7a. Furthermore, a rectangular reference volume was used to determine the appropriate noise level, which was consequently subtracted from the intensity. The relative probability between the dissociation tracks is symmetrically peaked (see Fig. 7b) with a maximum at n = 5. Thus, it reveals a preferential dissociation into the charged molecule (CH2)8+ and the neutral molecule CH3(CH2)4CH3.
Fig. 7. (a) Dissociation tracks were filtered in a stripe between ±2 u/e borders. To subtract the background noise, a rectangular reference volume was used to determine the typical noise level. In (b), the intensity (=probability) distribution among the neutral dissociation tracks shows a symmetric Gaussian-like shape with a maximum intensity at n = 5, corresponding to the dissociation of the charged molecule (CH2)8+ and the neutral molecule CH3(CH2)4CH3. In (c,d), the decay intensity (probability) along a track is plotted against the calculated potential drop.
The intensity distribution along each track also shows a clear maximum, that is, the singly charged tetradecane chain preferentially splits at a certain distance to the tip. Arranging equation (2) for V d/V 0, the preferred potential drop at dissociation can be calculated by determining the masses of the educts and product. In Figures 7c and 7d, the decay probabilities along the tracks are plotted against the potential drop. The highest dissociation intensity is found in the low-field region (ΔV/V 0 ≈ 1), which is an artificially created signal caused by the overlap and undistinguishable portions of all seven observed decay tracks convoluted with the signal stemming from the simultaneous evaporation of two full tetradecane molecules in one point. But there is a clear local maximum of the dissociation intensity of the most intensive dissociation tracks (n = 3–7) at ΔV/V 0 ≈ 0.7 (Fig. 7d). This suggests that the charged tetradecane chain predominantly dissociates after a 70% drop in potential, suggesting a high-field stabilization. The charged n-tetradecane molecule is stabilized in a high field, while the excited state might be metastable under normal conditions. After the field/potential has decreased to a critical point, the molecule splits into a neutral and a charged fragment.
It will be an exciting future task to clarify the dissociation conditions in parallel DFT-based calculations.
Based on modeling the potential drop, the distance of the dissociation zone (Fig. 8) from the tip can be calculated using the simple approach of a hyperbolic field distribution between the tip's apex and the extraction electrode (at a distance of approximately a = 1 mm from the tip). The distance from the extraction electrode can be calculated as a function of the radius of curvature r0 (Tsong, Reference Tsong2005):
 $$z = a\cdot {\rm sin}\left[ 2\cdot\left\{ \arctan \left(\exp \beta\cdot \left( 1- \frac{\Delta V}{V_{0}}\right) - \frac{\pi}{2}\right) \right\}\right] ,$$
with β = ln(tan ((arcsin((a − r 0)/a)/2) − π/4)). For an apex radius of r 0 = 20 nm, the distance (a–z) of flight until the potential has dropped by 70% (ΔV/V 0 ≈ 0.7) amounts to 60 μm. Therefore, the dissociation zone is quite far from the tip.
Fig. 8. A model to explain the potential drop corresponding to the dissociation zone of the molecules at a certain distance z from the tip.
After the initial fragmentation, the larger charged chain fragments could undergo further decay processes and split into even smaller fragments. However, these multiple events of third and higher order are rare and depend on several statistically varying decay potentials. The total number of single-hit events is 96.74%, double events 3.06%, triple events 0.19%, and all other events are negligible. If the signals are split into single, double and triple events and plotted, the different mass spectra can be compared with each other (Fig. 9). Interestingly, the peaks from C4Hx to C13Hx no longer appear as triple events, which could be due to the generally low-signal intensity or some other effect, which needs to be further investigated even though the signal-to-noise ratio decreases strongly with the multiplicity of the events.
Fig. 9. Mass spectra split into the separate contributions of single, double, and triple events plotted with the mass-to-charge state ratio from 0 to 250 u/e as a logarithmic plot.
Summary
Liquid n-tetradecane was successfully prepared by cryo-APT and analyzed using a laser-assisted APT. Larger volumes could be measured with a very high reproducibility, all of them exhibiting a complex evaporation and fragmentation behavior. A regular sequence of molecular fragments could be observed and identified in the mass spectra. Nevertheless, 73% of the measured signals stem from ionized n-tetradecane molecules that are field desorbed from the van der Waals, bonded liquid as complete molecules. About 27% of the detected events undergo a fragmentation process. The overall stoichiometry of the alkane chain was calculated using different approaches and corresponds very well to the theoretical value. The complete tetradecane molecule chain has a significant probability of further dissociation along its trajectory. Based on an analysis of the multihit events, the dissociation tracks could be analyzed. It demonstrates a preferred splitting of a small neutral chain fragment of six carbon atoms. The intensity distribution along the dissociation track allows us to determine that most decays appear after a potential drop of 70%, thereby allowing an estimation of preferred distance of the dissociation zone to the tip surface, which amounts to 60 μm distance.
Acknowledgments
The authors gratefully acknowledge funding by the German Research Foundation (Deutsche Forschungsgemeinschaft, DFG) within the collaborative research center CRC 1333 (Project No. 358283783).
Conflict of interest
The authors declare no competing interests.


 Open access