


1. INTRODUCTION
During the initial stage of the expansion of a laser-produced plasma, the electronic component can be diagnosed by high-speed optical interferometry (Bychenkov et al., Reference Bychenkov, Zakhorenkov, Krokhin, Rupasov, Silin, Sklizkov, Starodub, Tikhonchuk and Shikanov1977; Atwood et al., Reference Atwood, Sweeney, Auerbach and Lee1978) and by Langmuir probe localized in the electron expansion region (von Gutfeld & Dreyfus, Reference von Gutfeld and Dreyfus1989; Gambino et al., Reference Gambino, Mascali, Tudisco, Anzalone, Gammino, Musumeci and Spitaleri2013). The measurements of the target polarization and the target return current versus laser intensity and target properties give information on escaping electrons generated in the interaction of laser pulses with solid targets (Mendel & Olsen, Reference Mendel and Olsen1975; Pearlman & Dahlbacka, Reference Pearlman and Dahlbacka1977; Benjamin et al., Reference Benjamin, McCall and Ehler1979; Bialkowski et al., Reference Bialkowski, Hurst, Parks, Lowndes and Jellison1990; Cikhardt et al., Reference Cikhardt, Krása, De Marco, Pfeifer, Velyhan, Krouský, Cikhardtová, Klír, Řezáč, Ullschmied, Skála, Kubeš and Kravárik2014; Dubois et al., Reference Dubois, Lubrano-Lavaderci, Raffestin, Ribolzi, Gazave, Compant La Fontaine, d'Humières, Hulin, Nicolaï, Poyé and Tikhonchuk2014). The voltage pulse appears on isolated targets independently of the laser pulse duration. The positive charging of the target is balanced by an opposing current which can reach a peak value up to a few kA (Benjamin et al., Reference Benjamin, McCall and Ehler1979; Cikhardt et al., Reference Cikhardt, Krása, De Marco, Pfeifer, Velyhan, Krouský, Cikhardtová, Klír, Řezáč, Ullschmied, Skála, Kubeš and Kravárik2014). It is supposed that the positive charging of the target results from high-energy electrons leaving the plasma and traveling a distance either until their kinetic energy equals the electric field energy of charge separation or until they strike the vacuum chamber walls (Crow et al., Reference Crow, Auer and Allen1975; Eliezer & Hora, Reference Eliezer and Hora1989; Dubois et al., Reference Dubois, Lubrano-Lavaderci, Raffestin, Ribolzi, Gazave, Compant La Fontaine, d'Humières, Hulin, Nicolaï, Poyé and Tikhonchuk2014). Although the determination of characteristics of the electronic target-circuit including its holder system as a Langmuir probe is relatively simple, its interpretation is rather complex. The bias voltage on the target allows measuring both the positive and negative charge emission from the target (Benjamin et al., Reference Benjamin, McCall and Ehler1979). The key finding is that the target current can reach a maximum value much later than the laser pulse and shows also a dependence on target material.
The voltage, U T(t), induced on an isolated target is given by the number of escaped charges, N(t), with energy greater than the final target potential and by the capacitance, C T, of the target (together with its holder) with respect to the vacuum chamber:
 $${Q_{\rm T}}\left( t \right) = {C_{\rm T}}{U_{\rm T}}\left( t \right) = N\left( t \right)e,$$
where Q T(t) is the charge on the target, and e is the charge of an electron (Pearlman & Dahlbacka, Reference Pearlman and Dahlbacka1977). Furthermore, U T(t) depends on the geometry of the vacuum chamber used.
Although the measurements of voltage on the target are regarded to be indirect experimental evidence of the double-layer existence, the charge separation causes the positive charging of the target, since during the plasma expansion three distinct zones in the space-charge distribution can occur (Mora, Reference Mora2003). The first layer of the positive charge is just located at the target surface; the second layer of the positive charge is localized on the expanding front of ions which tightly follow the fast layer formed from electrons having a charge σ. The plasma is nearly neutral between the first and second positively charged layers which are delimited by the target and double layer. Nevertheless, a number of additional effects should be taken into account to interpret and understand occurrences that have been observed (Mora, Reference Mora2003).
The structure of a real ion front is formed by various ionized species. The experimental determination of the time evolution of the ion front is based on a relationship between flight times t, τ and flight distances L, x, with L being the real target-to-detector distance and x is the distance chosen arbitrary. As L/t = x/τ, this allows to transform the ion collector current j(L,t) observed on the detector to the space-resolved ion charge density q(x,τ) at a chosen time τ (Krása et al., Reference Krása, Parys, Velardy, Velyhan, Delle Side and Nassisi2014):
 $$q(x,{\rm \tau} ) = j\left( x \right){\rm \tau} {L^3}/{x^4},$$
where values of τ and L are kept fixed. A deconvolution of TOF spectrum to partial currents for each ionized species and charge state makes it possible to determine all partial ion fronts (Krása et al., Reference Krása, Lorusso, Nassisi, Velardi and Velyhan2011; Reference Krása, Parys, Velardy, Velyhan, Delle Side and Nassisi2014).
In this paper, we discuss the observed transient currents that balance both the deficit and surplus of electrons on various targets irradiated by a low-intensity excimer krypton fluoride (KrF) laser. Attention is also paid to the determination of ion fronts which are needed for analysis and elucidation of the multi-peak structure of the long-lasting target currents.
2. EXPERIMENTAL SETUP
A schematic of our experiment is shown in Figure 1. The plasma was produced with use of a 23 ns Compex 205 KrF excimer laser operating at 248 nm which works at laser irradiances from 108 to 1010 W/cm2. The laser pulse struck the target at 70° with respect to the target surface normal. Targets were fixed to a cylindrical metalic holder, electrically insulated from the ground (Velardi et al., Reference Velardi, Delle Side, Krása and Nassisi2014). The total capacitance of the holder together with the target with respect to the vacuum chamber was C T = 31 ± 5 pF. This value has been obtained using the chamber as a capacitor within an RC circuit powered with a step voltage source.

Fig. 1. Sketch of the experimental setup.
During the experiments, the target holder was connected to ground through an array (R p) of ten 110 Ω resistors. One of these was realized through the series of a further 60 Ω resistor (R C) and a 50 Ω coaxial cable. The cable was then connected to one of the scope's 50 Ω input connector. The voltage on the target is given by the relationship U T = (R C + R S)/R S × U S(t), where R S is the input scope resistance, and U S(t) is the voltage observed on the scope.
The current of ions traveling through the vacuum chamber and drift tube was detected with the use of a Faraday cup (FC, an ion collector having the active area of 28.3 cm2). In particular, it was positioned at a distance of 27.9 cm along the target surface normal. For the applied FC bias voltage of −200 V the ion current was saturated. Targets as Al, C, Cu, CuBe, Ag 92.5/Cu 7.5 (AgCu), Sn, Au, and tantalum (Ta) foils of 0.1–0.2 mm in thickness were irradiated by laser pulses.
3. RESULTS AND DISCUSSION
The target charge generated on a Sn target irradiated with fluence of 24 J/cm2 ranged from about −10 to 14 pC, as Figure 2 shows. The positive charge occurs in a time range running from 0 to 2.8 µs. The ratio of the total positive target charge to the charge carried by positive ions observed with the FC is of the order of 10−3. In contrast with the experiments with nanoseconds to sub-picoseconds lasers (Benjamin et al., Reference Benjamin, McCall and Ehler1979; Borowitz et al., Reference Borowitz, Eliezer, Gazit, Givon, Jacket, Ludmirsky, Salzmann, Yarkoni, Zigler and Arad1987), where the time of target charging was comparable with the laser pulse width, in our experiment the positive charge was balanced by a target current during a time period longer by a factor ~100 in comparison with the laser pulse length. Moreover, a new phenomenon arising after t zero = 2.8 µs indicates that the target is being negatively charged. The negative charge occurs up to the end of the plasma expansion, as shown in Figure 2 by the signal of the FC positioned at the far end of the chamber.
Fig. 2. Time-resolved ion current j FC detected with use of FC and charge Q T occurred on Sn target, which was irradiated by 34 mJ laser pulse in 23 ns.
The FC signals give essential characteristics of ion emission and can be transformed to the ion front using Eq. (2), as shown in Figure 3 for Ta and carbon plasmas. The structure of ion fronts is revealed for a time τ = 1 µs after the laser–target interaction. The identification of groups of ionized hydrogen, hydrocarbon radicals, carbon, and Ta atoms constituting the ion front is based on the ion mass analysis described elsewhere (Torrisi et al., Reference Torrisi, Gammino, Mezzasalma, Visco, Badziak, Parys, Wolowski, Woryna, Krása, Láska, Pfeifer, Rohlena and Boody2004; Krása et al., Reference Krása, Láska, Rohlena, Velyhan, Czarnecka, Parys, Ryć and Wolowski2010; Reference Krása, Láska, Rohlena, Velyhan, Czarnecka, Parys, Ryć and Wolowski2011). Only H + , H2+, and Cq+ are labeled as impurities in Figure 3. It is evident that the content of chemisorbed hydrogen was higher on the Ta surface than on graphite, as already noted in (Velardi et al., Reference Velardi, Delle Side, Krása and Nassisi2014). Protons being the fastest ions expand into the vacuum chamber with the maximum velocity of ≈1 × 107 cm/s for both the target materials.
Fig. 3. Ion fronts abandoning graphite and Ta targets after time period of 1 µs elapsed from the laser–target interaction. The inset shows the corresponding time-resolved FC currents which were transformed to the ion fronts.
The comparison of currents flowing through the targets from various materials is shown in Figure 4. The peaked structure of the current through the graphite target indicates that the peaks occurring on other target currents, j T(t), up to the time of about 800 ns are caused by ionized impurities bounded to the surface of targets. Consequently, only the last visible as well as partially hidden positive peaks (see, e.g., Sn-target current at 2 µs) can be related to the ionized heavier target species. The observed positive return target currents fall to zero at t zero ≅ 0.8−2 µs. It is evident that although the number of ionized impurities is much lower than the number of produced target ions, the target currents associated with the ionized impurities are comparable with the balancing currents corresponding with the target ions. Figure 4 also indicates that the polarization of the expanding plasma persists up to the plasma disappearance.
Fig. 4. Time-resolved return currents flowing through Al, Au, C, Cu, Sn, and Ta targets irradiated by KrF excimer laser pulse delivering energy of 34 mJ.
Figure 5 shows the separation of fast electrons from ions, which was observed with the use of FC at bias voltage (V FC) of −200 and 20 V. The beginning of FC signals is formed by a photopeak. At V FC = −200 V, the photoelectrons are emitted by the FC electrode and accelerated backward to the FC grid being at the ground potential, while the photopeak at V FC = 20 V is the current of electrons emitted by the grounded FC grid and accelerated to the active FC electrode. It is evident that the pure electron cloud leads the fastest protons (up to about 3 µs) at the expansion front and the slower electrons are co-moving with other ionized species. Of course this FC diagnostics employed as an electrical double-probe does not allow us to indicate the separation of electrons from ions in double layers interrelated with the second to last peak of the positive target current.
Fig. 5. FC current induced by ions (dash-dotted line), electrons (full line), and XUV radiation (Photopeak) emitted by Ta target exposed to 68 mJ laser pulse (dashed line).
The frequency analysis of a peaked structure of target current given in (Borowitz et al., Reference Borowitz, Eliezer, Gazit, Givon, Jacket, Ludmirsky, Salzmann, Yarkoni, Zigler and Arad1987) has been interpreted in terms of the bounce hydrodynamic frequency 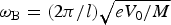 ${{\rm \omega} _{\rm B}} = (2{\rm \pi} /l)\sqrt {e{V_0}/M} $, where l is the double-layer thickness, V 0 is the potential across the double layer, and M is the mass of ions. This interpretation is based on the assumption of the existence of a double layer at the critical surface where a movement with the frequency ωB within this double layer is expected. The observed frequency reached up to 10 GHz when an Al target was exposed to intensity of 1012–1015 W/cm2. Contrary to experiments with high laser intensity (Dubois et al., Reference Dubois, Lubrano-Lavaderci, Raffestin, Ribolzi, Gazave, Compant La Fontaine, d'Humières, Hulin, Nicolaï, Poyé and Tikhonchuk2014), our experiments with intensity lower than 1010 W/cm2 allow us to extend the time scale by a factor of 1000 and to obtain a detailed insight into development of target polarization. First, the peaked structure indicates that the target charge being a measure of the charge of the pure electron cloud reaches a maximum and then vanishes. Second, the partial maxima in the time-resolved target charge can be associated with the dynamic of double layers interrelated by the various ionized species heavier than protons. In effect, the double layers have to take place if a multi-peak target current occurs (Ludmirsky et al., Reference Ludmirsky, Eliezer, Arad, Borowitz, Gazit, Jackel, Krumbein, Saltzmann and Szichman1985; Borowitz et al., Reference Borowitz, Eliezer, Gazit, Givon, Jacket, Ludmirsky, Salzmann, Yarkoni, Zigler and Arad1987). Thus, from Figure 3 we can deduce that each double layer reaches a maximum in the charge density ρ(x,t) = e(Zn i − n e) at the ion front located at a critical distance, x cr from the target, where Z is the ion charge number, n i is the ion density, and n e is the electron density. This induces a maximum of the positive charge on the target at a given time t peak. Then the charge of both the positive and negative layers on the space structure ρ(x,t) gradually vanishes. In summary, the partial maximum in the target charge at time t peak takes place when the expanding plasma reaches a critical distance x cr. Owing to the divergence effects in the expanding plasma, the velocity v i binding x cr with t peak as x cr = v it peak can be interpreted as a characteristic velocity of the plasma expansion driven by the total force of the electron pressure. However, an uncertainty in the determination of x cr should be supposed not only due to shot-to-shot fluctuations, but also owing to the development of the early plasma stage as the creation of a crater on the target surface or the screening effect on the second and others double layers affecting the acceleration of heavier ions. Although the electron pressure is not known a priori, we can simplify the description of this process considering the voltage V 0 accelerating ions to the energy of
 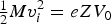 ${\textstyle{1 \over 2}}Mv_i^2 = eZ{V_0}$. Then the critical distance x cr passed by ions in time t peak is:
 $${x_{{\rm cr}}} = {t_{{\rm peak}}}\sqrt {2eZ{V_0}/M}. $$
Although the values of x cr and V 0 are not known a priori, we will primary analyze the observed values t peak, under assumption that the value of V 0 is the same for all the ionized species, against the square root of corresponding ion mass number A per Z, as follows:
 $${t_{{\rm peak}}} = f\,(\sqrt {A/Z} ). $$
The analysis of values of t peak shown in Figure 6 is based on a correlation with values of atomic numbers of all the target elements including protons and products created by recombination of ionized radicals which gives rise to the ejection of various CxHy groups, particularly H2, CH2, C2H2, and C3H3 with a single positive charge. These CxHy products have been observed with the use of quadrupole analyzer after irradiation of a polyethylene target with 1016 W/cm2 intensity (Torrisi et al., Reference Torrisi, Gammino, Mezzasalma, Visco, Badziak, Parys, Wolowski, Woryna, Krása, Láska, Pfeifer, Rohlena and Boody2004). The plot in Figure 6 shows a linear dependence 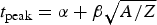 ${t_{{\rm peak}}} = {\rm \alpha} + {\rm \beta} \sqrt {A/Z} $ and the fit gives values of α ≅ 100 ns and
 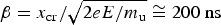 ${\rm \beta} = {x_{\rm cr}}/\sqrt {2eE/{m_{\rm u}}} \cong 200\;{\rm ns} $ with standard errors of ≈51 and ≈3%, respectively, for various target ions and ionized hydrocarbon radicals produced by the same value of laser fluence.
Fig. 6. Partial peaks of time-resolved target currents against square root of mass number,  $\sqrt A $, of target ions and hydrocarbon radicals carrying a single charge except of C2+ ions.
Although the high value of the intercept standard error confirms the complexity of creation double layers interrelated to protons and other slower ionized species near the target surface and defining the starting point of the plasma expansion in a real experiment, the low value of the standard error of the slope associated with V 0 shows that the ion acceleration can be characterized only by a single force in the first approximation. Assuming that the maximum velocity acquired by protons from the double layer is retained as protons pass through the target chamber to the FC, we can estimate the value of x cr to be about 5 mm. Then substituting it in β we obtain the value of eV 0/m u ≅ 4 eV per nucleon which is related to all the ionized species. However, the light protons acquired an appreciable kinetic energy of ≅50 eV. They overtook the heavier ions which formed a slower stream likely due to the screening of electric field accelerating protons.
The interpretation of the negative charging for all the used targets in the last time period of the plasma expansion could be interpreted as the generation of a group of slow ions which does not exhibit a center-of-mass motion caused by an electric force. It is known that the expansion of ions into a vacuum describes the shifted Maxwell–Botltzmann distribution of ion velocities (Miotello & Kelly, Reference Miotello and Kelly1999). Then the ion current j(L,t) detected with FC is the sum of the partial currents Σj i,q(L,t) of all the ionized species, i, with a charge-state, q:
 $$j(L,t) = \displaystyle{{{L^2}} \over {{t^5}}}\sum {{S_{{\rm i},0}}\exp \left[ { - \displaystyle{{{M_{\rm i}}} \over {2k{T_{\rm i}}}}{{(L/t - {u_{{\rm i,}q}})}^2}} \right]}, $$
where M i is the mass of species constituting the partial current j i,q, S i,0 is the corresponding peak response of the ion detector, u i,q is the velocity of their center-of-mass motion directed to the ion collector, k is the Boltzmann constant, and T i is the ion temperature.
It has been shown for ions that the linear regression of the charge-state dependence of u i,q can be interpreted in terms of hydrodynamic and electrostatic forces balanced by collisions among ions, which result in creation of a plasma jet (Krása et al., Reference Krása, Láska, Rohlena, Velyhan, Czarnecka, Parys, Ryć and Wolowski2010). Therefore, the center-of-mass velocity u i (q) = u HD + u q × q. The deconvolution of observed FC currents with the use of Eq. (5) to partial ion currents shows that the best fit can be attained if the slowest single charge ions constituting the tail of FC currents are regarded to be a single group with u i,1 = 0 within the measurement error; see slow Fe+ ions in (Krása et al., Reference Krása, Láska, Rohlena, Velyhan, Czarnecka, Parys, Ryć and Wolowski2010). Thus, there should be a group of slowest ions generated indirectly from neutrals ablated at the target crater by radiation from the expanding plasma. The space occupied by these slow ions is limited by the target and the primary plasma. Thus, the slow ions cannot freely expand into the vacuum chamber. The plasma acceleration by a double layer does not take place and the electrons expand due to ambipolar diffusion to the target which is grounded. At the time of 5 µs, when the positive target charge reached a maximum, the slowest Sn+ ions of the primary plasma passed a 5 cm distance from the target and the fastest ions approached the nearest chamber wall.
4. CONCLUSIONS
In conclusion, we have made several key observations of positive or negative charge on targets irradiated by a low-intensity laser radiation. Our experiments provide evidence for two substantially different mechanisms causing the deficit or surplus of electrons in a close vicinity of the target. In the first case, the photoemission and creation of double layers in expanding plasma cause the positive target polarity. In the second case, the indirect ionization of ablated neutrals by radiation emitted by the expanding laser-produced plasma liberates electrons, which are grounded by the target.
The positive currents flowing through the targets have a multiple-peak structure. The time points of appearance of partial peaks observed at various targets irradiated by the same laser intensity are scalable with the square root of mass number of ionized target atoms and products created by recombination of ionized impurities constituting a slower stream following the faster protons. The observation of target polarization gives basic information on laser ablation.
ACKNOWLEDGEMENTS
This work was performed under the auspices of the Czech Science Foundation (Grant no. P205/12/0454), and the European Social Fund and state budget of the Czech Republic (Project no. CZ.1.07/2.3.00/20.0279).

