


I. Introduction
We know comparatively little about the dynamics of 17th-, 18th-, and 19th-century wine production outside of the “Old World.” In this paper, we investigate one such setting: the Stellenbosch district of the Western Cape, today a prominent wine-growing region in South Africa.
We can do so because we have transcribed, over the last decade, a series of annual tax censuses between 1685 and 1828. This rich source provides household-level information about agricultural outputs and inputs, and labor employed. This allows us to study wine output dynamics in a pre-industrial, colonial, and slave-based economy over more than a century.
Our results reveal little change in median wine yields over the period, a surprising finding given the various political, demographic, and economic changes that transformed the Colony from a fledgling settlement in the late 17th century to a thriving but unequal territory that encompassed, by the 1830s, an area the size of today’s Vietnam, Finland, or Cote d’Ivoire. We posit that despite these macroeconomic changes, production methods in wine cultivation at the Cape remained largely the same. However, we do identify a significant and sustained increase in yield heterogeneity, implying that some farmers were able to achieve improved productivity. We explore one factor—slave labor—that partly accounts for the productivity divergence.
Our research contributes to at least three literatures. First, we expand the documentary record on wine yield estimates in frontier settings, beyond the “Old World” wine-producing regions. Although the productivity of other crops has received attention in “New World” settings (Olmstead and Rhode, Reference Olmstead and Rhode2002), including crops produced by slaves (Olmstead and Rhode, Reference Olmstead and Rhode2008), we have not found any evidence of similar estimates for wine yields outside of Europe.
Secondly, we contribute to a body of literature that explores the determinants of wine yields. We do so within the context of coerced labor, a subject that sparked significant discussion during the first era of cliometrics (Fogel and Engerman, Reference Fogel and Engerman1977), and continues to receive substantial theoretical and empirical attention (Acemoglu and Wolitzky, Reference Acemoglu and Wolitzky2011; Wright, Reference Wright2022). Slaves played a crucial role in expanding wine production at the Cape (Worden, Reference Worden1985). Those farmers who were successful in scaling up their operations often achieved this through the acquisition of more slaves. We observe some slight improvements in labor efficiency and labor productivity under the same wine yield conditions. These enhancements could be attributed to innovations in physical or human capital, or possibly increased levels of coercion.
Finally, these results provide further insight into the causes of the “remarkable wealth” of Cape settlers (Fourie, Reference Fourie2013; Fourie and Garmon Jr, Reference Fourie and Garmon2023), but also into the stagnation that followed. While wine farmers could (and did) expand production in response to market forces—British demand, for example—the coercive labor system, as Adam Smith noted, lacked the incentives to encourage innovation and thus increase productivity. Institutional changes brought about by the arrival of British rule did little to increase the productivity of Cape wine farms.
II. Wine at the southern tip of Africa
Cape wine was first produced in 1659, only seven years after the Dutch East India Company (or, simply, the Company) had set up a refreshment station at the Cape to service ships sailing between Europe and the East Indies. Although the initial plan was for Company officials to produce staples and fresh fruit and vegetables by themselves, the local commander, Jan van Riebeeck, soon realized that local production would need to scale up. In 1657, he released nine Company servants to become free burghers, or settlers. The process of colonizing the land intermittently occupied by the indigenous Khoesan for centuries had begun.
Initial growth in wine production was hindered by poor skills and a tough environment. The addition of Huguenots by the end of the 17th century, however, improved both the quantity and quality of Cape wine (Fourie and Von Fintel, Reference Fourie and Von Fintel2014). By the beginning of the 18th century, then, settler farmers were producing surpluses and increasingly struggling to find a market for their goods, owing to the monopsony regulations that compelled all farmers to sell their goods to the Company. Increasing competition from Company officials who had set up their own farms (using Company resources) further reduced demand. Cape farmers appealed to Company shareholders in Amsterdam and won their case, forcing the local governor, Willem Adriaan van der Stel, to be recalled. From early in the 18th century, Cape farmers were the only winemakers supplying the VOC stores in Cape Town.
Over the first five decades of the Colony’s existence, farmers had expanded east to the first mountain ranges that encircle the Cape Peninsula, the result of successful conflicts against the Khoesan. In the districts of Stellenbosch and Drakenstein, as this region became known, farmers found the terroir that would allow them to specialize in wine production. Output increased as a result. But the rules imposed by the Company—the sale of wine at fixed prices and a system of monopoly contracts governing the sale of wine in Cape Town—meant that farmers had little incentive to produce higher-quality wine. As Groenewald (Reference Groenewald2012) argues, such regulation had a major impact on the development of the Cape wine industry.
Williams (Reference Williams2013) notes that the farmers’ primary concerns were the ability to sell wine in Cape Town, the availability of (affordable) slave labor for growing the grapes and pressing the wine, and the means to acquire property rights to land. Despite the Company’s focus on quantity rather than quality, some farmers did attempt to improve the longevity and taste of their wines. This necessitated attention to vineyard management, harvest timing, production, casking, and storage. This production was confined mainly to a select few farmers who could afford the necessary resources, manage the complex processes, and employ skilled workers (Williams, Reference Williams2013). Slaves often possessed such tacit knowledge.
Throughout its history, the Cape was a financial burden on the Company (Fourie, Jansen, and Siebrits, Reference Fourie, Jansen and Siebrits2013). Wine, as one of the most important sectors in the economy, was therefore an important source of revenue (Jooste, Reference Jooste1973). Taxation was implemented by the VOC on wine and brandy brought into Cape Town for sale, beginning at a rate of one rixdollar per leaguer until 1743, when it increased to three rixdollars per leaguer.
Britain gained control of the Cape from the Dutch East India Company in 1795, followed by a brief period of Batavian rule before the British returned to power in 1806. These transitions brought new trade regulations and economic policies, significantly impacting the production and sale of wine in the region. Britain abolished the slave trade in 1806, followed by the full emancipation of Cape slaves in 1834 (fully effective in 1838) (Ekama et al., Reference Ekama, Fourie, Heese and Martin2021). This had profound socio-economic implications, affecting all sectors of the Cape economy, including viticulture.
Having assumed control in 1806, the British government embarked on two contradictory paths. As elaborated by Rayner (Reference Rayner1986), one policy sought to encourage commercial farming, particularly slave-reliant wine farming in the Stellenbosch region, while the other aimed to curtail the slave trade. Despite this seeming contradiction, the colonial government, in alliance with the Cape gentry, comprised of slave-owning farmers and officials, ardently advocated for wine as the premier export commodity. This strategy yielded significant results, as evidenced by a remarkable 151% increase in wine output. By 1823, wine accounted for an astounding 72% of all export values, underscoring its central role in the region’s economy.
This growth can be attributed mainly to the Act of July 1813, which granted Cape wines access to the British market at a duty rate one-third of that imposed on Spanish and Portuguese wines. This condition held until 1825, when alterations to the duties on all wines occurred, despite remonstrations from merchants and other stakeholders in the Colony’s trade. Even the consistent patronage of Earl Bathurst, the Colonial Secretary at the time, failed to prevent a sudden reduction in protection from 28 pounds to 11 pounds per pipe, with a further projected reduction of approximately 2 pounds 15 shillings per pipe over the next eight years (Martin, Reference Martin1839).
Just as wine production increased, the import of slaves through the Indian Ocean slave trading network was outlawed by Britain. From 1806 onwards, the slave population saw a minimal annual growth rate of less than 1%. As a consequence, the expanding wine industry, historians note, was largely supported by an aging group of slave men, predominantly of Mozambican origin (Williams, Reference Williams2016; Worden, Reference Worden1985). These men bore the substantial burden of this growth, laboring under increasingly strenuous conditions to meet the escalating demand for Cape wine.
We offer empirical evidence over more than a century to verify this historical account. We can do so because of the transcription of a remarkably rich historical source: an annual household-level tax census, which we discuss in the next section.
III. A census of agricultural production
We use the annual, household-level tax censuses, or opgaafrolle, introduced in the initial years of Dutch East India Company rule and maintained after the British takeover. These meticulous records provide a broad overview of each settler household, documenting not only the names of male and female household heads but also the number of children, servants, and slaves by sex. Because the census was used to calculate taxation, they listed various agricultural inputs, outputs, and assets, providing a comprehensive representation of what was primarily an agricultural economy during the first two centuries of European settlement.
We have access to these records because of the hard work of a team that has manually transcribed them for almost a decade (Fourie and Green, Reference Fourie and Green2018). A unique feature of these records is the inclusion of both the husband and wife’s names, which allows for the creation of an annual panel known as the Cape of Good Hope Panel, spanning over 140 years (Rijpma, Cilliers, and Fourie, Reference Rijpma, Cilliers and Fourie2020). At the time of writing, the panel was not yet complete for the entire period we studied.
We evaluate the output and yields of one district: Stellenbosch wine farmers, from 1685 to 1828. Prior research has investigated wealth accumulation or labor utilization for specific years, but those analyses were confined to shorter time periods (Cilliers, Green, and Ross, Reference Cilliers, Green and Ross2022; Fourie and Greyling, Reference Fourie and Greyling2023). We use repeated cross-sections over a century to calculate wine output and yield estimates at the farm level, as far as we know, the first for a pre-industrial, colonial, slave-based society.
Our extensive dataset contains 142,054 unique observations, incorporates 148 variables, and covers 1685 to 1828. This dataset has been assembled from 143 individual censuses, as shown in Table 1. Recognizing that the censuses include both farmers and non-farmers, we include only those households that produced at least one agricultural product.
Table 1. Observations, variables and time period

Although the censuses continued until 1844, we restricted our sample to 1828. We also exclude several censuses due to missing pages or data quality issues. As a result, the subset employed in this study consists of 55,964 unique observations extracted from 122 census years. Not all variables are included in every tax record. The 148 we measure denotes the total number of variables reported at least once across all censuses.
IV. Limitations
One major drawback of the Cape tax records is the absence or inconsistency of reported farm sizes across districts. This inconsistency arises from the diverse tenure arrangements prevalent in the Colony at the time, encompassing freehold, fixed-term and perpetual loan places, and fixed-term and perpetual quitrent contracts (Swanepoel and Fourie, Reference Swanepoel and Fourie2018). The data does not furnish information on the area devoted to crop or livestock production.
These limitations arise from the tax structure of the period, which was not predicated on land ownership but rather tied to output, often correlating with the quantity transported to Cape Town for sale to the Company. Given that total farm size was usually unavailable and, even when present, would only serve as an imprecise proxy for the production area, this aspect has been omitted from our analysis.
Using tax records as a census may introduce potential bias, as it incentivizes participants to underreport their output to decrease their tax liabilities. For example, van Duin and Ross (Reference van Duin and Ross1987) assume that this underreporting coefficient increases over the 18th century. We focus, nevertheless, on relative differences among farmers in the Colony, not absolute measures. We would also not expect differences in the likelihood of underreporting between inputs and outputs. Assuming a uniform level of underreporting across goods and districts, this potential bias should not materially affect our findings. If anything, it would underestimate the growth of wine output over the century.
Geographical boundaries are subject to change over time. While these challenges can be mitigated by applying spatial techniques, as shown by Greyling (Reference Greyling, Pardey and Senay2023), these methods necessitate knowledge of the specific boundaries in question. Regrettably, the boundaries of Stellenbosch during the years we studied are unknown. Potential data anomalies may arise due to such boundary changes.
Finally, we lack consistent information about other sources of labor, notably the Khoesan. As Fourie and Green (Reference Fourie and Green2015) explain, the Khoe was a valuable, if intermittent, labor source on Cape wine farms. While they are enumerated in other Cape districts, notably the frontier district of Graaff-Reinet, the Stellenbosch tax censuses fail to do so. We assume, then, based on evidence from Graaff-Reinet, that Khoe labor was complementary to slave labor rather than a substitute (Links, Fourie, and Green, Reference Links, Fourie and Green2020).
V. Summary statistics
Settlers and slave populations in Stellenbosch expanded rapidly in the late 17th and early century as the fertile land west of the first mountain ranges was opened up and settled. Population sizes grew from 101 settlers and 58 slaves in 1680 to 1,511 settlers and 1,856 slaves by 1740, as shown in Figure 1 and detailed in Table 2. During this period, the settlers and slaves experienced substantial annual growth rates of 5.4% and 7.2%, respectively. The growth in both population groups then plateaued in the 1740s, only to resume at a slower pace thereafter. Growth of the slave population notably exceeded that of the settler population throughout the 18th century; whereas slaves were fewer than half the number of settlers in 1690, by 1800, the settler population was almost half that of the slave population. The annual growth rates of 1.5% and 2.6% per year, respectively, reflect this differential growth. Growth slowed down in the 19th century for both groups, although the 1806 Abolition of the Slave Trade Act did much to stymie further arrivals of slaves from Indian Ocean territories. This is reflected in the annual increases of 0.5% and 0.2%, respectively, until the end of our study period in 1828.

Figure 1. Stellenbosch farmers: Settler and slave population.
Table 2. Farmer aggregates: Average per decade
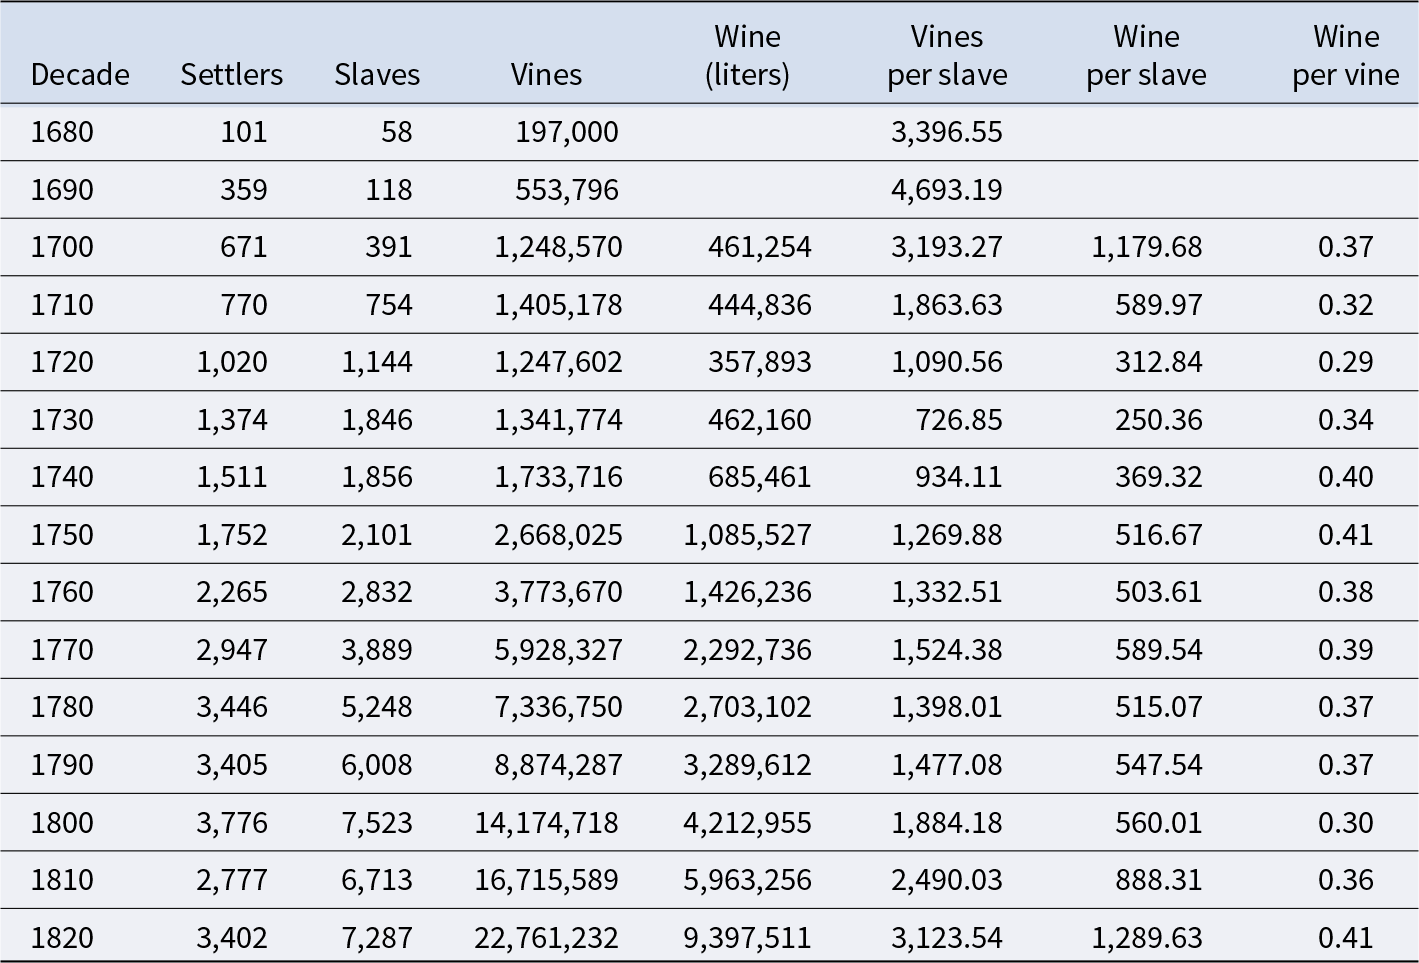
Note: Decade indicates the starting year of the decade.
The growth in wine output was one consequence of the expanding settler and slave populations. By the 1680s, only three years after settlement, Stellenbosch farmers had cultivated almost 200,000 vines. Just two decades later, by the 1700s, this figure had catapulted to 1.2 million, reflecting a remarkable 6.3-fold increase or an annual growth of 9.7%, as visualized in Figure 2 Panel a and summarized in Table 2. During this time, Stellenbosch farmers produced approximately 461,254 liters of wine, as reflected in Figure 2 Panel b, translating to around 1,180 liters per slave.

Figure 2. Vines, wine and wine per vine.
Between 1700 and 1740, farmers consolidated their plantings, with the annual growth rate of vines dipping to a modest 0.8%, while wine production increased at a slightly higher annual rate of 1.0%. By the 1730s, the number of vines per slave had declined to 726, the lowest recorded ratio for our period of analysis.
By the 1740s, despite an increase in the tax on wine, growth in the number of vines planted picked up again. Unlike French wine producers, Stellenbosch wine farmers did not face a prohibition on the planting of new vines (Meloni and Swinnen, Reference Meloni and Swinnen2016). Hence, the annual growth rate for vines planted accelerated to 3.3% until 1795, with wine production growing at a slightly slower pace of 3.2%. By the end of this period, the ratio of vines per slave had reached 1,477.
Following the arrival of the British in 1795, denoted by the shaded areas in Figure 2, wine output expanded even faster. The annual growth rate from 1790 to 1820 was 3.6%. This rate further quickened to 4.7% per year during the 1810s and 1820s. However, the number of vines planted during the 1790s to 1820s period increased by only 2.4% annually.
Despite this disparity in growth rates, we do not find a substantial increase in wine yields. The number of liters of wine produced per vine fluctuates between a low of 0.36 liters per vine and 0.41 liters, as shown in Figure 2 Panel c and Table 2.
Farm-level information provides further evidence of these trends. By 1700, as Table 3 shows, the average Stellenbosch wine farmer owned approximately 7,960 vines and produced 3,983 liters of wine. The largest wine farmer within our sample had a vine count of 24,000, producing 17,290 liters of wine. As the Stellenbosch district consolidated, farm-level wine output increased. Between 1700 and 1743, the average number of vines and wine output per farmer nearly doubled, and it more than doubled between 1743 and 1784. From 1784 to 1828, the average number of vines per farmer experienced a 31% increase, while average wine production per farmer almost doubled once more, increasing by 94.4%.
Table 3. Summary statistics of vines and wine production

Figure 3 confirms the increase in wine output. Note the widening disparity between the average and the largest farmer: in 1700, the largest wine farmer possessed three times as many vines as the average farmer, but by 1828, this ratio had surged to 6.4 times. These differences become even more pronounced when examining wine production. In 1700, the largest wine farmer produced 4.3 times the volume of wine compared to the average farmer. By 1828, this ratio had escalated dramatically to 23.3 times.

Figure 3. Vine ownership in Stellenbosch for selected years.
Contrary to what might be expected, the increased scale of production did not lead to a surge in yields. Indeed, we observe in Figure 4 a relatively negligible change in wine yield over the corresponding period. Although the median yield increased from 1740 to 1795 and again from 1795 to 1828, the distribution of yields in 1828 bears a striking resemblance to those in 1700. Despite the considerable increase in production scale, yields essentially remained constant.

Figure 4. Wine yields in Stellenbosch for selected years.
What is noteworthy, however, is the variation in wine yields across the period, especially during the 19th century. We explore the reasons for this large variation in the next section.
VI. Slave labor and productivity improvements
Increased productivity with the expansion of slave labor use could be a potential reason for higher wine yields. Particularly on Stellenbosch wine farms, where enslaved workers comprised the primary labor force, improvements in the productivity of slave labor might be expected due to two key factors: specialization and supervision.
Operations employing a greater number of enslaved workers could potentially encourage higher task specialization, leading to improved productivity. Fourie and Von Fintel (Reference Fourie and Von Fintel2014) argue, for example, that Huguenot wine farmers at the Cape were more productive precisely because they and their workforce were equipped with better skills.
Supervision costs could be a second reason for productivity gains. Within a coerced labor system such as slavery, significant costs related to supervision, control, and enforcement are anticipated. As the scale of operation expands, it is reasonable to expect an increase in these supervisory costs. However, this increase might not necessarily follow a linear trend. Indeed, larger operations could achieve improved productivity by distributing the fixed supervision costs over a larger number of workers, thus reducing the cost per worker.
Figure 5 shows a scatter plot of wine yields (wine per vine) and slave labor productivity (wine per slave). A positive linear relationship is observed, suggesting that increased labor productivity correlates with a rise in wine yield; in other words, farms with higher wine yields were also employing their labor more efficiently.

Figure 5. Comparing wine yields and labor productivity, by score.
Given that the scatterplot is clustered by score, with the score average indicated by the large dot, we can also investigate inter-score trends. Our results show an upward shift in labor productivity for a given wine yield over the period of analysis, with the most recent scores (17801840) being above the long-term trend. This result could stem from improved labor efficiency due to better work practices, advancements in technology, or more efficient management methods. Non-labor factors, like improvements in viticulture practices or higher-quality vines, could also be contributing to this trend. The relationship between the scale of operation, labor use, and productivity could also impact this trend. These are interesting areas for future exploration.
The relationship between wine yields and slave labor productivity was further tested using an OLS regression framework. Table 4 displays the results of five specifications with wine yield (liters of wine per 10,000 vines) as the dependent variable, incorporating decade-fixed effects.
Table 4. OLS regressions

Standard errors in parentheses.
* p¡.1, **p¡.05, ***p¡.01.
Specification 1 uses settler and slave counts as explanatory variables. Both variables have a statistically significant effect on wine yield at the 1% level, echoing the visual relationship seen in Figure 5. In Specification 2, we further exploit the detail within our census data by splitting slave labor into men and women. We observe contrasting correlations with wine yields: slave men have a positive correlation, while slave women have a negative correlation with wine yields. This is understandable given the gendered division of labor on wine farms.
Specification 3 introduces the squares of slave men and slave women as variables, both of which have negative coefficients but are economically small. There is no evidence suggesting significant exponential increases in productivity as the number of slaves increases.
Specifications 4 and 5 investigate the potential impact of the British arrival on the relationship between slave labor and wine yields. We find no evidence of a meaningful shift. The coefficient on the post-1795 dummy is positive but statistically insignificant, and the interactions with slave labor and slave males are both economically small and statistically insignificant.
VII. Conclusions
In a seminal work, Fogel and Engerman (Reference Fogel and Engerman1977) concluded that the system of slavery in the United States improved productivity primarily for farms specialized in one of four main products: sugar, cotton, rice, and tobacco. They noted significant productivity improvements, especially in sugar production, which was almost entirely produced on large slave plantations. They found the slave system to have been less productive for tobacco compared to cotton.
In our study, we investigate wine production and slave labor productivity in the Dutch and British Cape Colony, made possible by the availability of an annual tax census recording household characteristics, labor contributions, and agricultural inputs and outputs.
Our findings reveal a substantial increase in wine production during this period. This rise in output stems not only from the increase in the number of farmers and slave labor, thereby increasing aggregate output, but also from some farmers enhancing their productivity. An important finding our data reveals is the substantial variation in the scale of production towards the end of the period, even within the relatively ecologically homogenous Stellenbosch district.
We delve into whether the observed variations in wine yields can be attributed to productivity differences in slave labor. Our analysis reveals a strong positive correlation between labor efficiency and wine yields. We also find some evidence of an increase in labor productivity over the period, a topic we hope to investigate in the future.
Finally, we find no evidence suggesting institutional changes at the Cape had any significant impact on wine farm dynamics. Despite the advent of British rule at the close of the 18th century, the abolition of the slave trade in the early 19th century, and a reduction in trade tariffs that favored Cape wine in Britain, we find no changes in the production function of wine farms.
The wine yields we calculate help explain why Cape wine farmers have reached levels of “remarkable wealth” (Fourie, Reference Fourie2013). More recent evidence, using comparable United States tax censuses, shows that Cape farmers attained higher levels of output on average than their U.S. counterparts (Fourie and Garmon Jr, Reference Fourie and Garmon2023).
But these results also explain why the Cape economy had reached “a high plateau” (Fourie, Reference Fourie2013, p. 446). Adam Smith, in his Wealth of Nations, noted that “slaves, however, are very seldom inventive; and all the most important improvements, either in machinery, or in the arrangement and distribution of work which facilitate and abridge labor, have been the discoveries of freemen.” The system of slavery at the Cape locked wine farmers into a production system that discouraged innovation and improvement. More substantial shifts in the traditional methods of wine farming would not occur until the end of slavery in the 1830s and, perhaps more significantly, until the arrival of the phylloxera disease in the late 19th century (Nugent, Reference Nugent2023; Vink et al., Reference Vink, Boshoff, Fourie and van Jaarsveld2018).
Acknowledgments
The authors would like to extend their gratitude to the anonymous referees for their input. The authors would also like to acknowledge financial support from the Riksbankens Jubileumsfond (Cape of Good Hope Panel project), the Andrew W. Mellon Foundation (Biography of an Uncharted People project), and South Africa’s National Research Foundation. For more information about the project, visit www.capepanel.org.


 Open access