Introduction
Identifying the population genetic structure and connectivity and determining their driving factors are important for understanding the evolution and biogeography of a species (Cowen et al., Reference Cowen, Paris and Srinivasan2006). For most marine animals, the distribution scale and connectivity of the population are typically influenced by a combination of physical factors acting upon the organisms, the species' biological characters, and historical vicariance events (Palumbi, Reference Palumbi1992; Avise, Reference Avise2000; Kyle & Boulding, Reference Kyle and Boulding2000; White et al., Reference White, Selkoe, Watson, Siegel, Zacherl and Toonen2010). However, more complicated factors, such as larval retention, post-settlement selection, and even anthropogenic activities can affect the genetic diversity and structure of local populations (Watts et al., Reference Watts, Johnson and Black1990; Palumbi, Reference Palumbi2003; Kochzius & Nuryanto, Reference Kochzius and Nuryanto2008; Hui et al., Reference Hui, Kraemer, Seidel, Nuryanto, Joshi and Kochzius2016). Among these factors, dispersal ability of various species due to differences in their life cycles is one of the pivotal aspects influencing the population connectivity of marine invertebrates. Low population structure over long time scales in the western North Atlantic has been observed in the sea cucumber Cucumaria frondosa, with long-lived lecithotrophic larvae (So & Uthicke, Reference So and Uthicke2011), and high gene flow has also been detected in the blue sea star Linckia laevigata, which has broadcast spawning and long pelagic larval duration (PLD) (Alcazar & Kochzius, Reference Alcazar and Kochzius2016). Conversely, strong genetic population structures have been revealed in the giant clams (Tridacninae) with limited dispersal abilities (Nuryanto & Kochzius, Reference Nuryanto and Kochzius2009; DeBoer et al., Reference DeBoer, Naguit, Erdmann, Ablan-Lagman, Carpenter, Toha and Barber2014).
In crabs, the life cycle normally consists of zoeal stages, megalopal stage and juvenile crab stages followed by adult stages. During this process, the crabs develop with a PLD of ~20 days. Unlike sessile species, the benthic adult crab can still crawl on the seafloor. Therefore, most crabs are believed to have strong dispersal abilities. Along the south-eastern coast of China, high genetic diversity and low differentiation are found in the mud crab Scylla paramamosain (He et al., Reference He, Zhang, Weese, Zhu, Jiang and Qiao2010; Ma et al., Reference Ma, Ma and Ma2011, Reference Ma, Cui, Ma and Ma2012). No population-specific haploid is detected in Scylla serrata within the Indian Ocean, showing high gene flow among the populations (Fratini & Vannini, Reference Fratini and Vannini2002). However, two distinct clades of haplotype in this mud crab are geographically separated by a narrow channel connecting the two regions along the Australian coast (Gopurenko & Hughes, Reference Gopurenko and Hughes2002). The red king crab is divided into three geographically distinct evolutionary lineages in the North Pacific, indicating that observed patterns of genetic variability are shaped not only by contemporary levels of gene flow but also by divergences during historical isolations (Grant & Cheng, Reference Grant and Cheng2012). It has also been noted that although the large population size and meroplanktonic life history of blue crabs promote widespread gene flow on a regional scale, genetic composition can change over just one year (Yednock & Neigel, Reference Yednock and Neigel2014). Therefore, it is essential to monitor the genetic population structure in consecutive years.
The swimming crab Portunus trituberculatus (Crustacea: Decapoda: Brachyura), inhabiting sandy or pebble seafloors, is widely distributed along the coastal waters of China, Japan, Korea and through South-east Asia to the Indian Ocean (Dai, Reference Dai1986). This species is one of the most common edible crabs and has been artificially propagated and stocked with more than 100,000 tons of product per year in China (according to China fisheries yearbook 2016). Because of its economic value, the population genetic structures of P. trituberculatus have been studied using different molecular marker systems (Imai et al., Reference Imai, Fujii, Karakawa, Yamamoto and Numachi1999; Cho et al., Reference Cho, Min, Kanwal, Hyun, Park and Chung2009; Liu et al., Reference Liu, Liu, Ye, Liang, Xuan and Xu2009, Reference Liu, Guo, Hao and Liu2012; Xu et al., Reference Xu, Liu and Yong2009; Dong et al., Reference Dong, Li, Wang, Wang, Zhang, Yan and Sun2013; Lee et al., Reference Lee, Yoon, Hyun, Kim, Hwang, Bae and Chung2013) with respect to genetic diversity and stock identification. Most of these analyses, however, have mainly focused on restricted areas or have been performed based on limited number of samples. The geographic structure of swimming crab populations is still ambiguous. Notably, the genetic isolation of P. trituberculatus in the Bohai Sea from other areas due to the semi-enclosed nature of the Bohai Sea has been disputed (Guo et al., Reference Guo, Liu, Cui, Li, Cheng and Wu2012, Reference Guo, Cui, Wu, Hui, Liu and Wang2013; Liu et al., Reference Liu, Sun and Hurtado2013), and these studies reveal different population structures.
On the basis of the information above, in this study, we took six P. trituberculatus populations from the Bohai Sea, three Yellow Sea populations nearest to Bohai, one population from eastern Japan, one population from Ningbo representing the open East China Sea, and one population from Beihai in the South China Sea. We investigated the genetic structure of these P. trituberculatus populations along the China seas and Japan with partial mitochondrial control region (CR) sequences. By comparing with previous published data and with larger population size, this study aims to precisely reveal the genetic differentiation among populations at the CR level, especially the connectivity of populations from the Bohai Sea to the peripheral areas. Meanwhile, this work will reveal whether the population structure has changed over the studied years and identify factors that influence population gene flow. The results are also expected to provide useful information for fishery management for wild swimming crabs.
Materials and methods
Sampling and sequencing
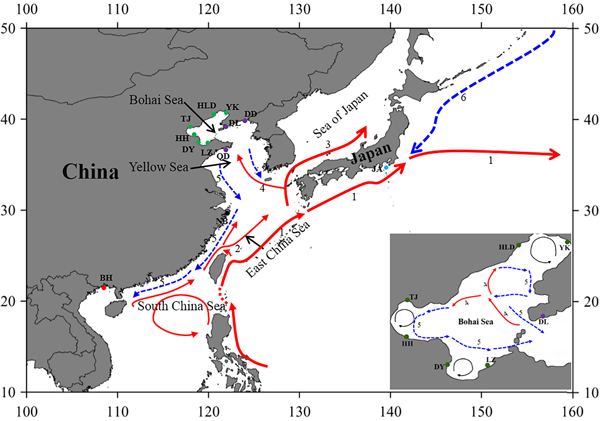
Muscle tissues were collected from P. trituberculatus (N = 247; 12 localities) along the China seas and Japan (Table 1; Figure 1) mainly in 2015, except that the Beihai (BH) population was sampled in 2013 and the Huanghua (HH) population in 2014. Among these locations, dense sampling was taken in the Bohai Sea, including six populations from Liaodong Bay, Bohai Bay and Laizhou Bay. The abbreviations of all sample sites were shown in Table 1. Tissues were preserved in 96% ethanol. Genomic DNA was extracted from the samples using the traditional phenol/chloroform method (Sambrook et al., Reference Sambrook, Fritsch and Maniatis1989). A fragment of CR region was amplified using P. trituberculatus specific primers (Guo et al., Reference Guo, Liu, Cui, Li, Cheng and Wu2012). PCRs were carried out in 50 µl volumes containing 10–100 ng template DNA, 1× PCR buffer, 0.2 mM dNTPs, 0.2 µM forward and reverse primers, and 1 U Taq DNA polymerase. PCR amplification was conducted under the following conditions: 5 min initial denaturation at 94°C, 35 cycles of 1 min at 94°C, 30 s at 55°C, 1 min at 72°C, and a final extension at 72°C for 5 min. PCR products were purified with the QIAquick PCR purification kit (Qiagen, Germany). Sequencing was conducted with an ABI 3730 automated sequencer (Applied Biosystems). Sequences were edited with the program Sequence Navigator (ver.1.0.1; Applied Biosystem) and aligned by ClustalW using the software BioEdit (ver.7.0). The sequences were compared with sequences in GenBank using BLASTN to check for orthology to the swimming crabs. The DNA sequences were then used for further analysis.

Fig. 1. Sample locations and the surface currents. 1. Kuroshio Current; 2. Taiwan Warm Current; 3. Tsushima Current; 4. Yellow Sea Warm Current; 5. China Coastal Current; 6. Oyashio Current. Please refer to Table 1 for abbreviations of sampling sites.
Table 1. Summary statistics for each population of Portunus trituberculatus: number of sequences (N), number of haplotypes (Nhp), number of private haplotypes (Np), haplotype diversity (h), nucleotide diversity (Л), units of mutational time (τ), Tajima's D, Fu's F S, sum of square deviation (SSD), and Harpending's raggedness index (HRI)

*0.01 < P < 0.05; **P < 0.01. The percentage of private haplotypes is shown in parentheses.
Genetic diversity, population structure and gene flow
Molecular diversity indices, including the number of haplotypes, haplotype diversity h (Nei, Reference Nei1987) and nucleotide diversity л (Nei & Jin, Reference Nei and Jin1989) were computed using the program Arlequin 3.5 (Excoffier & Lischer, Reference Excoffier and Lischer2010). The number of private haplotypes for each population was calculated manually.
To reveal genetic differentiation between populations, pairwise Φst-values were computed with Arlequin (Weir & Cockerham, Reference Weir and Cockerham1984). The significance of pairwise population comparisons was tested by using 10,000 permutations and P-values were obtained. Hierarchical AMOVA was performed among different geographic sampling populations using Arlequin in order to define spatial groups of populations that were maximally differentiated from each other (Φct). A minimum spanning tree (MST) of the haplotypes was drawn based on the results from Arlequin. Frequencies of the haplotypes were calculated and shown as pie diagrams, and the population origins of haplotypes were indicated by colours. In addition, we analysed the haplotype data phylogenetically by maximum likelihood (ML) method using RAxML Black-Box webserver (http://phylobench.vital-it.ch/raxml-bb/index.php; Stamatakis et al., Reference Stamatakis, Hoover and Rougemont2008). For the ML analysis, we selected the Gamma model of rate heterogeneity and assessed support for the tree nodes by the bootstrap method with 1000 replicates.
The isolation-by-distance (IBD) analysis with the reduced major axis (RMA) regression method was further conducted in order to determine whether there was a relationship between genetic distance (pairwise Φst values) and geographic distance. The shortest way by sea between populations was measured to represent the geographic distance using an electronic world atlas. A Mantel test was conducted to test the significance of the correlation with 30,000 permutations using the web service IBDWS (ver. 3.2.3; http://ibdws.sdsu.edu) (Jensen et al., Reference Jensen, Bohonak and Kelley2005).
Demographic history
To analyse demographic histories of mitochondrial DNA in the populations, two different approaches were used to test each population for departures from the neutral model due to selection or population growth. First, Tajima's D (Tajima, Reference Tajima1989) and Fu's F S tests (Fu, Reference Fu1997) were used to check for neutrality. Significant negative D and F S values can be interpreted as signatures of selection or demographic expansion. Historical demographic expansions were further explored based on the distribution of pairwise differences between sequences (mismatch distribution) (Rogers & Harpending, Reference Rogers and Harpending1992). The concordance of the observed distribution with the expected distribution under Rogers’ model of sudden population expansion was also tested using Arlequin and analysed graphically. The values of τ (units of mutational time) were converted to estimate time since expansion with the equation τ = 2ut (Rogers & Harpending, Reference Rogers and Harpending1992), where t = number of generations since expansion and u = μ × number of nucleotides sequenced, with μ representing the mutation rate of complete CR sequences. Because no molecular clock of CR for the swimming crab was available, we roughly estimated the relative rate of divergence in CR for the species, similar to the descriptions in Baldwin et al. (Reference Baldwin, Bass, Bowen and Clark1998) and McMillen-Jackson & Bert (Reference McMillen-Jackson and Bert2003). Since the cytochrome oxidase subunit I (COI) data for the same individuals in this study were also obtained in our lab, the nucleotide divergences of CR (2.2%) and COI (0.3%) were calculated by MEGA 7.0.26 (Kumar et al., Reference Kumar, Stecher and Tamura2016) respectively. Based on an average COI sequence divergence rate of 2.0% per MYA (Knowlton et al., Reference Knowlton, Weigt, Solórzano, Mills and Bermingham1993; Knowlton & Weigt, Reference Knowlton and Weigt1998; Schubart et al., Reference Schubart, Diesel and Hedges1998), we calculated the CR sequence divergence rate as 14.7% per MYA by comparing the nucleotide divergences between the CR and COI, resulting in a mutation rate of 7.35% per MYA, which was lower than the value of penaeid shrimp (19%, McMillen-Jackson & Bert, Reference McMillen-Jackson and Bert2003). Then, the time since expansion was calculated by the equation T = t × generation time, with the generation time for swimming crabs being one year.
Results
Genetic diversity of different populations
A 521 bp unambiguous CR alignment was obtained based on 247 specimens of the swimming crab. Sequence comparison of the segments from all individuals resulted in 151 haplotypes. In total, 116 variable sites were detected, among which 35 were singleton variable sites and 81 were parsimony informative sites. These populations revealed a high level of polymorphism and genetic diversity, with an overall haplotype diversity of 0.993 and nucleotide diversity of 0.025. Diversity indices of each population were shown in Table 1. The haplotype diversity ranged from 0.963 (HLD) to 1.000 (HH), while the nucleotide diversity was from 0.020 (DY) to 0.030 (JA). The private haplotype for each population was from 2 (YK) to 14 (NB, BH), with the highest percentage in BH population (82.35%).
Genetic population structure and gene flow
Overall, the data showed a significant genetic structure in an intermediate degree with an overall Φst value of 0.054 (P < 0.01) among all populations. When considering only the Bohai Sea region, the data revealed no significant population structure with a very low Φst value of 0.008 (P = 0.18).
The relationships among the swimming crab haplotypes were complicated (Figure 2). Haplotypes on the MST were separated by 1–11 mutations. Haplotypes from all collections were scattered throughout the MST and showed panmixia, and no geographic partitioning was evident except that the majority of haplotypes in the BH population (shown in purple) were clustered together. Bootstrap support values for most haplotype groupings on the ML trees were low, and many of them were lower than 60% (data not shown).
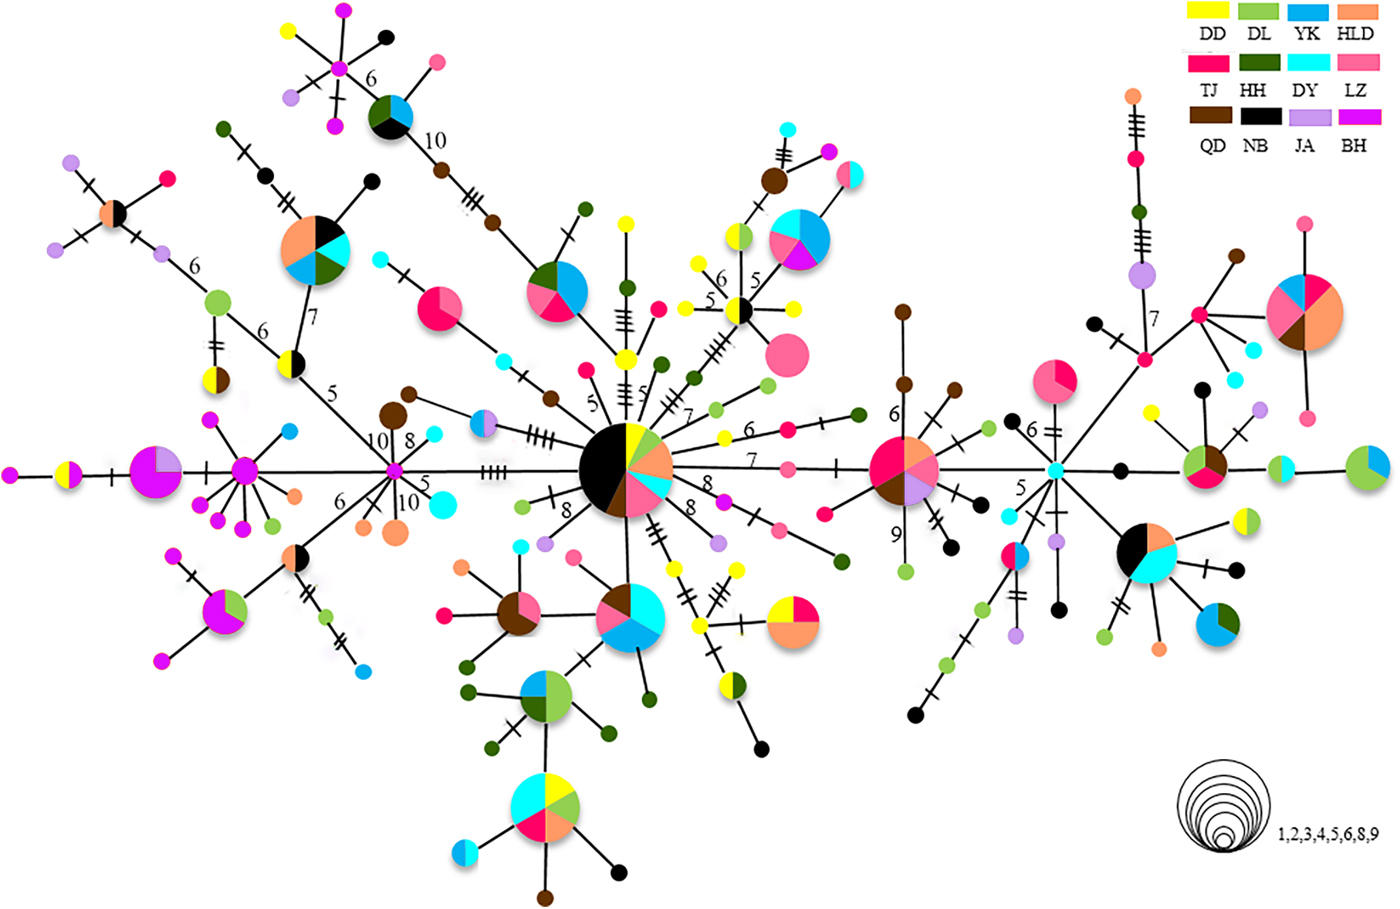
Fig. 2. Minimum spanning trees constructed from CR. The sizes of the circles are proportional to haplotype frequencies. Lines between circles each represent one mutational step. The hashmarks and numbers indicate additional mutational steps. The population origins of haplotypes are indicated by colours.
The genetic structures in P. trituberculatus populations were further evaluated based on pairwise Φst values and a hierarchical AMOVA. The BH population from the South China Sea was the most divergent population, showing significant differentiation from all other populations with pairwise Φst values from 0.148 to 0.232 (Table 2). The NB population was also divergent from some populations of the Yellow Sea and Bohai Sea, including DD, YK, HH, LZ and QD (Table 2). In the Yellow Sea populations, the DD population was differentiated from DL, HLD, TJ, DY, LZ and JA, while the DL population was divergent from HH and LZ (Table 2). The JA population was differentiated from HH, DY and LZ. Therefore, several Bohai Sea populations (HLD, TJ, HH, DY, LZ) showed weaker but significant genetic differentiation with the peripheral northern Yellow Sea populations (DD or DL). Among the populations in the Bohai Sea, significant differentiation was only found between TJ and HH (Table 2).
Table 2. Pairwise Φst values between populations of Portunus trituberculatus in the China seas and Japan

For abbreviations of sites see Table 1.
*0.01 < P < 0.05; **P < 0.01.
Based on geographic distance, hierarchical AMOVAs were carried out with different groupings (Table 3). AMOVA revealed the highest fixation index with Φct = 0.164 (P < 0.01), when the populations were clustered into two groups as follows: (1) DD, DL, YK, HLD, TJ, HH, DY, LZ, QD, NB and JA, and (2) BH. When the populations were divided into three groups, (1) DD, DL, YK, HLD, TJ, HH, DY, LZ, QD and JA, (2) NB and (3) BH, the second highest Φct = 0.101 (P < 0.05) was observed. However, when the populations were assigned into four groups according to the seas in which they were located (Bohai Sea: YK, HLD, TJ, HH, DY, LZ; Yellow Sea and Japan: DD, DL, QD, JA; East China Sea: NB; South China Sea: BH), no significant genetic differentiation was detected, with Φct = 0.048 (P > 0.05). When only the populations from the Bohai Sea were considered and subcategorized into three groups according to their geographic distance, no differentiation was found among these groups (Φct = −0.010, P > 0.05).
Isolation-by-distance with a Mantel test revealed a positive correlation between geographic and genetic distance when all populations were included (r = 0.76; P < 0.05). However, when the highly divergent population BH was excluded, the positive correlation among populations was not significant (r = 0.26; P = 0.13). When considering only the Bohai Sea populations, the test revealed a non-significant negative correlation between geographic and genetic distance (r = −0.36; P = 0.91).
Table 3. Hierarchical analysis of molecular variance (AMOVA) of CR sequences in the populations of Portunus trituberculatus along the China seas and Japan

For abbreviations of sites see Table 1.
*0.01 < P < 0.05; **P < 0.01.
Demographic history
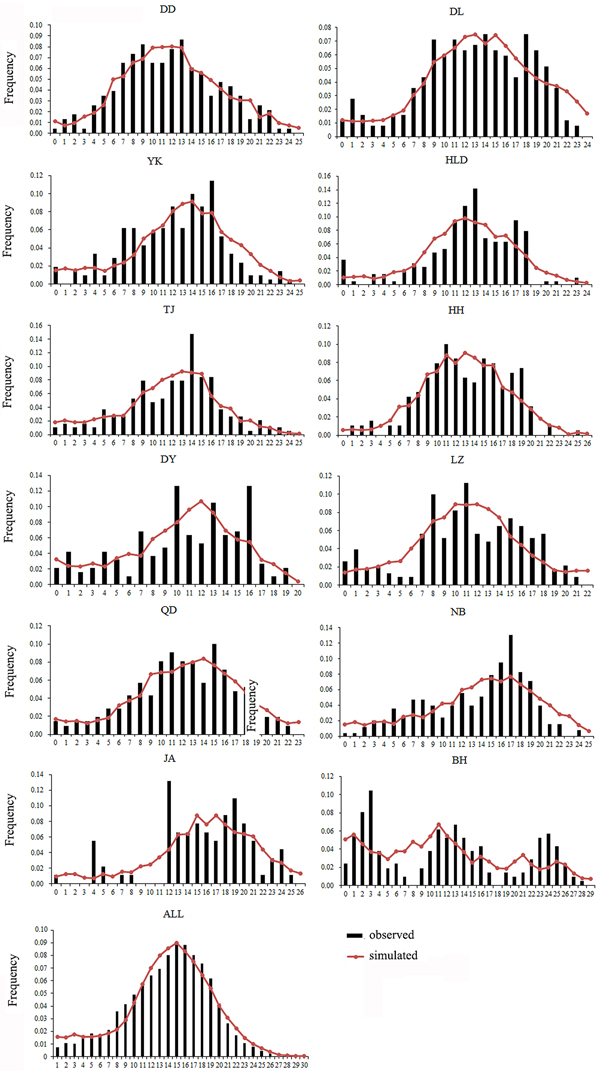
Both a neutrality test and mismatch distribution were performed for each population. Many populations (DD, DL, TJ, HH, QD, NB) showed significant negative F S values (Table 1), which indicated significant departure from mutation-drift equilibrium. Compared with Tajima's D, Fu's F S has more power to detect population growth and genetic hitchhiking (Fu, Reference Fu1997), indicating departures from neutral expectations of the utilized marker, while the opposite is true for background selection. The mismatch distribution analysis and Rogers’ test of sudden population expansion indicated there was population expansion in the swimming crabs (Table 1, Figure 3) (Rogers, Reference Rogers1995). The estimated time of initiation of expansion (T) for the species ranged from 185,841 years ago, dating back to the middle Pleistocene.
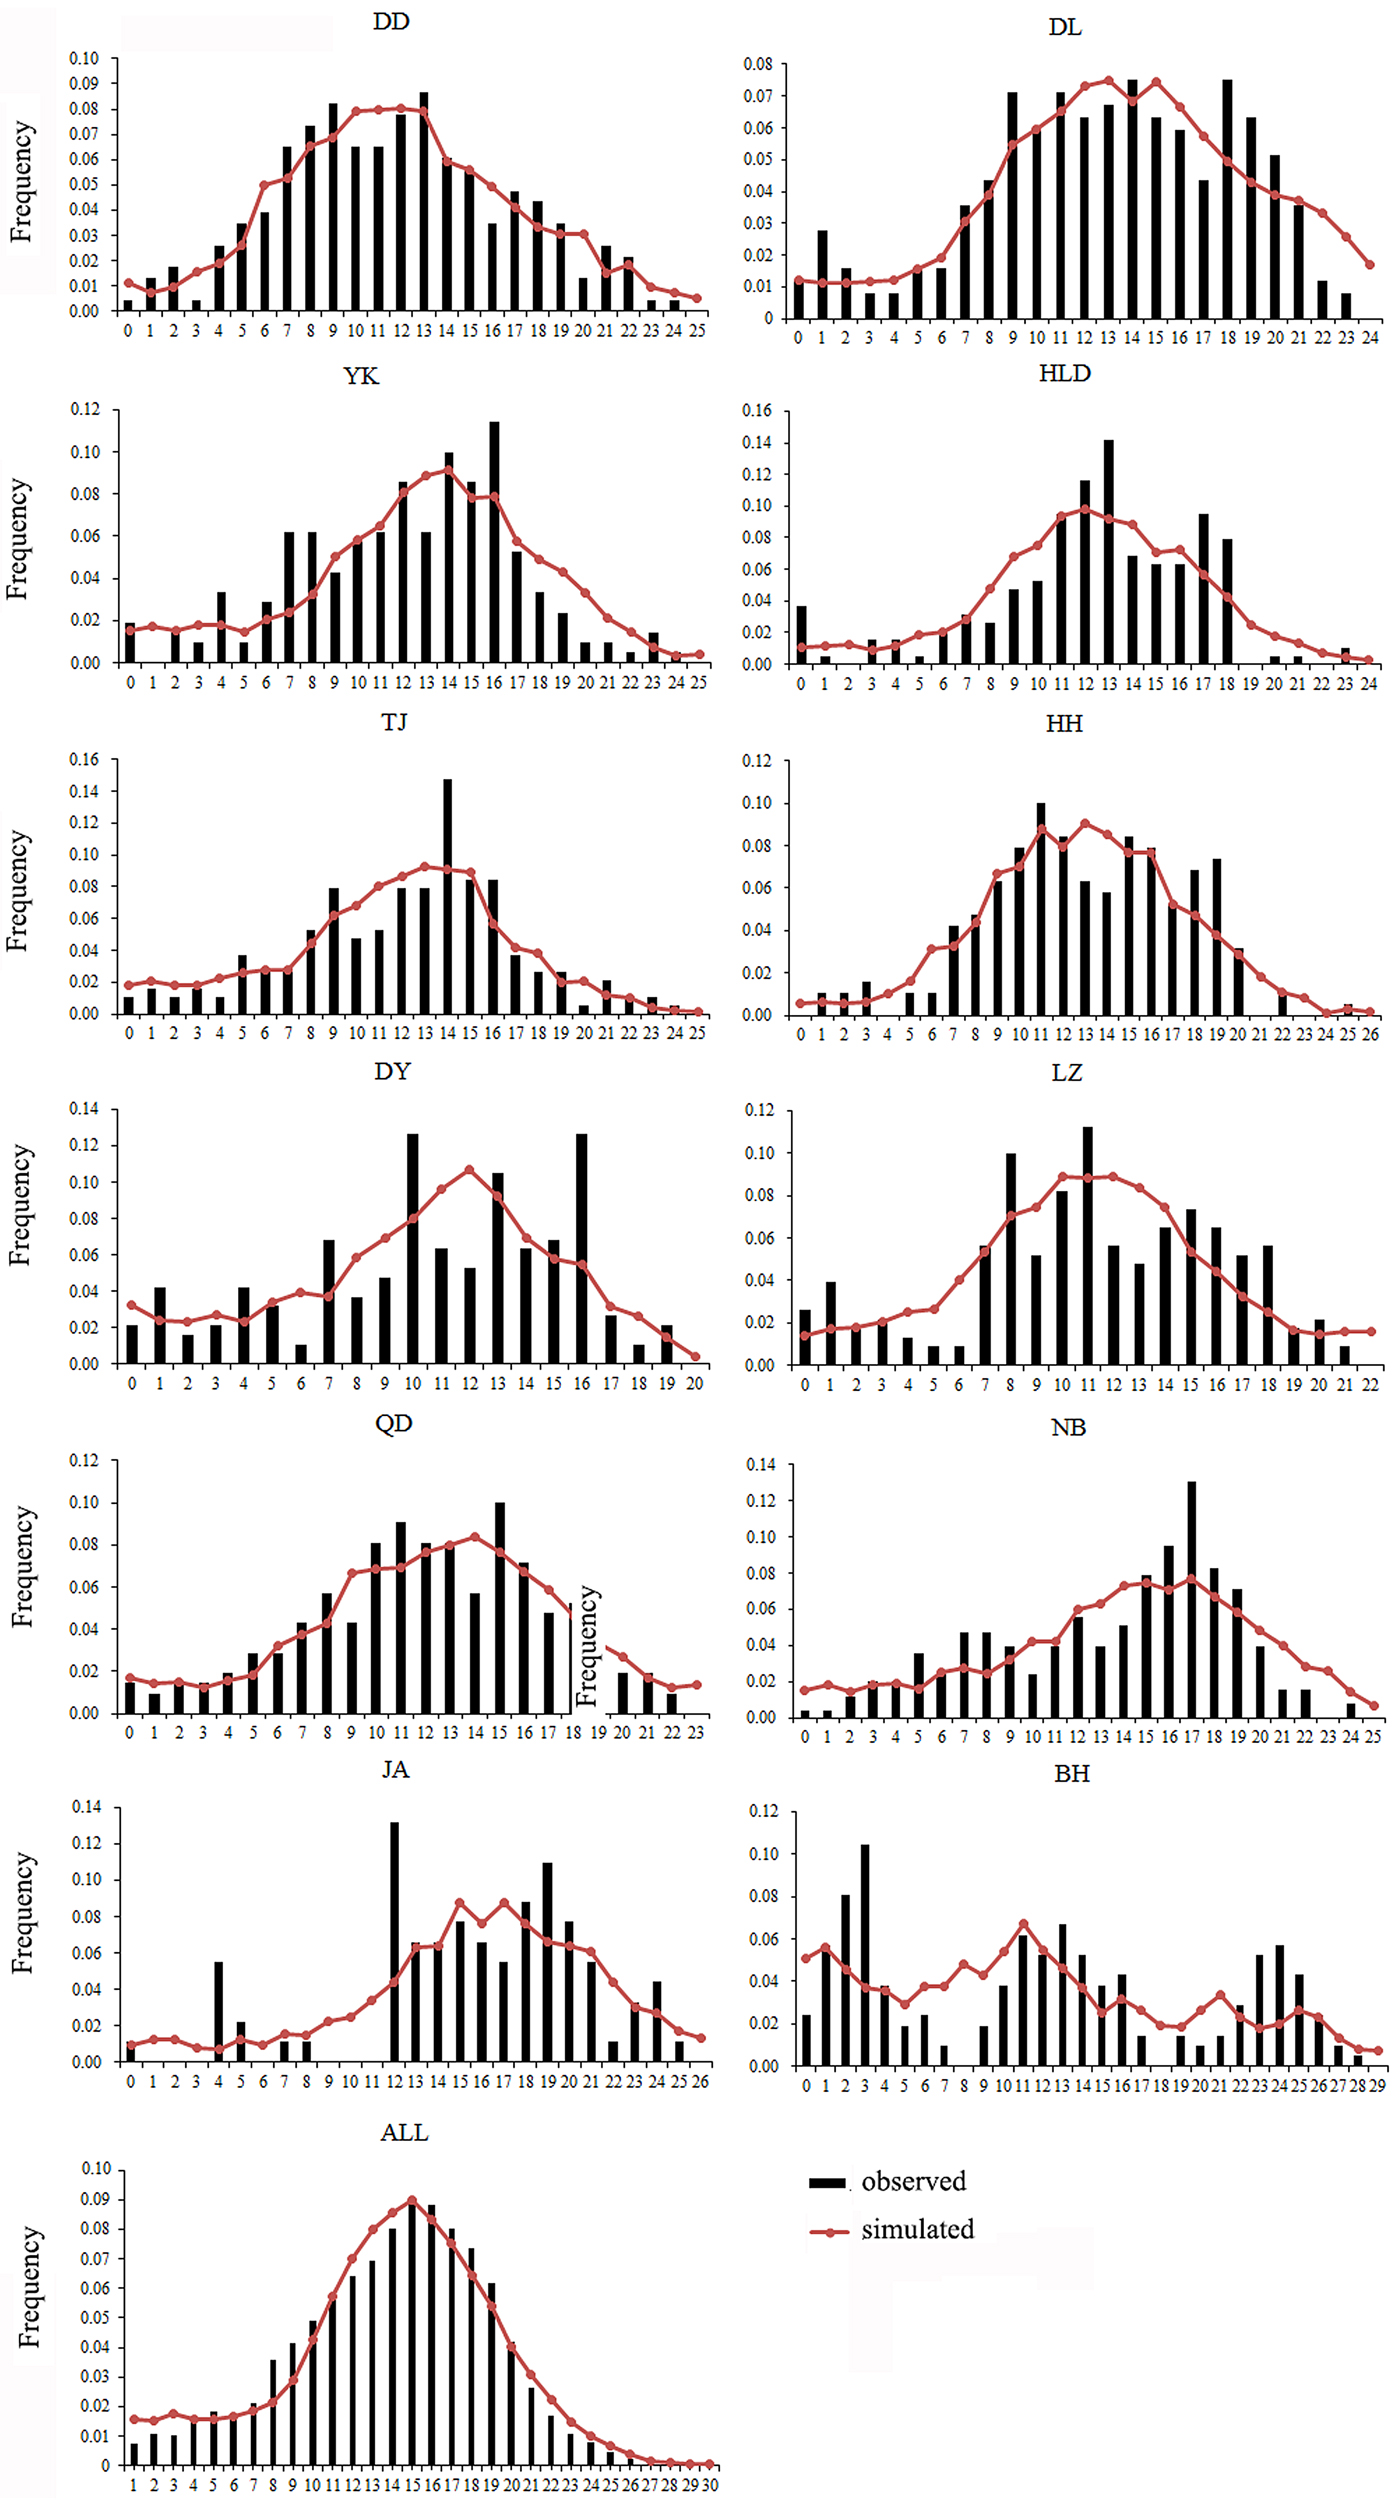
Fig. 3. Mismatch distribution for each population. Bars represent the observed frequency of pairwise differences, whereas the lines show the expected values under the sudden expansion model.
Discussion
In this study, high genetic diversities of P. trituberculatus populations along the China seas and Japan were observed using CR markers, and significant differentiation was revealed among populations. All sampled populations could be generally categorized into two groups, and the BH population was greatly divergent from all other populations. Although no significant genetic structure was detected in the AMOVA analysis for populations of the Bohai Sea, Yellow Sea, East China Sea and Japan, pairwise comparisons indicated that lower levels of differentiation existed among certain populations and even between TJ and HH, which were both from the Bohai Sea. Population expansion was detected in the swimming crab.
High population genetic diversity
All populations in this study exhibit high genetic diversity, with overall haplotype diversity and nucleotide diversity of 0.993 and 0.025, respectively. These are comparable to those of populations in Korea (Cho et al., Reference Cho, Min, Kanwal, Hyun, Park and Chung2009) and slightly higher than those (h = 0.990; л = 0.020) in another study for P. trituberculatus populations in the China seas and Japan using CR markers (Guo et al., Reference Guo, Liu, Cui, Li, Cheng and Wu2012). By further comparison, the genetic diversity of the LZ population is far higher in this study than in the previous one, which may result from the larger sample size here. Therefore, we suggest that sufficiently large population size is necessary for studies of population genetics. High genetic diversities are also found in other marine crab populations and can be characterized as a common feature of marine crustaceans, including the lined shore crab Pachygrapsus crassipes (Cassone & Boulding, Reference Cassone and Boulding2006), the mud crab S. paramamosain (Ma et al., Reference Ma, Cui, Ma and Ma2012), the giant tiger prawn Penaeus monodon (Khedkar et al., Reference Khedkar, Reddy, Ron and Haymer2013) and the pink shrimp Farfantepenaeus duorarum (McMillen-Jackson & Bert, Reference McMillen-Jackson and Bert2015). The large population size may contribute to preserving high levels of genetic diversity (Grant & Cheng, Reference Grant and Cheng2012) in these species, and a high nucleotide mutation rate of CR may be another reason for the high genetic diversity.
Genetic connectivity of populations in the Bohai Sea and the ‘open’ seas
The Bohai Sea is a semi-closed sea, which has relatively poor water exchange with its neighbouring sea. However, the populations of P. trituberculatus show a high level of gene flow between the Bohai Sea and Yellow Sea. Most pairwise Φst-values are not significant, further emphasizing high connectivity among these populations. The passive transport of larvae that is induced by the inter-circulated currents along with adult migration, may prevent differentiation among populations. The Yellow Sea Warm Current and China Coastal Current in these seas connect most populations in the Bohai Sea and Yellow Sea very well, as shown in Figure 1. However, in pairwise comparisons, some populations in the Bohai Sea still show shallow but significant genetic divergence with those in the nearby basin, such as LZ/DY/TJ vs DD, and LZ/HH vs DL. LZ, DY and TJ are all to the south of DD/DL, and the connectivity might be mainly to the south of the Yellow Sea, as directed by the China Coastal Current. The genetic divergence of swimming crab populations in the Bohai Sea from the peripheral areas have also been reported in other studies by nucleotide AFLP or microsatellite markers (Guo et al., Reference Guo, Cui, Wu, Hui, Liu and Wang2013; Liu et al., Reference Liu, Sun and Hurtado2013), but only a limited number of populations in Bohai Sea are included in those studies. Additionally, it is surprising that significant genetic differentiation is also detected between TJ and HH, which are both located in Bohai Bay. Therefore, the results indicate that it is important to perform population genetic studies in small-scale areas and by combination of different marker systems in order to completely elucidate the population connectivity and differentiation.
Generally, no major barriers currently exist along the coast of the Yellow Sea and South China Sea, and around Japan, the Kuroshio and Tsushima Currents could also link the JA population with populations from other areas. This population connectivity is also observed in other studies for marine species along the eastern coast of China, such as in Calanus sinicus (Tan et al., Reference Tan, Lin, Cao, Chen and Yang2003) and S. paramamosain (He et al., Reference He, Zhang, Weese, Zhu, Jiang and Qiao2010; Ma et al., Reference Ma, Cui, Ma and Ma2012). Many investigations in marine organisms have shown that the species with a PLD stage are more influenced by marine currents (Baus et al., Reference Baus, Darrock and Bruford2005; Kenchington et al., Reference Kenchington, Patwary, Zouros and Bird2006), as this type of life history provides a large capacity to disperse widely over the ocean and results in spatial homogeneity of their genetic structure. However, it must be noted that based on the pairwise comparisons in this study, the NB population displays low but significant genetic differentiation from several populations from the Bohai Sea and Yellow Sea (Table 2). A similar divergence pattern has also been detected in another study of swimming crabs, which suggests that human interference might be an explanation for the differentiation of the NB population (Guo et al., Reference Guo, Liu, Cui, Li, Cheng and Wu2012). However, no differentiation has been found between the NB population and the other four populations from the Bohai Sea and Yellow Sea (Table 2). Therefore, the differentiation of the NB population from several populations in the Yellow Sea and Bohai Sea is uncertain, possibly due to the lack of sampling in the northern East China Sea and southern Yellow Sea.
Genetic endemism of the BH population
The population of BH is highly divergent. It has specific dominant haplotypes clustered in one group (Figure 2). When the BH population is compared with others, it shows high Φst values. In the hierarchical AMOVA, the highest Φct value is reached when the BH population is regarded as a separate group. The high divergence of BH has also been found in previous studies on P. trituberculatus (Guo et al., Reference Guo, Liu, Cui, Li, Cheng and Wu2012, Reference Guo, Cui, Wu, Hui, Liu and Wang2013). The significant divergence of BH population might be related to the special geographic setting of BH, located in Beibu Bay. Hainan Island and Leizhou Peninsula may act as barriers causing limited connectivity to areas further north and blocking gene flow. The tropical and subtropical climate may also make Beibu Bay a unique habitat with a high effective accumulated temperature in comparison with other north population sites. Moreover, as there is more than 2000 km between BH and the nearest, NB, the long geographic distances from other populations could be another important factor limiting the spatial gene flow, as revealed by the IBD analysis. Samples from the coast of South-east Asian countries, such as Vietnam, the Philippines or Malaysia, may provide a more complete picture of population connectivity, reflecting populations further south. Although we are lacking data from P. trituberculatus in these areas, a previous study reported high levels of gene flow among the populations of P. pelagicus (a species closely related to P. trituberculatus) in the coastal areas of Malaysia (Chai et al., Reference Chai, Esa, Ismail and Kamarudin2017). Genetic differentiation of BH populations has also been found in the pearl oyster Pinctada fucata (Yu & Chu, Reference Yu and Chu2006) and the tiger prawn P. monodon (Zhou et al., Reference Zhou, Jiang, Jiang, Huang and Ma2009). Moreover, a new species of sea-snake has been discovered in Beibu Bay. All these results suggest that Beibu Bay might be part of an important evolutionary centre located in south-eastern Asia with a very high diversity of marine species (Hall, Reference Hall2002).
Effects of geological events on population structure
As is well known, the Pleistocene is mainly characterized by global climate changes that could have greatly influenced the biota evolution. The West Pacific marginal seas, e.g. the Bohai Sea, the Yellow Sea, the East China Sea and the South China Sea, changed drastically in area and environments through the late Quaternary glacial cycles. The distribution and abundance of marine species also experienced changes through the loss and regaining of habitats, especially during the middle to late Pleistocene glacial-interglacial cycles (Dynesius & Jansson, Reference Dynesius and Jansson2000; Hewitt, Reference Hewitt2000; Habib et al., Reference Habib, Jeong, Myoung and Lee2015). In particular, this study reveals that a major demographic expansion in the populations of P. trituberculatus occurred in the middle Pleistocene (Table 1, Figure 3). Glacial-interglacial climate fluctuations in this period may have resulted in changes in sea level as well as habitat contractions or expansions, which may cause ancient vicariance and postglacial dispersal of P. trituberculatus. Specifically, the rising sea level during the interglacial period might have caused major events of marine transgression in the West Pacific Ocean due to the shallow continental shelves (Wang, Reference Wang1999; Voris, Reference Voris2000). Demographic expansions and range extension of the species would accompany a series of colonizing events in the newly occupied habitats. Subsequently, most populations in the ‘open’ seas were well connected by surface currents, such as the Kuroshio and Tsushima Currents, while others were separated by geographic barrier when the continental shelf was exposed as dry land after sea level fell, and followed by divergent evolution, e.g. the BH population. However, phylogeographic studies of other co-distributed and closely related organisms are warranted, which will provide more insights into the biogeographic history of the studied areas and species.
Implications for the fisheries
Portunus trituberculatus is one of the most heavily fished brachyurans in the world. Due to overfishing, destruction of nursery grounds and marine pollution, the landing of this crab has declined in eastern parts of the China seas since the 1990s (Yu et al., Reference Yu, Song, Yao and Lu2006). However, there have been few serious attempts to manage this resource based on scientific evidence. In China, crabs are non-selectively harvested during certain periods (Xuan et al., Reference Xuan, Guan, Bao, Tang, Tang and Zhou2014), and the situation now urgently requires conservation management.
In this study, the restricted gene flow between groups in the swimming crabs indicates there are two genetically distinct groups within the species along the China seas: (1) the BH population and (2) all of the other populations. It is suggested that management should put more effort into maintaining adaptive diversity in these separated groups and on preservation of the genetic connectivity among populations (Crandall et al., Reference Crandall, Frey, Grosberg and Barber2008). In the Bohai Sea and Yellow Sea, most populations are very well connected, probably due to the strong currents. Swimming crabs have a PLD of about 20 days and they should be able to travel thousands of kilometres. However, because of the low but significant genetic differentiation between Bohai Bay, Laizhou Bay and north-west Yellow Sea populations, management efforts should also consider smaller and local scales to maintain and enable population connectivity within the separated regions (Palumbi, Reference Palumbi2003). On the other hand, we suggest preserving their different genetic diversity resources, and we should also maintain their gene flow to increase their diversity. Moreover, our study reveals some differences in genetic diversity and genetic structure compared with the results of Guo et al. (Reference Guo, Liu, Cui, Li, Cheng and Wu2012) also using CR. Swimming crabs have long been released from hatcheries in China (Yang et al., Reference Yang, Song, Zhang, Wang, Wang and Gao2014), and this might have a strong effect on the genetic population diversity and structure of wild populations. Liu et al. (Reference Liu, Guo, Hao and Liu2012) found a significant reduction in the genetic diversity of hatchery populations. Genetic monitoring is thus required to preserve existing genetic variations in wild populations, and this will in turn contribute to promoting the conservation and enhancement of this exploitable resource. Hence, the distinct genetically distinct groups, connectivity pattern among populations, and genetic diversity data revealed in this study are expected to serve as a resource for fishery management of the swimming crabs.
Acknowledgements
The authors wish to thank the fishermen for the support during collection of samples and other fieldwork.
Financial support
This work was supported by grants from the National Natural Science Foundation of China (31302187) to Dr Hui and the project of the S & T basic work from the Ministry of Science and Technology of China (2013FY110700) to Dr Sha.