


INTRODUCTION
Neuropsychological tests are often administered repeatedly to the same person. For example, a clinician may administer the same test multiple times to monitor change in the cognitive abilities of people who are demented, or a researcher may administer a neuropsychological test repeatedly as part of a randomized clinical trial to evaluate a novel pharmaceutical treatment. When performing serial testing to evaluate deterioration or improvement in cognitive functioning, it is of crucial importance to understand the relationship between earlier and later test administrations. Indeed, a serious problem in serial testing is that varying test results may occur even when there was no true change in the cognitive status of a person (Beglinger et al., 2005). This problem is mainly attributable to the less than perfect temporal stability of test scores and the occurrence of test–retest effects such as practice effects (Temkin et al., 1999).
Statistical methods for comparing groups over time are well-developed and straightforward, but there has been serious controversy on which statistical approach is most appropriate for assessing changes in performance over time in individuals (see Collie et al., 2004; Heaton et al., 2001; Temkin et al., 1999). The Reliable Change Index with correction for practice (RCI; Chelune et al., 1993, see also Jacobson & Truax, 1991) and the regression-based follow-up approach (Temkin et al., 1999) are two of the most frequently used methods for assessing the significance of changes in test scores. However, both methods have some disadvantages. According to the RCI method, the predicted change in the performance of an individual equals the mean change score of a normative sample. The RCI method thus presupposes identical means (and SDs) of change for different subgroups as based on age, gender, and educational level. This assumption is often violated (Dikmen et al., 1999). In the regression-based follow-up approach (Temkin et al., 1999), the follow-up scores are predicted based on the baseline scores and the demographical variables in a normative sample. Van Breukelen (2006) has shown that this approach is biased when there are group differences in the baseline score (e.g., significant differences in the baseline scores of males and females). Indeed, a phenomenon known as Lord's analysis of covariance paradox (Lord, 1967, 1969) is encountered when follow-up scores are analyzed with the baseline score as a covariate and when group differences are present in the baseline scores. For example, when the mean difference between the follow-up scores of males and females are equal to the mean difference between the baseline scores of males and females, a significant effect of gender on the follow-up measure will nevertheless be found. The assumption of equal baseline scores is likely to be violated in the regression-based follow-up approach, because it has been consistently shown in previous research that factors such as age, gender, and level of education affect baseline performance on most neuropsychological tests profoundly (Lezak et al., 2004; Mitrushina et al., 1999).
Thus, with respect to evaluating the significance of changes in neuropsychological test performance over time, neither the RCI (Chelune et al., 1993) nor the regression-based follow-up (Temkin et al., 1999) approach is optimal. In the present study, a new approach was used in which change scores (= follow-up score minus baseline score) were regressed on the relevant demographical variables. This approach is termed the regression-based change approach. In contrast to the RCI method, the regression-based change approach does not assume equal means and SDs of change for different subgroups because the predicted change scores can be appropriately corrected for the influence of relevant independent variables. Additionally, unlike the regression-based follow-up approach, the regression-based change approach is not biased, because equal baseline scores for different demographical groups are not assumed.
In the present study, the regression-based change approach was used to evaluate the effects of age, gender, and level of education on changes in performance on the Rey's Verbal Learning Test (VLT; Rey, 1958), the Stroop Color-Word Test (SCWT; Stroop, 1935), and the Letter Digit Substitution Test (LDST; Van der Elst et al., 2006a). The analyses were based on a large sample of middle-aged and older healthy adults who were administered these neuropsychological tests with a test–retest interval of 3 years. A normative change table is provided so that clinicians and researchers can easily evaluate the significance of an individual's changes in test performance after 3 years.
METHOD
Participants
Data were derived from the Maastricht Aging Study (MAAS), a prospective study into the determinants of cognitive aging. MAAS involves a large group of cognitively intact people (N = 1856 at baseline) over the entire adult age range (24–81 years at baseline) who underwent extensive cognitive examinations. Baseline measurements were conducted between 1993 and 1996. The follow-up frequency in MAAS was dependent on the age at baseline (i.e., 3 years for people aged 49 years and older). A total sample of 1048, 776, and 1,047 people aged above 49 were administered the SCWT, VLT, and LDST at baseline, respectively1
Note that a visual as well as an auditory VLT version was used at baseline in MAAS. The auditory and visual versions of the VLT were administered to one-quarter and three-quarters of the sample, respectively. The participants were divided at random over the auditory and visual conditions on a 1:3 basis, but with the restriction that the proportion of participants who were given the visual versus auditory VLT was equal for each age group × level of education × gender subgroup. At follow-up, all participants were given the visual version of the VLT. Only the data derived from the participants who were given the visual VLT version on both test occasions were used in the present study, because mode of presentation was found to affect test performance profoundly (Van der Elst et al., 2005). Consequently, the total data sample for the VLT was about one-quarter smaller than the data samples for the SCWT and LDST.
Follow-up measurements were conducted approximately 3 years later (mean test–retest interval equaled 3.13 years; SD, .24 years). All people who participated at baseline were invited to take part in the follow-up measurement, irrespective of their baseline scores on the SCWT, VLT, and LDST. Follow-up data were available for a total of 781, 612, and 805 people for the SCWT, VLT, and LDST, respectively. Drop-out percentages equaled 20.8%, 19.0%, and 21.7% for the respective tests. Again, not all available follow-up data were used in the analyses, as the following exclusion criteria were used: technical problems during test administration (n = 8 for the SCWT, n = 12 for the VLT, and n = 5 for the LDST) and physical or cognitive limitations of the testee that hampered test administration (n = 4 for the SCWT). In addition, the data of those participants who had declined more than one MMSE point per year were excluded from the analyses (i.e., the data from people who declined more than three MMSE points from baseline to follow-up; n = 18, n = 15, and n = 18 for the SCWT, VLT, and LDST, respectively). This additional exclusion criterion was used to ensure that the clinical cognitive status of the individuals in the normative sample remained unchanged from baseline to follow-up (Tombaugh, 2005). It, therefore, warranted the exclusion of data provided by participants whose general cognitive abilities became severely impaired over the course of the study (due to, e.g., dementia or another neurological condition). Complete data both at baseline and follow-up were available for a total of 751, 585, and 782 participants for the SCWT, VLT, and LDST, respectively. These data were analyzed in the present study.
The ethnic background of all participants was Caucasian, and all participants were native Dutch speakers. Level of education (LE) was measured by classifying formal schooling in three groups—those with at most primary education (LE low), those with junior vocational training (LE average), and those with senior vocational or academic training (LE high). These three levels of education corresponded with a mean (± SD) of 8.29 (± 1.65), 10.20 (± 2.06), and 13.78 (± 3.14) years of full-time education, respectively. Basic demographical data for the sample at baseline and at follow-up are provided in Table 1 for three age groups (49–56 year, 59–66 year, and 69+ years). More details regarding the sample frame, subject inclusion procedure, stratification criteria, attrition, and other aspects of the MAAS study have been described in detail elsewhere (Jolles et al., 1995). The medical ethics committee of Maastricht University approved the study and all participants gave their informed consent.
Demographic characteristics of the sample of participants who were administered the SCWT, VLT, and LDST at baseline (left) and at follow-up (right)

Procedure and Instruments
All participants were administered the SCWT, VLT, and LDST individually at the neuropsychological laboratory of the Brain & Behaviour Institute (Maastricht, Netherlands). The SCWT (Stroop, 1935) measures cognitive flexibility and control (Uttl & Graf, 1997) or executive functioning (Moering et al., 2003). The Hammes SCWT version (1973) was used in the present study. This SCWT version consists of three subtasks. The first subtask shows color words in random order (red, blue, yellow, green) printed in black ink. Subtask two displays solid color patches in one of these four basic colors. The third subtask contains color words printed in an incongruous ink color. Each subtask involves 100 stimuli that are evenly distributed in a 10 × 10 matrix. The SCWT Interference measure served as the main outcome variable (SCWT Interference = time in seconds to complete the 100 stimuli of subtask three − [{time in seconds to complete the 100 stimuli of subtask 1 + time in seconds to complete the 100 stimuli of subtask 2}/2]; Van der Elst et al., 2006b). The SCWT versions used at baseline and follow-up were identical.
The VLT (Rey, 1958) is a frequently used measure of verbal memory. In this test, 15 words were presented one by one on a computer screen in fixed order, with a presentation time of 1 second and an interstimulus interval of 1 second. The first trial was followed by four more trials in which the words were presented in identical order. After a delay of 20 minutes, and unexpectedly for the participants, the instruction was given to recall the words learned once more. Finally, a recognition trial was administered. Outcome variables used in the present study were the total number of correctly recalled words summed over the first three trials (VLT Total recall 1–3), the total number of correctly recalled words summed over the first five trials (VLT Total recall 1–5), and the number of correctly recalled words after the 20-minute delay (VLT Delayed recall). Alternate VLT versions (that were considered to be parallel; Brand & Jolles, 1985) were used at follow-up and baseline. The Total recall 1–3 score was used in addition to the more frequently used Total recall 1–5 score, because ceiling effects are often observed in the VLT: the increase in the number of words recalled is especially pronounced during the first three learning trials, which makes the scores for the last two learning trials to some extent redundant (Van der Elst et al., 2005).
The LDST (Jolles et al., 1995) is a measure of general speed of information processing (Van der Elst et al., 2006a). It is procedurally identical to earlier developed substitution tests such as the Digit Symbol Substitution Test (Wechsler, 1981), but uses over-learned signs instead of the symbols used in other substitution tests. The LDST key gives the numbers 1 to 9, each of them paired with a different letter. Participants were required to replace the randomized letters with the appropriate digit indicated by the key, as fast and accurately as possible. The number of correct substitutions made in 60 seconds served as the dependent variable. The LDST versions used at baseline and follow-up were identical.
Data Analysis
The test scores at baseline and at follow-up are referred to by adding the subscripts b and f to the variables' names, respectively (i.e., Scoreb and Scoref). Test–retest reliabilities of the test scores were estimated by calculating the Pearson correlations between the Scoreb and Scoref values (note that the correlations between the VLTb and VLTf scores are actually not real test–retest correlations, because parallel test versions were used: such correlations are usually referred to as “coefficients of equivalence”; Franzen et al., 1989). The change scores were expressed in effect size units (Cohen's d = mean [Scoref − Scoreb]/SD[Scoref − Scoreb]; Cohen, 1992) to allow for comparisons between the various measures.
Next, the change scores (= Scoref − Scoreb) were regressed on age, age2, gender, level of education, and all possible two-way interactions (the full models). Age was centered (Age = calendar age − 62.5) before computing the quadratic terms and interactions to avoid multicollinearity (Marquardt, 1980). Gender was dummy coded with male = 1 and female = 0. The LE was dummy coded with two dummies (LE low and LE high) and LE average as the reference category. The full models were then reduced in a stepwise manner by eliminating the least significant predictor if its two-tailed p value was above .005, keeping lower order effects in the model as long as they were involved in a higher order term (the final models). For each final model, the assumptions of homoscedasticity, normal distribution of the residuals, absence of multicollinearity, and absence of “influential cases” were checked. Homoscedasticity was evaluated by grouping the participants into quartiles of the predicted scores and applying the Levene test to the residuals. Normal distribution of the standardized residuals was investigated by conducting Kolmogorov-Smirnov tests on the residual values. The occurrence of multicollinearity was checked by calculating the Variance Inflation Factors (VIFs), which should not exceed 10 (Belsley et al., 1980). Cook's distances were calculated to identify possible influential cases (Cook & Weisberg, 1982).
Three steps are conducted to evaluate whether significant change had occurred in an individual. First, the predicted change scores are calculated by using the final regression models, that is, predicted change score = B0 + B1 X1 + ··· + Bn Xn. Second, the standardized residuals of the change scores are calculated, that is, ([sign] [observed change score − predicted change score])/SD(residual). The (sign) equals +1 in case a higher raw test score indicates better performance (i.e., the LDST and VLT measures), and −1 in case a higher score means worse performance (i.e., the SCWT measure). Third, the standardized residuals of the change scores are compared with the 90% confidence interval (CI) of the standardized change scores. If the standardized residual of an individual's score falls between the lower and upper ends of the 90% CI (i.e., between −1.645 and 1.645), no significant change has occurred. If it falls below (or above) the lower end of the 90% CI, significant deterioration (or improvement) had occurred. Note that the value 1.645 comes from the standard normal distribution (i.e., 5% deterioration, 5% improvement). In case the standardized residuals of the change scores in the normative sample are not normally distributed, the values −1.645 and 1.645 should be replaced by the observed 5th and 95th percentiles of the distribution of the standardized residuals, respectively.
The three-step procedure to evaluate whether significant change had occurred in an individual is quite cumbersome and is susceptible to making computational errors. Therefore, a user-friendly normative table was also established so that the change in an individual's scores can be evaluated without making any calculations. In this table, the lower and upper ends of the 90% CIs for the raw change scores are presented. The raw change scores are calculated as (sign) (Scoref − Scoreb), with (sign) equaling +1 in case a higher raw test score indicates better performance (i.e., the LDST and VLT measures), and −1 in case a higher score means worse performance (i.e., the SCWT measure). In case the individual's observed raw change scores falls below (or above) the lower (or upper) end of the CI, significant deterioration (or improvement) had occurred.
All analyses were conducted using SPSS 14.0 for Windows. The level of alpha error was set to .005 in all analyses. A lower αlevel (p = .005) was used in the analyses to avoid Type I errors due to multiple testing.
RESULTS
Reliability and Effect Sizes
As shown in Table 2, significant test–retest correlations were observed for all measures (all ps < .001). The reliability was high for the LDST score (r > .85) and acceptable for the SCWT Interference, the VLT Total recall 1–3, the VLT Total recall 1–5, and the VLT Delayed recall scores (r > .60). Effect sizes were medium for the VLT Total recall 1–3 and VLT Total recall 1–5 scores (i.e., d ≥ .50; Cohen, 1992), and small for the SCWT Interference, VLT Delayed recall, and LDST measures.
Test–retest results of the baseline (Scoreb) and follow-up (Scoref) scores: means, SDs, SDs of the change scores (Scoref − Scoreb), T values of the paired differences, test–retest correlations, and effect sizes (Cohen's d) of the SCWT, VLT, and LDST measures

The Multiple Linear Regression-Based Approach to Assess Change
The final linear regression models for the

, VLT Total recall 1–3, VLT Total recall 1–5, VLT Delayed recall, and LDST change measures are shown in Table 3. The SCWT Interference change score was square root transformed because preliminary data analyses showed that the residuals were positively skewed before transformation of the scores (data not shown). A constant of 100 was added because negative SCWT Interference change scores occurred in the normative sample.
Final multiple linear regression models for the , VLT Total recall 1–3, VLT Total recall 1–5, VLT Delayed recall, and LDST change scores; the full models included Age, Age2, Gender, LE low, LE high, and all two-way interactions as predictors

There was no multicollinearity for any of these models (maximum VIF for the final models = 2.003). The Levene test rejected the homogeneity of variance assumption for the model of the

score. This was taken into account by calculating the SD(residual)s per quartile of the predicted

scores (Van Breukelen & Vlaeyen, 2005), that is, SD(residual) equals .607 for predicted scores below 9.991, .709 for predicted scores between 9.992 and 10.101, .847 for predicted scores between 10.102 and 10.219, and 1.253 for predicted scores above 10.220. The SD(residual)s to be used in the standardization of the VLT Total recall 1–3, VLT Total recall 1–5, VLT Delayed recall, and the LDST change scores equal 4.603, 7.044, 2.362, and 3.651, respectively. The standardized residuals for the

scores were not normally distributed (p of the Kolmogorov-Smirnov Z < .005). Thus, the 5th and 95th percentiles of the distribution of the observed standardized residuals in the normative sample should be used to establish the 90% CI of the standardized change scores, that is, −1.435 (5th percentile) and 1.381 (95th percentile). No severe influence of outliers was found for any of the models (maximum Cook's d = .28).
The VLT Total recall 1–3, VLT Total recall 1–5, and VLT Delayed recall change scores were significantly affected by age (see Table 3) and decreased linearly from approximately 4.1, 6.2, and 1.5, respectively, for people aged 50 years at baseline, to 1.2, 1.7, and 0.4, respectively, for persons aged 80 at baseline. The LDST change score was affected by a linear, as well as a quadratic, age-effect. The relationship between baseline age and the LDST change score is shown graphically in Figure 1. The final model for the

score showed that the age-related change in performance was dependent on gender. As shown in Figure 2, the age-related change in the SCWT Interference change score was much larger for males than for females.
2For the sake of clarity, Figure 2 presents the predicted raw SCWT Interference change scores instead of the

scores. Additionally, the order of the values on the Y-axis has been inverted, because lower SCWT Interference change scores indicate better performance whereas higher scores indicate poorer performance.
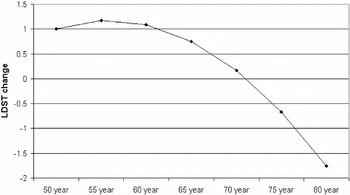
Predicted Letter Digit Substitution Test (LDST) change scores as a function of age at baseline.
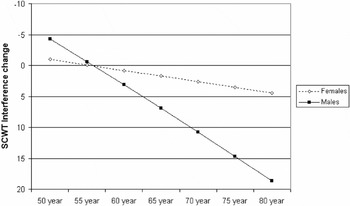
Predicted Stroop Color-Word Test (SCWT) Interference change scores as a function of age at baseline, for males and females.
As described earlier, the regression-based approach to assess change in an individual consists of three steps. For example, let us consider a 50-year-old person who obtained a Delayed recall change score of −3. Is a decline of 3 words in the VLT Delayed recall score significant for a 50-year-old person? First, the predicted VLT Delayed recall change score is calculated, which equals 1.463 (= 1.025 + [−.035 * −62.5]). Second, the standardized residual of the change score is calculated, which equals −1.890 (= [−3 − 1.463]/2.362). Third, it is concluded that significant deterioration had occurred because the standardized residual of the change score (−1.890) falls below the lower end of the 90% CI of the standardized predicted change score (i.e., below −1.645).
A User-Friendly Normative Table
Table 4 presents the 90% CIs for the raw SCWT Interference, VLT Total recall 1–3, VLT Total recall 1–5, VLT Delayed recall, and LDST change scores stratified by their relevant predictors (these 90% CIs were computed with the regression models shown in Table 3). The raw change scores that are presented in Table 4 are calculated as (sign) (Scoref − Scoreb), with (sign) equaling +1 for the LDST and VLT measures scores, and −1 for the SCWT measure. The use of Table 4 is straightforward. For example, let us consider a 60-year-old male who obtained change scores of −30, −2, −4, −2, and −10 for the SCWT Interference, VLT Total recall 1–3, VLT Total recall 1–5, VLT Delayed recall, and LDST measures, respectively. Significant deterioration had occurred for the SCWT Interference score because the observed change (i.e., −30) was below the lower end of the 90% CI presented in Table 4 (i.e., −29.3). The changes for the VLT Total recall 1–3, VLT Total recall 1–5, and the VLT Delayed recall scores were not significant because they were within the lower and upper ends of the 90% CIs. Significant deterioration also occurred for the LDST score because the observed change (i.e., −10) was below the lower end of the 90% CI (i.e., −4.9)
Normative table for the raw SCWT Interference, VLT Total recall 1–3, VLT Total recall 1–5, VLT Delayed recall, and LDST change scores. The lower and upper ends of the 90% CIs for the raw change scores are presented, stratified by their relevant predictors

DISCUSSION
In the present study, a new method was used to assess the significance of changes in the test scores of individuals over time, namely the regression-based change method. This method does not assume identical means and SDs of change scores for different subgroups (as does the RCI method,3
The RCI method can be seen as a special form of the regression-based change approach that is only valid when the change scores are not affected by any of the independent variables. Indeed, when a change score is not affected by any of the independent variables, the final regression model of the change score will only include the intercept B0 (i.e., predicted change score = B0); thus, an individual's predicted change score will be equal to the mean change score that is observed in the normative sample. Furthermore, the SD(residual) value will equal the observed SD of the change scores in the normative sample. Thus, both the RCI and the regression-based change methods yield the same 90% CI when the change score is not affected by any of the independent variables, or, in other words, when the assumption of equal means and SDs of change scores for different subgroups is fulfilled.
Level of education did not affect the changes in performance on any of the cognitive domains considered in the present study. This result conflicts with many other studies that have suggested that environmental factors such as educational level make individuals less vulnerable to age-related cognitive decline and pathological brain processes (the reserve hypothesis; see Stern et al., 2003). The absence of effects of education on the change measures in the present study may be related to the fact that quite stringent inclusion criteria were used (i.e., only cognitively intact people were included in the sample). It is also conceivable that the effects of education on longitudinal cognitive change are quite small and may only be detected when a test–retest interval of more than 3 years is used.
This brings us to some general remarks and limitations of the present study. First, the final regression models of the change scores explained only relatively small proportions of the variance in the change scores (i.e., all R2 values were below .08; see Table 3). Consequently, there is quite some inaccuracy in the prediction of the change scores (i.e., the SD[residual] values are large and the 90% CIs are broad). In practical terms, a considerable change in the test scores of an individual must occur before a clinician or researcher can conclude that significant change has taken place (see Table 4). Note also that the size of the R2 value of a final model provides an indication of the differences in results that would be obtained when the RCI method was used instead of the regression-based change method. When the R2 value of the final regression model of a change score is small (i.e., the predicted change scores are not strongly affected by the independent variables), the 90% CI that would be obtained with the RCI method will be very similar to the 90% CI that is obtained when the regression-based change method is used (see also footnote 3). However, when the R2 value of a final model is high, the results of both methods will differ substantially.
Second, it is difficult to attribute the age-related changes in performance to “true changes” in the underlying constructs that are measured by the neuropsychological tests. The observed change scores reflect the “net effect” of the positive effects of practice and the negative effects of a true age-related decline in the underlying cognitive abilities. It is not possible to distinguish the effects of “true change” from the effects of procedural learning in the present study, which is a common problem in most longitudinal studies that use repeated measurements of cognitive tests. This finding is, however, not relevant for the practical use of the change norms because a procedural learning effect may be expected to occur in practice just as well as in our reference sample.
Third, the drop-out percentage was approximately 20% in the present study. Nonrandom attrition can lead to biased parameter estimates of cognitive change. Logistic regression analyses of drop-out on age, age2, gender, level of education, and baseline test scores were thus conducted to evaluate the degree to which nonrandom attrition occurred in the present study. Older and lower educated people were found to drop-out more often than younger and better educated people (data not shown). However, effects of age and level of education on attrition do not bias the norms for change because these demographic variables were also included as covariates into the normative analyses (Little, 1995). The other predictors did not affect drop-out. However, a trend was established for the effect of baseline LDST score on drop-out (p = .007). Although the small effect of the baseline LDST score on drop-out may have affected our norms for change on the LDST, we contend that the bias that may have been caused by this factor is negligible given the small and nonsignificant (α = .005 due to multiple testing) effect of the baseline LDST score on drop-out.
Fourth, a test–retest interval of 3 years was used in the present study. Other studies reported that test–retest changes and reliability estimates vary as a function of the length of the test interval (Dikmen et al., 1999; McCaffrey et al., 1993). Thus, the norms that were established in the present study should only be used to evaluate change in performance when a test–retest interval of approximately 3 years was used. Further research is needed to determine whether these norms are also suitable to evaluate the change in people who were tested with a shorter or longer test interval. This requires a large sample of people who were retested with variable intervals: by adding the length of the test–retest interval as an extra predictor in the regression-models, the influence of the length of the interval on change can be determined and corrected for if necessary.
In summary, the present study evaluated changes in performance on the SCWT, VLT, and LDST after 3 years using a large sample of cognitively intact people aged between 49 and 81 years at baseline. Normative change data that allow the clinician to evaluate the significance of changes in performance on these tests were established by means of a new method, namely the regression-based change method.
ACKNOWLEDGMENTS
The research reported here was supported by the University of Maastricht and the PMS Vijverdal (The Netherlands). We thank all the participants for their cooperation and the test assistants for help with data collection.


