Introduction
Distribution of public resources has always been a central issue in public policy. In times of stringent saving requirements for all forms of public activities, resource allocation has recently become an even more important buzzword. The debate today takes place in a new economic and political climate. Ageing population, longer life expectancy, low birth-rates and high unemployment figures are among the reasons for a widening gap between conditions and available resources.
In most countries, the social, demographic, economic and political context vary across regions (e.g. Kühn, Reference Kühn2015; Pugh, Reference Pugh2003), creating heterogeneous local welfare systems, in which allocation of resources and provision of social services can differ substantially (Andreotti et al., Reference Andreotti, Mingione and Polizzi2012). Local conditions can differ a lot between sparsely populated areas in rural parts of a country – characterised, for example, by lower employment rates, larger share of elderly people and long distances to county centres or capital city – and more densely populated (urban) areas, often with a higher percentage of younger people and families with children.
People in urban areas generally have higher incomes, but this does not necessarily mean less deprivation and less difficulty in making ends meet, probably due to higher cost of living and greater inequality in cities (Eurofound, 2014). Furthermore, there are notable differences between capital and non-capital cities, with smaller cities generally lagging behind capitals.
Thus, local authorities in various parts of a country are obliged to react to very different local needs for social services, and to decide how and to whom local public resources should be distributed. Since resources are always limited, it inevitably means prioritising between different types of services under the responsibility of municipalities. The possibilities for local authorities, including local professionals such as social workers, to influence the allocation of resources depend, however, on the institutional design of social service schemes.
This directs attention to institutional structures and the procedure of resource allocation, particularly in decentralised welfare states (Kazepov, Reference Kazepov2010). Here, the state level provides a more or less general frame of regulation, whereas the responsibility for social service provision falls to the local level. Consequently, local discretion is more or less pronounced; strongest when services are not only organised but also financed at local level and weakest in cases with strict central regulation. The question of spatial variation in resource allocation, as a reflection of differing local conditions or territorial injustice, reflecting e.g. political priorities, professional ambitions or local culture, is particularly important in decentralised countries (Chaney, Reference Chaney2013) with a large number of subunits. In these cases, a considerable part of welfare services can be assumed to be distributed at the local level, and local variation is an obvious factor.
Whereas numerous studies of local welfare systems have observed local variation in provision of services, many of these researches have focused on single social policy areas (Mohan, Reference Mohan2003) and, in addition, often ignored diverse territorial conditions. This narrow focus disregards the fact that people can need several different services at once (elderly needing social care, transport, etc.), the competition for local resources between vulnerable groups, and the challenge for local authorities to distribute resources between various vulnerable groups, bridging several local social policy areas. This knowledge gap touches an essential question of how the landscape of local service provision looks in a more comprehensive perspective, and is crucial for the legitimacy of the (local) welfare state.
With this article, we are looking to fill this gap. We will analyse whether and how the distribution of a variety of social services and the structure of local social spending correspond to local conditions defined as socio-demographic conditions in varying territorial settings. We will do that by firstly identifying municipal clusters based on their socio-demographic conditions and, secondly, by analysing service provision and social spending on vulnerable groups in these clusters with rank transformation. The second step also includes the territorial dimension. This broad approach should help us understand the distribution of resources in various local conditions and across social policy areas.
To this end, we will do a cross-sectional analysis of local social services that are financed and administrated at a local level. Empirically, we will examine the case of Estonia – a small, sparsely populated Eastern European country characterised by strong decentralisation combined with central control, and divided into a large number of municipalities (226 in 2013). These circumstances make distribution of decentralised resources crucial and, as has been shown in previous studies, size and fragmentation of spatial units are particularly relevant factors for variation in service provision (e.g. Craw, Reference Craw2010). Register data from Statistics Estonia (particularly the 2011 Census) and from the Ministry of Finance (2006-2013) will be used, along with an online survey about local service provision in 225 out of 226 municipalities in 2013.
In studies on spatial distribution, the territorial justice often serves as an overall theoretical approach (Boyne and Powell, Reference Boyne and Powell1991). We will focus on one dimension of territorial justice, namely the status-related equality principle (socio-demographic context), and combine that with a territorial lens (the urban-rural or core-periphery distinction). We need to stress, however, that we are not concerned with the underlying rationality or sufficiency of distribution nor with the explanation of variation in distribution, but with the structural outcome of this for the local population in diverse spatial settings.
We start the article with a brief overview of earlier research about variations in local welfare contexts, followed by an outline of the theoretical frame and the Estonian (local) welfare system. Then there follows the empirical study and, in the last part, a discussion of the findings.
Variation in local service provision
Large geographical differences in terms of economic and social development have been emphasised by studies on the situation of people living in diverse territorial areas, such as urban or rural areas (Eurofound, 2014; European Commission, 2008; Brown and Keast, Reference Brown and Keast2005). In this field of studies, territorial disparities have been stressed in the supply of social services, between regions, or between urban and rural areas (Martinelli, Reference Martinelli, Martinelli, Anttonen and Mätzke2017a). Local population in peripheral areas is often dominated by elderly people and people with disabilities, as well as low-skilled workers(Kühn, Reference Kühn2015), resulting in a rather different situation with respect to distribution of services than in core areas that often have a higher concentration of skilled working-age population (Wellhofer, Reference Wellhofer1989). Martinelli (Reference Martinelli, Martinelli, Anttonen and Mätzke2017b: 398) calls the growing problem of territorial disparities ‘a mismatch between (growing) demands – social needs – and a (shrinking) supply of public social services, which is eroding the principle of universal social rights and restoring social stratification and territorial differentiation’. The municipalities facing the greatest constraints in providing social services are the ones that are not just impoverished but often relatively small and/or located in highly fragmented or remote areas (Craw, Reference Craw2010; Brown and Keast, Reference Brown and Keast2005). Another group of studies has focused on variation in the distribution of local social services. These studies have, however, mainly concentrated on single social policy areas or target groups, such as elderly care (Fernandez and Forder, Reference Fernandez and Forder2015), care/services for people with disabilities (Lewin et al., Reference Lewin, Westin and Lewin2008), social assistance (Minas, Reference Minas2005), and welfare-to-work services (Nativel et al., Reference Nativel, Sunley and Martin2002), etc. They offer various explanations for the observed variation, ranging from organisational aspects to the prioritising of certain vulnerable groups. Often children and families with children are prioritised (Bergmark, Reference Bergmark1996; Grønningsæter and Kiik, Reference Grønningsæter and Kiik2009; Wörlen, Reference Wörlen2012); a pattern that also applies to social workers working in elderly care who prioritise the support of children and families with children (Wörlen and Bergmark, Reference Wörlen and Bergmark2012), or younger people with disabilities (Gautun and Grødem, Reference Gautun and Grødem2015). Spending patterns mirroring priorities in local services directed at elderly (social care) and children (education or child care) have shown varying results (see for example Borge and Rattsø, Reference Borge and Rattsø2008; Fletcher and Kenny, Reference Fletcher and Kenny2008). What is missing is studies that capture the distribution of a range of social services for various target groups, and thus investigate the linkage between distribution of local services, socio-demographic conditions and territorial conditions.
Territorial justice
The concept of territorial justice has a long history in studies on spatial distribution of welfare state services, particularly in the UK (Kay, Reference Kay2005). The term coined by Davies (Reference Davies1968) retains support as a normative value and as a principle to guide policy (Morgan, Reference Morgan2001). It upholds the principle that access to public services ought to be equalised across a territorial entity, and is usually interpreted in terms of need and equal treatment or so-called horizontal equity (Powell and Boyne, Reference Powell and Boyne2001). From the point of view of an individual, it means that one should receive equal access to treatment for equal needs regardless of residence, according to the principle of equal social rights across a territory (Kay, Reference Kay2005; Chaney, Reference Chaney2013). In theory, it also implies that a country following this principle should not have territorial sub-divisions that are subject to a different set of social rights.
Distribution can be discussed in terms of principles, general concepts and systems. One distinction can be made between local and global justice systems where the former is designed by relatively autonomous local institutions that have some autonomy in creating and implementing their preferred schemes. Local justice systems are complex; not only because goods are scarce and demands are heterogeneous but also because local justice systems involve complex (and not always consistent) criteria, mechanisms, procedures and schemes for allocation (Roe, Reference Roe1998; Elster, Reference Elster1992). Elster (Reference Elster1992) identified some distributional principles tied to local justice systems, such as egalitarian principles, time-related principles or status-related principles. We concentrate on the last: the status-related principles that are closely related to socio-demographic conditions and defined by e.g. age, family status, or health (Österle, Reference Österle2002).
While socio-demographic conditions are a crucial determinant for distribution of local resources, they are accompanied by and tightly interlinked with territorial structure. Differences in demographic and spatial composition are sometimes defined on an urban vs rural (Pugh, Reference Pugh2003)or core vs periphery continuum (Kühn, Reference Kühn2015). The urban-rural division is an administrative dimension, emphasising population density, whereas the core-periphery division is concerned with demographic and economic conditions, and distance from a (county) centre. By using both urban-rural and core-periphery dimensions, we could place even the most remote rural areas into a wider context of interdependency. Literature tells us that core areas (often with higher revenues) have better means to provide a larger variety of services and to react to local conditions than peripheral municipalities (often with fewer resources, less favourable local conditions and higher service costs due to longer distances). It is clear that territorial justice does not mean allocation of equal resources over all territorial entities, but rather provision of necessary means so that various needs can be met in various locations.
We are aware that these aspects only capture a limited part of the picture by excluding other dimensions like local political conditions, the role of professionals, self-interest or competition (Bergmark, Reference Bergmark1996). They do, however, let us concentrate on territorial justice as a reaction to local conditions.
Structure of local social services in Estonia in socio-demographic perspective
In this part, we briefly present main features of the Estonian (local) welfare state. After the collapse of the Soviet Union, major changes have taken place in the Estonian social security system and in social policy in general (Aidukaite, Reference Aidukaite2004). Over the years, most of the social protection schemes were reformed or introduced by combining path dependency, influence and the know-how of international organisations and neighbouring western welfare states (Aidukaite, Reference Aidukaite, Cerami and Vanhuysse2009). The Estonian welfare state is still in transition but is often described as including continental social insurance schemes, liberal tax policy (Toots and Bachmann, Reference Toots and Bachmann2010), and a social welfare services structure that is largely based on the Scandinavian model (Trumm and Ainsaar, Reference Trumm, Ainsaar, Schubert, Hegelich and Bazant2009).
At the local level, municipalities are responsible for a large array of tasks including education, social welfare, social assistance and housing. Local responsibilities are defined by the Constitution, the Local Government Organisation Act and the Social Welfare Act for local social protection matters. Central-local relationship is, however, complicated because there is no clear division of function between the central and local level, and local public services often lack clear definitions, financing schemes and minimum standards (Merusk and Olle, Reference Merusk and Olle2009) – a situation that is also true for social welfare. Since Estonian municipalities are territorially relatively large and internally quite decentralised, they have extensive autonomy (Sootla and Kattai, Reference Sootla, Kattai, Loughlin, Lidström and Hendriks2011). Until 2016, the legal regulation of decentralised social service provision was rather unclear, lacking central definitions and standards. The municipalities, however, were expected to provide and finance a number of services mentioned in the Social Welfare Act and/or described in the recommended guidelines of the Ministry of Social Affairs (Table 1). With the new Social Welfare Act (2016), the regulation of local social services has improved and includes some national definitions and standards. Local autonomy, however, remains restricted because of the municipalities’ dependency on central government transfers and their minimal rights in raising taxes (Swianiewicz, Reference Swianiewicz2014), i.e. they have limited fiscal autonomy. Furthermore, the municipalities should be able to fulfil their public services obligations from income tax, earmarked fund and block grants, but according to the Ministry of Finance (own calculations) more than 80 per cent are partially depending on finances from the equalisation fund. Nevertheless, local governments are obliged to finance the provision of most social services for the elderly, people with disabilities and families with children. Municipalities, therefore, have a considerable decision-making autonomy regarding administration and regulation but only limited power over financial resources (Ladner et al., Reference Ladner, Keuffer and Baldersheim2016; Swianiewicz, Reference Swianiewicz2014). Consequently, many of the (smaller) municipalities are not able to provide all local social services and some only provide the very basic ones (Riigikontroll, 2012).
TABLE 1. The structure of the social services system (financing and regulation) based on socio-demographic groups in Estonia (until 2016)

Social services financed from the state budget (e.g. special care, residential care for children) are based on detailed government regulations and guidelines. Here, the local authorities’ discretion in the distribution of these services is very limited and spatial variations based on local decisions are minimal. Therefore, this study focuses only on local social services that are financed and regulated by municipalities, i.e. where the allocation of resources depends primarily on local authorities’ decisions (Table 1). The municipal budget is divided between ten sectors (education, social protection, etc.) with the highest share of municipal annual expenditure going to education (over 40 per cent on average)Footnote 1. Since health care is predominantly a state responsibility, municipal spending is low (around 1 per cent). On average, 7 to 8 per cent of the municipal budget is spent on social protection; this can, however, range from less than 3 per cent to 20 per cent. Municipalities spend circa 35 per cent of social expenditure on elderly people, circa 20 per cent on children and families with children, and circa 14 per cent on people with disabilities. Social assistance, in terms of subsistence benefit, is financed by earmarked funding from the state budget (approx. 15 per cent from local social spending).
The composition of social expenditure can differ considerably between municipalities. This is also true for the number of inhabitants (from less than 100 up to approximately 400,000), density and local socio-demographic composition. It is also worth emphasising that Estonia is a rapidly ageing society (Ainsaar and Rootalu, Reference Ainsaar, Rootalu, Schubert, de Villota and Kuhlmann2016), with an increasing share of people with disabilities. Based on data from Statistics Estonia and the author's own calculations, the share of persons over 65 years of age has grown between 2000 and 2016 from 14.9 per cent to 21.4 per cent, the share of children has in turn decreased from 22.3 per cent to 18.8 per cent, and the share of people with disabilities has increased from 7.1 per cent to 11.1 per cent.
Data and methods
The empirical study focuses on three target groups: children and families with children; people with disabilities; and elderly. These three groups amount to circa 70 per cent of the local social spending. If we disregard expenditure on social assistance (earmarked funding from state budget), this share increases to approximately 80 per cent. The empirical data comes from three sources. Municipal socio-demographic data comes from the 2011 Census collected by Statistics Estonia; municipal fiscal data is collected annually by the Ministry of Finance of Estonia; and the data of social services provision is derived from an online survey conducted in 2013. The financial data (spending) in this study covers two four-year local election periods from 2006 to 2013. In the analyses, we have used the average annual municipal expenditures during the period 2006–2013 to reduce the influence of one-time investments from the EU or from the state on local budget. In order to capture the structure of local authorities’ decisions regarding the local (social) budget, we excluded earmarked funding from state budget in the social protection sector (social assistance).
Data for the online survey was collected from 225 of 226 municipalities. The survey was addressed to the heads of social work departments or to leading social workers, and included, among other aspects, questions about local social services provided during the period 2010–2013. Social workers were also asked about the additional demand for provided (or currently not provided) social services, i.e. they assessed, relying on their professional judgement, whether the provision of each service was sufficient or not. The survey was based on the 18 social services that were defined as a municipal responsibility by the Social Welfare Act and/or by the recommended guidelines for minimum standards for local social services, and whose provision is financed, regulated and administrated locally.
The assumption behind addressing social workers was that they, as professionals, have a deeper knowledge about local needs and the situation of vulnerable groups. Previous studies (e.g. Grønningsæter and Kiik, Reference Grønningsæter and Kiik2009) have indicated that Estonian social workers are critical about social service provision in municipalities. Rough comparisons of the results of the survey with available official data regarding social service provision (collected from the municipalities by the Ministry of Social Affairs) indicate that the results of the survey do not diverge from official administrative data by more than about 10 per cent. Therefore, these results and comparison may indicate that social workers scarcely underestimate or overestimate the local social service provision or the additional demand (Kriisk and Minas, Reference Kriisk and Minas2017).
The 18 social services are categorised into four groups and include services for:
• Children and families with children (family mediation, social centres for children, childcare services, shelter services for children, personal support for children and personal support for adults including for families with children);
• People with disabilities (personal support for children, personal support for adults including for people with disabilities, social centres for people with disabilities, personal assistance service, adaption of dwelling, social transport);
• Elderly (adaption of dwelling, social transport, social centres for elderly, home care services, institutionalised general elderly (nursing) home service);
• Other services (social housing, social counselling, debt counselling, shelter services for victims of violence, shelter services for homeless) (see Table 1).
For certain local social services, there are two main target groups (e.g. for the social transport, the target groups are both people with disabilities and elderly people). Accordingly, these services are placed in both groups. As regards ‘Other services’, the eligibility does not depend on any specific socio-demographic group (e.g. social counselling), or they are targeted at those in the working-age population with specific needs (e.g. shelter services for homeless).
The empirical study was carried out in two stages. First, a cluster analysis with a variance analysis of the selected socio-demographic characteristics was performed, and then service distribution and social spending were analysed in these clusters with rank transformation.
To analyse the structural conditions, we used k-means cluster analysis with demographic data from the 2011 Census. The six variables, which cover most of the vulnerable groups in Estonian local social policy, were:
• Share of families with children in all households in municipality;
• Share of single-parent households in all families with children in municipality;
• Share of single elderly people in all elderly in municipality;
• Share of working-age population (16-64) with self-reportedFootnote 2 long-term illness in all working-age population in municipality;
• Share of children (0-16) with self-reported illness in all children in municipality;
• Share of elderly people over 85 years of age in municipality.
Since the above-mentioned variables have different scales, we used standardised values in the cluster analysis to avoid the domination of single variable values in clusters calculation. Additional variables were included to capture the differences in local context. These were: a) municipal and spatial characteristics (including the administrative urban-rural divisionFootnote 3); b) assessment of social service distribution and additional demand by social workers; and c) financing (general and social spending). The dimension of spending may involve different things, such as level of ambition, but also ineffective management. The analysis of variances was used to evaluate the statistical significance of variance between clusters (f-test, Table 2). Seven clearly distinguishable clusters were identified. However, cluster 6 includes only four and cluster 7 only one municipality with a unique socio-demographic composition.
TABLE 2. Socio-demographic context, spatial and financial characteristics, service provision in clusters and variations between the clusters

In the second part of the study, we analysed the clusters regarding local service provision and disaggregated social expenditure. Since the range of provided services and spending variables differ, the actual values were replaced with ranks. The use of rank transformation allowed us to compare the structure of service provision to different target groups and resources spend thereon, as well as municipal clusters on the same scale, regardless of their actual values and varying needs of target groups. After these rank transformations, assumptions concerning lower and higher observation values remain the same for lower and higher ranks (Conover, Reference Conover2012). Here, the reverse rank transformation is used, i.e. the highest observation value is coded with lowest rank and lowest observation value is coded with highest rank. If tied observation values occurred, then average ranks were assigned to them (Conover, Reference Conover2012). We calculated and arranged the average ranks of municipalities according to distribution of services and spending in each cluster.
Results of the cluster analysis
This part starts with the presentation of the cluster analysis. We present the clusters and their socio-demographic composition as well as the local context and visualise their geographical division throughout Estonia (Table 2 and Figure 1).

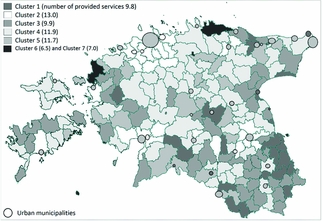
Figure 1. The territorial map of Estonia with socio-demographic clusters.
The cluster analysis identified seven clusters. Six of these include at least one dominating fragile group (e.g. elderly in cluster 3 or families with children in cluster 2). The variables describing local context highlight additional variations, for example distances to county centre or to the capital city that vary between 15 and 75 km (clusters 2 and 7), or between 90 and 260 km (clusters 2 and 7) respectively. On average, 11.2 social services are provided at the municipal level ranging from 6.5 services in cluster 6, to 13 services in cluster 2. Different target groups also experience considerable variations in service provision. Additional service provision is demanded on average for 7.3 services ranging from 4.5 in cluster 6, to 8.3 in cluster 2. It is relevant, however, to point out that the variations in demands for additional services for certain target groups are not statistically significant. The clusters will be described in more detail below. As regards to the size of the cluster, four have a relatively similar size, one is considerably larger and two are very small.
The clusters
Cluster 1 includes 26 peripheral, primarily rural, municipalities and in addition some small towns from the southern part of Estonia. These are furthest away from the capital city and from county centres. Municipalities in this cluster have the highest share of people with disabilities and a very large share of elderly people compared to the rest of the Estonian municipalities. At the same time, the municipalities have a small share of children and families with children, and an average share of single parents and single elderly households. The municipalities have on average less than 1500 inhabitants but, in the context of Estonian rural municipalities, their population density is relatively high. We call this cluster Peripheral multi-problem municipalities. Cluster 2 includes 31 municipalities and their main characteristic is that they are mostly located in rural areas with a relatively high number of inhabitants and a high population density. They are surrounding large Estonian towns – the capital city Tallinn, but also other large towns (Tartu, Pärnu, etc.). Consequently, these municipalities have on average the smallest distance to county centres and/or to the capital city. From a socio-demographic perspective, they have a very large share of children and families with children, but the share of single-parent households is the smallest among the clusters. Additionally, municipalities in this cluster have a very low ratio of people with disabilities and elderly people compared to the rest of Estonia. This cluster will be labelled Municipalities surrounding centres, with large share of families with children. Cluster 3 includes 44 rural peripheral municipalities. Similarly to cluster 1, it includes municipalities with few inhabitants, but they are extremely sparsely populated – on average less than 10 inhabitants per square kilometre. Furthermore, municipalities belonging to this cluster are located quite far from county centres and from the capital. In these municipalities, the share of elderly people is very large and the share of people with disabilities is relatively high. In addition, the share of working-age people with self-reported illness is slightly above the average, and the share of children with self-reported illness is considerably below the Estonian average. Remarkably, even with an extremely large share of elderly people, the share of single elderly is below the average level. This cluster is labelled Small rural municipalities with large share of elderly. The largest number of municipalities belong to cluster 4 (31.4 per cent, i.e. 71 municipalities). From a spatial aspect, these municipalities create a second circle around large towns and are territorially situated between the so-called core municipalities (cluster 2) and the periphery (clusters 1 and 3). The cluster includes primarily rural municipalities, as well as a few towns. All socio-demographic characteristics are just about average: the share of children and families with children are slightly above average and other characteristics slightly below. Accordingly, this cluster is labelled ‘Average’ municipalities. Cluster 5 contains 49 municipalities, including most of the Estonian urban municipalities (22 towns, i.e. two thirds of Estonian towns). Consequently, the municipalities in this cluster have, on average, the largest number of inhabitants and the highest density compared to municipalities in other clusters. This cluster also includes almost all core urban municipalities, i.e. large towns and 14 out of 15 county centre municipalities. The municipalities in this cluster have a slightly above average share of elderly, slightly below average share of children and few people with disabilities. Nevertheless, the municipalities in cluster 5 have a very high share of single-parent households and single elderly people. We call this cluster Towns and municipalities with single elderly and single parents. Different stages in the cluster analysis constantly pointed out that five municipalities do not belong to the previously described clusters and remain separate. Four of them create their own cluster (cluster 6), whereas one municipality is a cluster by itself (cluster 7). This municipality is a small and remote island municipality with a unique socio-demographic composition – it does not have a single child and around half of the inhabitants are elderly. The other four municipalities include three municipalities with a very small number of inhabitants, including another remote island municipality. Although cluster 6 only includes four municipalities, we can say that their share of children and people with disabilities is very low compared to other clusters. Both of these clusters are labelled Unique cases.
To visualise the distribution of the seven clusters, Figure 1 shows their division on the Estonian map, but also the average number of provided services (the darker the colour, the fewer services on average are provided). Figure 1 also illustrates the relevance of distance from large towns for social service provision, i.e. municipalities belonging to the same clusters are building two or three circles around large towns.
Vulnerable groups and distribution of resources
In the following part, we continue our analysis by directing attention at resource distribution and its correspondence to local context in the clusters. The results are presented in Tables 2 and 3. Table 2 presents the distribution of services, demand for additional services and spending patterns. The ranking of service provision and eventual additional demand can be found in Table 3; this is followed by a ranking of social spending regarding main target groups.
TABLE 3. The structure of resource distribution based on average ranks of municipalities in clusters

* - Cluster 4 originally included the municipality with missing data concerning social service provision
Starting with cluster 1 (Peripheral multi-problem municipalities), one would expect high social spending, as well as a large number of, and demand for, social services targeted specifically at people with disabilities and elderly people. However, the municipalities in this cluster provide less than 10 social services (9.8) and have an additional demand for only seven more. Nevertheless, the municipalities in this cluster have the highest local social spending. The structure of service provision seems to contradict the socio-demographic conditions (a very large share of people with disabilities and a relatively large share of elderly people). On average, most resources and services are distributed to families with children. Furthermore, additional demand for services targeted at people with disabilities comes after additional services for elderly people and other services (3rd rank). Despite this picture, the share of spending on people with disabilities is the largest compared to spending on other vulnerable groups. The spending per person with disabilities, however, ranks at third place.
The picture looks different for cluster 2, Municipalities surrounding centres, with large share of families with children. Service provision pattern and the shares of disaggregated spending correspond to local needs, i.e. service provision is predominately directed at families with children, which is the dominating group in this cluster. A large share of spending concerns families with children. Municipalities in this cluster provide the highest average number of social services (13 services), regardless of low (social) spending. Furthermore, the additional demand for service provision is the highest among clusters. These municipalities provide a wider range of services for each target group than the municipalities in other clusters.
As for cluster 3, Small rural municipalities with large share of elderly, one would expect a high spending on social protection targeted at elderly people, as well as a high concentration of services for elderly people and for people with disabilities. On average, municipalities in this cluster provide less than 10 services, and the demand for additional services is very low (less than 6). Although the revenues from income tax are the lowest among all clusters, the general and social spending are some of the highest. In contrast to other clusters, municipalities here distribute resources mainly to one vulnerable group, namely the elderly, which corresponds to the socio-demographic structure. As expected, the share of social spending on elderly people has the highest rank and, in addition, the elderly rank highest regarding spending per capita. The last pattern may be a conflict with respect to the economy of scale. Corresponding to the socio-demographic structure in the cluster, fewer services are distributed to and fewer (local budget) resources are spent on families with children.
Coming to cluster 4, the ‘Average’ municipalities provide on average 11.9 social services (the national average being 11.2), and there is additional demand for 7.8 services (7.3 for all municipalities). The share of social spending is slightly below average. It is difficult to point out any vulnerable group receiving more services or resources in form of spending than another (according to service provision, people with disabilities are ranked the highest; according to services with additional demand, elderly people are at the top; and according to social spending, families with children are the most highly prioritised). This, however, corresponds to the socio-demographic structure of the municipalities, meaning that no predominant fragile group emerged in this cluster.
In cluster 5, Towns and municipalities with single elderly and single parents, the number of provided services (11.7) and additionally demanded services (7.6) are on a par with the average for all municipalities. Based on the socio-demographic structure, we would expect a high spending particularly on single elderly people but also on single parents. However, since these are not separate categories regarding distributed services and disaggregated spending, we do not know what the actual resource distribution to these groups looks like. As in cluster 4, it is difficult to point out one dominating fragile group receiving more services and/or resources than another. Regarding service provision, the elderly received the most, and families with children are identified as a group where more additional services are needed. The share of social spending in the budget is slightly below average, and the priority is people with disabilities. Thus, based on the categorisation of the three main vulnerable groups, there is no dominating target group, and no dominating group receiving services and resources in this cluster.
In one of the Unique cases, cluster 6, the disaggregated spending is concentrated on families with children regardless of their small share. The lowest share of spending goes to the elderly, a slightly predominant socio-demographic group within the four municipalities. The municipality in cluster 7 (the other unique case) clearly focuses on people with disabilities, despite having an extremely large share of elderly people. The five municipalities (clusters 6 and 7) show high general spending but, at the same time, a very low share of social spending in their budget. In addition, the number of provided services and the additional demand are both low.
Summarising the results of the analysis, we can state that, despite the relatively small population of the country, the socio-demographic structure of Estonian municipalities varies considerably and displays some clear patterns concerning spatial characteristics. The first analysis gave us the possibility of identifying seven clearly distinguished municipal clusters. One of the main differences between the clusters is that municipalities dominated by families with children can be found close to large towns and county centres. Municipalities dominated by the elderly and/or people with disabilities are located further away in the countryside. This is visualised on the Estonian map (Figure 1), where two or three concentric circles of different clusters surround large towns. All selected characteristics describing the local context in clusters show significant variations between the clusters. An exception is services with additional demand in some target groups, indicating that additional demand does not always depend on local context.
We can see that, in general, service distribution and disaggregated spending patterns correspond to the local socio-demographic structures. For two clusters (4 and 5), this implies that no dominating socio-demographic group(s) can be identified and, correspondingly, no clear pattern in resource allocation exists. Significant exceptions, however, emerged in three clusters, even though they include less than 14 per cent of all municipalities. In cluster 1, we found a large share of people with disabilities and elderly people, but the service provision focuses mainly on families with children. In clusters 6 and 7, the provision of services and the allocation of resources also contradicts the local socio-demographic structure.
Conclusions
This paper proposed to analyse whether and how local socio-demographic structures correspond to the provision of local social services and disaggregated social spending. This embeds the study within the broader frame of territorial justice and distribution of resources at local level in response to varying local conditions (Davies, Reference Davies1968). Territorial justice is particularly important in welfare states characterised by a far-reaching decentralisation combined with a fragmentation of spatial units and unclearly defined central-local relationship in (welfare) governance. In this type of welfare state, local authorities have considerable discretion and a large responsibility in terms of meeting the needs of vulnerable groups and, ultimately, ensuring legitimacy of the (local) welfare state.
The main findings of this study using Estonia as a case are: i) resource allocation in Estonian municipalities mirrors quite well local socio-demographic structures; and ii) on a more general level, the administrative division of municipalities between towns and rural municipalities used in the common discourse of local social policy might be too simplified.
Regarding the allocation of resources, three patterns emerge: first, correspondence between local conditions and resource distribution (clusters 2 and 3); second, unclear profile of local conditions and distribution (clusters 4 and 5); and third, a deviating distribution pattern. The deviating distribution pattern appears only in cluster 1 and in unique cases.
In terms of status-related distributional principles, our findings correspond to earlier research. Families with children are a target group who receive more frequent services even in cases with other, more dominating, vulnerable groups. Yet, using the status-related approach extended to a larger set of social services enables us to reveal patterns of local service distribution that cannot be seen in studies focusing on one target group. It should be emphasised that the general correspondence between local socio-demographic structure and resource allocation in Estonian municipalities does not mean that municipalities provide necessary and sufficient support and services. Many municipalities are still providing only a few basic services (Riigikontroll, 2012).
The found distribution patterns are closely linked to spatial conditions. It has often been stated that rural areas are disadvantaged, less capable of meeting varying needs and have fewer resources than urban areas. The present study shows that this narrative needs to be revised. There is both a spatial and social polarisation between core and peripheral areas, but the administrative categorisation does not adequately describe the core-periphery dichotomy. The core areas comprise not only large towns and county centres, but also rural municipalities surrounding large towns. Therefore, rural municipalities in turn are not per se peripheral areas. In the Estonian case, the study showed that there are actually four types of rural municipalities: first, rural municipalities surrounding large towns (core areas); second, ‘average’ municipalities; third and fourth, peripheral municipalities, in one case representing a multi-problem area and in another case an area with significantly aged population. We further note that peripheral municipalities have more resources available per capita and spend considerably more on local social policy compared to core municipalities. Interestingly, however, the variety of provided services and the additional need for various services is considerably smaller here, even though the population in peripheral areas is more fragile compared to the population in core areas.
This study dealt with Estonia, and one may ask what we can learn from it on a more general level. In several countries, structural reforms, e.g. in the form of mergers of municipalities have been introduced or are being planned (Kuhlmann and Bouckaert, Reference Kuhlmann and Bouckaert2016). The arguments are that the amalgamation of (small) municipalities would improve the quality and access to local services. Yet, discussions regarding territorial-administrative reforms often solely focus on population size, which clearly does not adequately cover the core-periphery dichotomy (Kriisk and Minas, Reference Kriisk and Minas2017) and will not automatically ensure a more adequate distribution of services and resources. Even if the specific structure of the core-periphery dimension may differ between countries, this shows an inconsistency within the idea of territorial justice.
Finally, comparative local welfare studies are rare and concentrate mainly on a single social policy area. The use of cluster analysis, rank transformation and disaggregated social spending appears to be an adequate method to compare variation of a broader range of services in local welfare settings. Yet, the study focused only on certain factors describing the local context of social service provision (demographic and territorial structure), and ignored others that might be important, e.g. the impact of political factors or eligibility criteria. Nevertheless, the study highlights the relevance of analysing and studying the local variations in the distribution of a range of services targeted at various vulnerable groups. It shows the necessity of carefully observing local conditions in peripheral areas that have the largest risk of failing to provide services for the most disadvantaged groups, such as people with disabilities and elderly people. This should be of utmost importance in future discussions about the distribution of resources to social policy.
Acknowledgments
The author wishes to thank Merle Piho who, as a social work doctoral student at Tallinn University, significantly contributed to data collection from social workers of local municipalities by means of a questionnaire.