


Introduction
Lung cancer is one of the most diagnosed cancers among the Dutch population. In 2020, 13,910 new patients with lung cancer were reported. 1 Currently, the treatment of more than 50% of these patients involves radiation therapy. This primarily curative treatment can be combined with other forms of treatment such as surgery and chemotherapy. Reference Kinsella, Sohn, Wessels and Chang2 The benefits of radiation therapy are a reduced likelihood of recurrence and a better chance of survival. Reference Feng, Wang and Wang3–Reference Whelan, Julian, Wright, Jadad and Levine6
However, radiation therapy also has risks and disadvantages. Radiation-induced normal tissue toxicity may cause various complications, including pneumonitis and heart diseases such as pericarditis and ischemic heart disease. Reference Cheng, Nie and Ji7 In addition, during radiation therapy of lung cancer, the risk of missing the tumour is higher owing to internal anatomical changes during respiratory motion. Reference Kini, Vedam, Keall, Patil, Chen and Mohan8,Reference Goitein9 According to Giraud et al., the mean tumour displacement between inspiration and expiration is 34·25 ± 20·4 mm in the craniocaudal direction. Reference Giraud, De Rycke and Dubrat10 Therefore, lung carcinomas are irradiated with large treatment margins added to the clinical target volume to ensure that the target volume is covered during the entire range of motion of the tumour. Reference Kini, Vedam, Keall, Patil, Chen and Mohan8 However, this modification amplifies the risk of normal tissue toxicity.
For reducing the treatment margins and preventing missing the target, the tumour position needs to be monitored to ensure that the radiation is delivered only when the tumour is in the targeted area. Reference Goitein9 Tracking with the help of gold markers is an accurate method to monitor the tumour position. A gold marker is placed in the tumour; thus, the motion of the tumour is directly associated with the motion of the marker. Reference Seppenwoolde, Shirato and Kitamura11,Reference Shirato, Shimizu and Kunieda12 However, most tumours treated with radiation therapy are small, which makes placement of gold markers difficult. Moreover, the placement is invasive and poses a substantial risk of pneumothorax. Reference Kothary, Heit and Louie13–Reference Patel, Khalsa, Lord, Sandrasegaran and Lall15
Respiratory tracking with the use of surface markers is considered more suitable. This method monitors the movement of the sternum using surface markers; it is assumed that the tumour moves according to the sternum movement. Reference Goitein9 Respiratory tracking in irradiation of lung tumours can be used with different approaches: it can be applied to gated therapy, in which the dose is delivered only in some phases of the respiratory cycle Reference Underberg, Lagerwaard, Slotma, Cuijpers and Senan16 ; or it can be applied to control dose delivery throughout the respiratory cycle. The present study focuses on the control of dose delivery during the whole respiratory cycle.
The aim of monitoring respiratory movements is to ensure an adequate treatment margin to consequently reduce the risk of normal tissue toxicity. Reference Underberg, Lagerwaard, Slotma, Cuijpers and Senan16 However, there are still unknown factors in this method. For example, the whole treatment plan is based on the planning computed tomography (CT) scan, and it is not known whether breathing patterns are similar in the treatment phase. Moreover, this method assumes that the tumour is within the irradiated area only when the sternum is within the respiratory boundaries and that the tumour is outside the irradiated area when the sternum exceeds the respiratory boundaries. If this holds, the possibility of predicting whether a patient will exhibit abnormal breathing patterns is relevant. Another question is whether the boundaries of respiratory gating can be reduced to reduce normal tissue toxicity.
The present study aims to investigate whether the planning scan of patients with lung cancer is representative during the radiotherapy fractions. To investigate this aim, the following research questions were addressed: (1) Is there a difference in respiratory signals between the fractions and the planning scans of patients with lung cancer? (2) Can it be predicted whether breathing patterns will differ between the planning CT and the treatment?
Methods
Study population
Data for this prospective study were collected from patients who were treated in the radiotherapy department of the Medisch Spectrum Twente (MST) in Enschede, the Netherlands. All patients with lung carcinoma who received 30 x 2 Gy in the first fraction between 1 October 2018 and 1 October 2019 were included, resulting in a dataset of 29 patients with a completed treatment plan.
Clinical scan protocol
The device used for respiratory gating was the Respiratory Gating for Scanners (RGSC) system (Varian Medical Systems, Palo Alto, CA, USA). Using an infrared camera, the reflective markers placed on the patient’s sternum are tracked in three dimensions: antero-posterior (AP), head-foot (HF; cranial-caudal) and left-right (LR; lateral). These external motions are linked with the image data, which enables respiratory gating. Figure 1a shows the reflective marker. The camera of the system is mounted on the ceiling, at a distance of 2·5–5·6 m from the reflector block. Figure 1b shows a schematic representation of the patient set-up. Reference Schick, Gottschlag, Fielitz, Budach and Simiantonakis17,Reference Siow and Lim18

Figure 1. Left, the reflective marker that is placed on the patient. Right, a schematic representation of a gating system. The reflective marker (reflector block in the scheme) is placed on the patient. The reflector block reflects the light from the infrared (IR) camera on the ceiling.Reference Shirato, Shimizu and Kunieda12.
For irradiation of lung tumours, the marker block is placed at the centre of the patient’s body between the umbilicus and the xiphoid process. For the planning, a four-dimensional CT scan is performed resulting in images during every breathing phase. Reference Goitein9 By marking the tumour in each image, the region within which the tumour moves during respiration can be identified. During the whole process, the patient breathes freely. No feedback is provided on breathing during treatment. During the planning scan, respiratory signals are monitored and boundaries are set, containing the whole range of respiratory motion. When the sternum is within the boundaries during the treatment, the radiation beam is on, but when the boundaries are exceeded, a closing grid turns the radiation beam off immediately. This can occur when the patient coughs or has a breathing pattern different from that in the planning scan.
Data analysis
Data acquisition
All patient data were stored automatically in the ARIA system of the MST, developed by Varian. These data were anonymised and imported from the database into MATLAB2018b.
Data preprocessing
The respiratory data were smoothened with a Savitzky–Golay filter (order 2, window length 200) to remove the smaller peaks in the data that did not represent inspiration or expiration.
Data analysis
The amplitude and frequency of the respiratory movements in various fractions were analysed. For both the amplitude as the frequency, the following measures were calculated: the variance from the planning scan in the fractions, the variance from the mean in the fractions and the mean variance during the fractions. These three measures were chosen to determine whether the respiratory signals in the planning scan represented those in treatment fractions and to determine whether the patients’ respiratory signals were consistent between and within fractions. The three different calculations for amplitude and frequency are described below.
The amplitude was calculated by identifying the peaks in the signal using the function findpeaks. The amplitude of each respiratory cycle was averaged to obtain a mean amplitude for each fraction. The deviation from the mean value in the planning scan was estimated by calculating the variance using the formula ${{\sum {{{\left( {a - b} \right)}^2}} } \over N}$
, where a is the mean amplitude of the fraction, b is the mean amplitude of the planning scan and N is the number of fractions. The deviation from the mean was calculated using b as the mean amplitude of the patient. Lastly, the variance within each fraction was determined using the above formula, where a is the local amplitude, b is the mean amplitude of the fraction and N is the number of local amplitudes in the fraction. The mean of these variances would give the mean variance in amplitude within a fraction. The corresponding values for frequency were calculated in a similar way.
${{\sum {{{\left( {a - b} \right)}^2}} } \over N}$
, where a is the mean amplitude of the fraction, b is the mean amplitude of the planning scan and N is the number of fractions. The deviation from the mean was calculated using b as the mean amplitude of the patient. Lastly, the variance within each fraction was determined using the above formula, where a is the local amplitude, b is the mean amplitude of the fraction and N is the number of local amplitudes in the fraction. The mean of these variances would give the mean variance in amplitude within a fraction. The corresponding values for frequency were calculated in a similar way.
Finally, a cross-correlation analysis of different patient characteristics was performed to identify which patient characteristics are predictive of an inconsistent breathing pattern. The following characteristics were considered: gender, age at the start of treatment, weight, asthma, chronic obstructive pulmonary disorder (COPD) and variance in the respiratory signals within the planning scan. Based on their experience during treatments, radiation therapists speculate that the first five characteristics influence breathing patterns. Variance within the planning scan was chosen because a patient is likely to breathe inconsistently during all fractions if the patient exhibits an inconsistent breathing pattern during the planning scan. This variance is divided into three variables: the variance in the planning scan signal, calculated by taking the variance in the raw signal before preprocessing, variance in local amplitudes within the planning scan, and variance in local frequencies within the planning scan. A cross-correlation analysis in MATLAB was used to determine which factors were associated with the variance in the frequency and amplitude of the patients’ respiratory signals. A p-value <0·05 was considered significant. Patients 1–6 were excluded from this analysis because their data were derived from a previous dataset that did not contain this information.
Results
Two patients’ data were excluded because their planning scan contained only a few seconds of breathing data which made analysis impossible. Therefore, analysis was done using the data of 27 patients.
Analysis of breathing amplitude
Figure 2 shows the variance in breathing amplitude from the planning scan and from the mean of the fractions as well as the mean variance in amplitude within a fraction and summarises the results presented in Appendix A. The variances from the planning scan for patients 2 and 14 were 25·5 and 29·6 mm2, respectively, whereas the other patients showed a variance of <10 mm2. All patients showed a variance from the mean of <5 mm2. The mean variances in amplitude within a fraction for patients 19 and 27 were 6·8 and 6·4 mm2, respectively, whereas the other patients showed a mean variance of <5 mm2.

Figure 2. Variance in amplitude from planning scan and mean and the mean variance in amplitude during the fractions of patient 1–28.
Analysis of breathing frequency
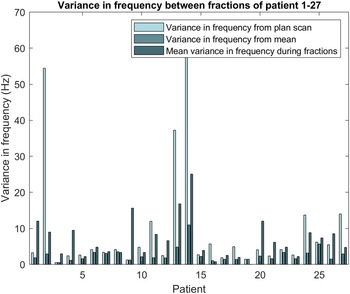
Figure 3 shows the variance in breathing frequency from the planning scan and from the mean of the fractions and summarises the results presented in Appendix B. The variances from the planning scan for patients 2, 13 and 14 were 54, 37 and 62 Hz2, respectively, whereas the other patients showed a variance of <20 Hz2. Patient 14 showed a variance from the mean of the fractions of 11 Hz2, whereas the other patients showed a variance from the mean of <5 Hz2. The mean variance in frequency within a fraction was 25 Hz2 for patient 14 and <20 Hz2 for the other patients.

Figure 3. Variance in frequency from planning scan and mean and the mean variance in frequency during the fractions of patient 1–28.
Correlation between coefficients
Table 1 shows the correlation between patient characteristics and the variance in the frequency and amplitude from the planning scan. The full correlation matrix is presented in Appendix C. The correlation coefficient between the variance in frequency from the planning scan and the variance in amplitude from the planning scan was 0·91. The bold values indicate a correlation coefficient of ≥ 0·44 associated with a p-value <0·05. All patient characteristics (gender, age at the start of treatment, weight, asthma and COPD) showed a weak correlation with both the variance in frequency from the planning scan and the variance in amplitude from the planning scan. Moreover, the correlation between these variables was weak (Appendix C). Table 2 presents the p-values associated with the correlation coefficients. The full matrix can be found in Appendix D. The bold values in Table 2 are statistically significant with a confidence interval of 95%. The other correlations were not statistically significant.
Table 1. Correlation between the characteristics of the patient and the variance in frequency and amplitude from the planning scan. The bold values represent the values with a p-value lower than 0·05

Table 2. p-Values of the correlation between the characteristics of the patient and the variance in frequency and amplitude from the planning scan. The bold values represent p-values lower than 0·05

Discussion
Difference in respiratory signals between the fractions and the planning scan
Some patients showed a substantial difference in the amplitude and frequency of respiratory signals from the planning scan, whereas other patients exhibited stable respiratory signals during each fraction. Remarkably, patients that showed a marked difference in amplitude from the planning scan, such as patients 2 and 14, also showed a substantial difference in frequency from the planning scan. This correlation was found to be statistically significant in the cross-correlation analysis. This is reasonable because respiratory amplitude and frequency both contribute to the amount of air breathed per minute. Reference Rhoades, Rhoades and Bell19 This knowledge can be valuable because measuring only the frequency or the amplitude instead of both would be more efficient.
Notably, a large variance from the planning scan does not necessarily indicate a large variance from the mean. This is an important observation that makes this research more relevant for clinical settings. When a patient appears to breathe differently from the breathing pattern during the planning scan but has a steady breathing pattern, a new planning scan can be performed that is more representative for the patient’s respiratory movements.
An advantage of performing this signal analysis immediately before the radiation would be that when a patient’s breathing pattern is inconsistent, the patient could be asked to wait in the waiting room for 15 more minutes to relax. Also, it is possible to wait for 5 min in the treatment room and try again. This would lead to a more consistent breathing pattern during the treatment period.
Prediction of abnormal breathing patterns
The results of the correlation matrix showed that no correlation existed between the patient characteristics gender, age at the start of treatment, weight, asthma and COPD, indicating that it is difficult to predict whether a patient will have an abnormal breathing pattern using these factors. Features from the planning scan do show a significant correlation with the variance in amplitude and frequency. This shows that there is a possibility for predicting the likelihood of abnormal breathing patterns on the basis of the planning scan. When this finds its application in the clinical settings, it might be possible to treat patients who are predicted to exhibit a very similar breathing pattern in each fraction, with a smaller treatment margin. This results in lower radiation of the normal tissue, preventing tissue toxicity. However, it can be predicted that a patient will breathe very differently from the planning scan. In this case, the decision can be made to perform a new planning scan with a more representative breathing pattern for the patient.
Further research
The main limitation of this study is the lack of information about the relationship between the internal anatomical changes and the changes in the respiratory signals. This is important because the elasticity of the lung tissue may cause a disconnection between thorax movement and tumour movement. Reference Keall, Mageras and Balter20 The first steps to relate internal and external movements were taken by Vedam et al. Reference Gierga, Brewer, Sharp, Betke, Willet and Chen21 and Mageras et al; Reference Vedam, Kini, Keall, Mostafavi and Mohan22 both studies found a correlation between external markers and diaphragm motion. Furthermore, a correlation between external abdominal skin markers and abdominal tumour motion was reported by Gierga et al. Reference Mageras, Pevsner and Yorke23 Fayad et al. Reference Fayad, Pan, François Clement and Visvikis24 suggested a correlation between external surface motion and internal anatomical markers including the aortic cross, sternum, carina, left and right diaphragm, and tumour location of 10 patients. However, the tumour location was not specified in this research. Future research needs to establish a relationship between tumour movement and chest movement for tumours in different regions of the lung. If this relationship is established, prediction of the representativeness of the planning scan can help reduce treatment margins, normal tissue toxicity and missed target volume. Further research should also include investigation of the feasibility and value of a signal analysis before radiation to check the consistency of the breathing pattern of the patient and whether a short waiting period can improve those results.
Conclusion
In this research, a method to analyse respiratory signals for respiratory gating was developed to investigate whether the planning scan is representative during the treatment fractions of patients with lung cancer. Variances from the planning scan indicate that respiratory signals can substantially differ between the planning scan and the fractions. Variances from the mean suggest that some patients can have a steady breathing pattern that differs from that observed in the planning scan; such patients may benefit from a new planning scan. A cross-correlation analysis showed that the respiratory signals from the planning scan may be used to predict whether the planning scan will be representative and usable as a control measure during radiotherapy fractions. Also, due to correlation between amplitude and frequency, it is sufficient to monitor only one of these variables during radiation. In further research, the relationship between respiratory signals and tumour movement needs to be investigated. If this relationship is established, prediction of the representativeness of the planning scan can help reduce treatment margins, normal tissue toxicity and missed target volume.
Acknowledgements
None.
Financial Support
None.
Conflicts of Interest
None.
Ethical Standards
The authors assert that all procedures contributing to this work comply with the ethical standards of the Medisch Spectrum Twente hospital, Enschede, the Netherlands, and the relevant national guidelines on human experimentation in the Netherlands and with the Helsinki Declaration of 1975, as revised in 2008.
Sources of Support
None
Appendix A. Amplitudes of breathing during the planning scan and fractions of 27 patients. Each Figure represents a patient, the blue bar represents the amplitude of breathing during the fraction. The grey line represents the amplitude of breathing during the planning scan.

Appendix B. Frequencies of breathing during the planning scan and fractions of 27 patients. Each figure represents a patient, the blue bar represents the frequency of breathing during the fraction. The grey line represents the frequency of breathing during the planning scan.

Appendix C. Correlation coefficients.

Appendix D. p-Values of the correlation matrix.


 Open access