


1 Introduction
Achieving net energy production in magnetic confinement fusion devices is a key milestone in the quest for fusion energy. No experiment has yet been able to study plasma regimes in breakeven conditions, i.e. producing more power by fusion reactions than is consumed in heating the plasma. The study of reactor-relevant, alpha-heating-dominated, burning plasma scenarios and high power density regimes will provide insights on important physics relevant for ITER (Doyle et al. Reference Doyle, Houlberg, Kamada, Mukhovatov, Osborne, Polevoi, Bateman, Connor, Cordey and Fujita2007) operations and for fusion pilot plants, such as ARC (Sorbom et al. Reference Sorbom, Ball, Palmer, Mangiarotti, Sierchio, Bonoli, Kasten, Sutherland, Barnard and Haakonsen2015; Kuang et al. Reference Kuang, Cao, Creely, Dennett, Hecla, LaBombard, Tinguely, Tolman, Hoffman and Major2018) and DEMO (Maisonnier Reference Maisonnier2008). With this goal as its mission, the SPARC tokamak is being designed jointly by the MIT Plasma Science and Fusion Center and Commonwealth Fusion Systems.
SPARC will be a pulsed, high-field, compact tokamak operating with deuterium–tritium (DT) fuel and with ion cyclotron range-of-frequencies (ICRF) auxiliary heating. The high strength of the magnetic field, enabled by new high-temperature superconductor (HTS) technology, will allow operation at high plasma current and high absolute density, leading to net fusion output in a device with a size comparable to current medium-sized tokamaks. A SPARC mission objective has been established as the demonstration and study of  $Q > 2$ plasma conditions, where $Q$ represents the ratio between the total fusion power and the external power absorbed in the plasma.
Following a traditional workflow, as employed for the design of ITER (Doyle et al. Reference Doyle, Houlberg, Kamada, Mukhovatov, Osborne, Polevoi, Bateman, Connor, Cordey and Fujita2007), SPARC baseline parameters were first selected using empirical scaling laws and Plasma OPeration CONtour (POPCON) analysis (Houlberg, Attenberger & Hively Reference Houlberg, Attenberger and Hively1982).
The parameters of the SPARC reference H-mode DT discharge are indicated in table 1, and details on the selection of plasma parameters using POPCONs can be found in Creely et al. (Reference Creely, Greenwald, Ballinger, Brunner, Canik, Doody, Garnier, Granetz, Holland and Howard2020).
Table 1. Main plasma parameters in nominal DT H-mode operation for current SPARC design (SPARC V2).  $R_0$ is the geometric major radius, $a$ is the minor radius, $B_{T}$ is the vacuum toroidal magnetic field on axis, $I_{p}$ is the total plasma current, $\kappa _{\textrm {sep}}$ and $\delta _{\textrm {sep}}$ are elongation ( $b/a$) and triangularity at the separatrix, respectively, $P_{\textrm {ICRF}}$ is the coupled ICRF power and $f_{G}$ is the Greenwald fraction evaluated with the volume-averaged density.
Empirical scalings with conservative assumptions ( $H_{98,y2}=1.0$ (Doyle et al. Reference Doyle, Houlberg, Kamada, Mukhovatov, Osborne, Polevoi, Bateman, Connor, Cordey and Fujita2007) and density profile peaking factors as empirically predicted (Angioni et al. Reference Angioni, Weisen, Kardaun, Maslov, Zabolotsky, Fuchs, Garzotti, Giroud, Kurzan and Mantica2007)) for the reference discharge in SPARC predict $Q\approx 11$, which is well above the $Q>2$ mission (Creely et al. Reference Creely, Greenwald, Ballinger, Brunner, Canik, Doody, Garnier, Granetz, Holland and Howard2020). For this SPARC design, operating baseline density is not set by the empirical limit (Greenwald et al. Reference Greenwald, Terry, Wolfe, Ejima, Bell, Kaye and Neilson1988), but by an administrative limit on the neutron power that the machine is designed to endure ( $P_{\textrm {fus}}=140 \ \textrm {MW}$). Separatrix shaping parameters come from free-boundary magnetic equilibrium simulations with realistic coil configuration, as will be detailed in § 3.1.2. ICRF heating power is set to the level required to sustain the H-mode at the operational density, accounting for alpha heating to maintain the plasma above the L–H power threshold (Martin et al. Reference Martin and Takizuka2008). As will be shown in this paper, high-field operation provides high-performance and significant margin against uncertainties and operational limits. Kink safety factor ( $q^*=3.05$), normalized density ( $f_{G}=0.37$) and normalized pressure ( $\beta _{N}=1.0$) are at reasonably safe levels of operation, as is further discussed in Sweeney et al. (Reference Sweeney, Creely, Doody, Fülöp, Garnier, Granetz, Greenwald, Hesslow, Irby and Izzo2020). The performance predictions using empirical scalings illustrate that SPARC will be a compelling experiment to study burning plasma physics, relevant to ITER and future devices, given the significant margin for the $Q>2$ mission.
The development and validation of theory-based reduced models and integrated modelling frameworks in recent years (Kinsey et al. Reference Kinsey, Staebler, Candy, Waltz and Budny2011; Citrin et al. Reference Citrin, Bourdelle, Casson, Angioni, Bonanomi, Camenen, Garbet, Garzotti, Görler and Gürcan2017; Kim et al. Reference Kim, Romanelli, Yuan, Kaye, Sips, Frassinetti and Buchanan2017; Meneghini et al. Reference Meneghini, Smith, Snyder, Staebler, Candy, Belli, Lao, Kostuk, Luce and Luda2017; Linder et al. Reference Linder, Citrin, Hogeweij, Angioni, Bourdelle, Casson, Fable, Ho, Koechl and Sertoli2018; Rodriguez-Fernandez et al. Reference Rodriguez-Fernandez, White, Howard, Grierson, Staebler, Rice, Yuan, Cao, Creely and Greenwald2018; Angioni et al. Reference Angioni, Fable, Ryter, Rodriguez-Fernandez and Pütterich2019; White Reference White2019) have allowed physic-based simulations to also inform the design of SPARC during the early stages of its development. This paper presents results from both empirical scalings and integrated modelling simulations of SPARC plasmas, with a focus on evaluating fusion gain with theory-based models and assessing the sensitivity to plasma physics assumptions. The workflows developed here are of special importance looking ahead towards the design of commercially competitive fusion pilot plants. In particular, SPARC will be a crucial testbed for validating simulation workflows and plasma physics models for ARC and the high-field path.
Section 2 presents results of the optimization and exploration of the SPARC parameter space with POPCON empirical predictions, demonstrating that the SPARC operational regime is very robust to uncertainties in plasma physics. Section 3 introduces the integrated modelling framework used to predict H-mode performance of SPARC plasmas with physics-based models, which results in very good agreement with the empirical predictions. Section 4 dives into the physics of turbulence transport expected for the core of SPARC, and it presents a discussion on the validity of the quasilinear turbulent transport approximation used in integrated modelling. Finally, Section 5 presents conclusions and final remarks.
2 Empirical predictions of SPARC plasmas
As a first step to evaluate fusion performance for the current version of the SPARC design, a ‘0-D’ global scaling approach is taken. Given engineering parameters (plasma dimensions, field, current and fuel mix), this approach employs empirical scalings to evaluate plasma energy confinement (Doyle et al. Reference Doyle, Houlberg, Kamada, Mukhovatov, Osborne, Polevoi, Bateman, Connor, Cordey and Fujita2007) and profile peaking factors (Angioni et al. Reference Angioni, Weisen, Kardaun, Maslov, Zabolotsky, Fuchs, Garzotti, Giroud, Kurzan and Mantica2007). Volume-averaged temperature and density are then calculated assuming a simple functional form for the kinetic profiles, and total fusion power and resulting gain are obtained from fusion reaction rates.
This information, along with physics and engineering limits, is encoded in POPCON plots, which define power contours and operational points in the  $\langle n_e\rangle$– $\langle T_i\rangle$ space. Several criteria are employed to limit the possible operational range for SPARC. First, net conducted power must be above the ITPA scaling (Martin et al. Reference Martin and Takizuka2008) for the H-mode power threshold ( $P_{\textrm {net}}/P_{\textrm {thr}}>1$), which has been found in previous work (Hughes et al. Reference Hughes, Loarte, Reinke, Terry, Brunner, Greenwald, Hubbard, LaBombard, Lipschultz and Ma2011) to be needed for ‘healthy’ H-mode operation. Second, total fusion power must be below the limits that the machine is being designed for. In particular, it is estimated that $P_{\textrm {fus}}=140\ \textrm {MW}$ is the fusion power limit to avoid damage by heating of toroidal field magnets. Third, volume average density and pressure must be below the Greenwald density and pressure ( $\beta$) limits, respectively, which turn out not to be restrictive conditions for SPARC. Lastly, the total absorbed ICRF auxiliary power must be below the power available ( $P_{\textrm {ICRF}}<25\ \textrm {MW}$ absorbed in the plasma).
These POPCON plots provide an extremely rapid means of evaluating sensitivities to input parameters and assumptions and can readily be used to scope the parameter space for machine optimization. Figure 1 reflects the POPCON plot corresponding to the SPARC parameters indicated in table 1. The operational range indicated in yellow is such that the limits are met and the fusion gain mission  $Q>2$ is achieved. The maximum fusion gain, $Q=11.2$, occurs at the intersection of the curves that limit the total fusion power and the L–H power threshold. At the selected H-mode operational point, the L–H power threshold is $P_{\textrm {thr}}\approx 30\ \textrm {MW}$, although H-mode access is expected to happen at lower densities, as discussed in detail in Hughes et al. (Reference Hughes, Howard, Rodriguez-Fernandez, Creely, Kuang, Snyder, Wilks, Sweeney and Greenwald2020). This analysis is independent from that presented in Creely et al. (Reference Creely, Greenwald, Ballinger, Brunner, Canik, Doody, Garnier, Granetz, Holland and Howard2020) and uses slightly different methods to account for peaking, impurity content and profile shapes. However, fusion gain is remarkably similar.

Figure 1. SPARC operational space, bounded by L–H threshold ( $P_{\textrm {net}}/P_{\textrm {thr}}>1$, green), maximum allowed fusion power ( $P_{\textrm {fus}}<140\ \textrm {MW}$, blue), available ICRF power ( $P_{\textrm {ICRF}}<25\ \textrm {MW}$, black) and density limit ( $\langle n_{e}\rangle /n_{G}<1$, cyan). $Q_{\max }=11.2$ (circle). The yellow area indicates feasible operation with $Q>2$. SPARC parameters used to generate this POPCON are indicated in table 1, and $H_{98,y2}=1$ is assumed everywhere. Note that the distribution of curves in this POPCON is slightly different from that presented in Creely et al. (Reference Creely, Greenwald, Ballinger, Brunner, Canik, Doody, Garnier, Granetz, Holland and Howard2020) because of slightly different assumptions and impurity physics, but it provides the same result and confirms the robustness of the solution.
From figure 1, it is also inferred that significantly higher fusion power ( ${\sim }380\ \textrm {MW}$) would be produced if the density were allowed to rise to the point where performance was limited by available ICRF input power, suggesting that control of the density will be important and burn control will be an issue that SPARC must address.
2.1 Sensitivity analysis
Scans for the main physics and engineering assumptions have been performed around the nominal operating point ( $Q=11.2$). In terms of the energy confinement, it is found that SPARC would achieve $Q=5$ at one standard deviation below the ITER98y2 scaling law, and $Q>2$ is predicted even for $H_{98,y2} = 0.7$, as shown in figure 2(a). Interestingly, figure 2(a) illustrates that fusion power is restricted by the administrative limit of $P_{\textrm {fus}}<140\ \textrm {MW}$ for $H_{98,y2}>0.85$. Each POPCON evaluation in figure 2(a) provides a different combination of $\langle n_e\rangle$–
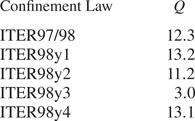
 $\langle T_i\rangle$ that satisfies all constraints and maximizes fusion gain. Table 2 indicates the maximum fusion gain as predicted with POPCON analysis for different confinement laws, evidencing that the $Q>2$ H-mode mission is amply satisfied, with the exception of ITER98y3. However, this latter scaling law was derived by explicitly excluding data from Alcator C-Mod (Greenwald et al. Reference Greenwald, Bader, Baek, Bakhtiari, Barnard, Beck, Bergerson, Bespamyatnov, Bonoli and Brower2014) – the only compact high-field machine in the database – which is an unreasonable approach to predict performance in SPARC.
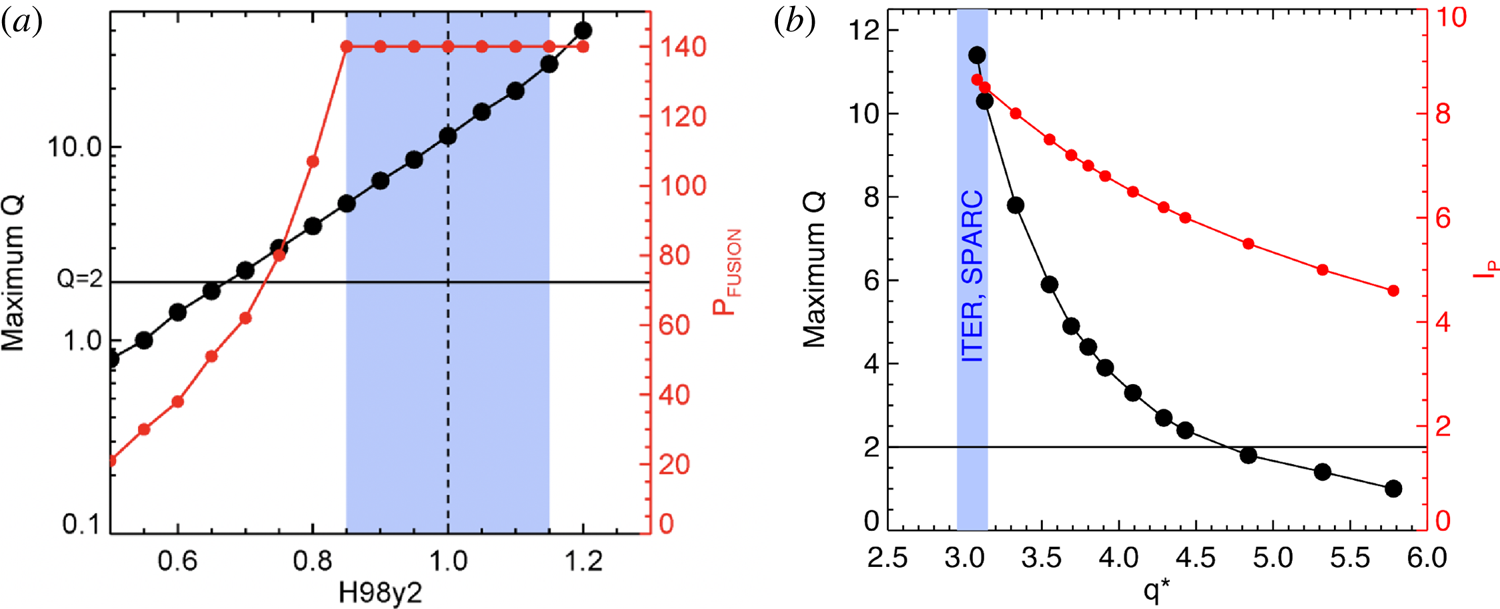
Figure 2. Fusion gain  $Q$ plotted against (a) the multiplier on the confinement scaling law $H_{98,y2}$ and (b) $q^*$. Total fusion power and plasma current are also indicated.
Table 2. Predicted fusion gain  $Q$ by POPCON analysis for different energy confinement scaling laws (ITER Physics Expert Group on Confinement and Transport et al. 1999) with the same assumptions.
Even though empirical data (Angioni et al. Reference Angioni, Weisen, Kardaun, Maslov, Zabolotsky, Fuchs, Garzotti, Giroud, Kurzan and Mantica2007) and transport simulations (showed later in this paper) predict modest density peaking, sensitivity analysis indicates that SPARC achieves  $Q\sim 4$ with flat density profiles. In general, using the same assumptions for the temperature profile, higher density peaking leads to higher performance.
As shown in figure 2(b), using the same assumption for the evaluation of  $q^*$ as ITER,Footnote 1 plasma current could be reduced to ${\sim }5.5\ \textrm {MA}$ ( $q^*\sim 4.8$) and still have the device exceed $Q > 2$, providing a large margin against the external kink instability. SPARC could also achieve $Q > 1$ at $8\ \textrm {T}$ (and $I_{p}=5.7\ \textrm {MA}$), providing a useful way-point during machine commissioning and a platform for discharge development. Operation at $8\ \textrm {T}$ will allow the demonstration of considerable fusion power away from engineering and machine limits, and the use of hydrogen (H) minority at $8\ \textrm {T}$ will also allow demonstration of the ICRF system.
In terms of impurity content, the POPCON in figure 1 and sensitivity scans in figure 2 used the nominal assumption of  $Z_{\textrm {eff}}=1.5$ (Creely et al. Reference Creely, Greenwald, Ballinger, Brunner, Canik, Doody, Garnier, Granetz, Holland and Howard2020), but SPARC is able to maintain $Q > 2$ with a $Z_{\textrm {eff}}$ as high as $3.4$, assuming carbon to be the dominant impurity. High-Z impurities must be maintained at low levels, but SPARC can tolerate concentrations well within the range found in existing devices with tungsten divertor, such as ASDEX Upgrade and JET-ILW (Neu et al. Reference Neu, Dux, Kallenbach, Pütterich, Balden, Fuchs, Herrmann, Maggi, O'Mullane and Pugno2005, Reference Neu, Brezinsek, Beurskens, Bobkov, de Vries, Giroud, Joffrin, Kallenbach, Matthews and Mayoral2014).
3 Integrated modelling of SPARC plasmas
Section 2 has presented predictions of performance with empirical scaling laws, including sensitivity analysis with respect to several assumptions. While the results indicate that the SPARC design is fairly robust against physics uncertainties, it is important to make sure that such predictions are consistent with physics-based models. Only recently have integrated modelling simulations with high-fidelity physics become possible, thanks to extensive code development and validation efforts in our community (see White (Reference White2019) and references therein). Remarkable agreement with experimental transport phenomena has been found in many cases (e.g. Angioni et al. Reference Angioni, Fable, Ryter, Rodriguez-Fernandez and Pütterich2019; Rodriguez-Fernandez et al. Reference Rodriguez-Fernandez, White, Howard, Grierson, Zeng, Yuan, Staebler, Austin, Odstrcil and Rhodes2019; Luda et al. Reference Luda, Angioni, Dunne, Fable, Kallenbach, Bonanomi, Schneider, Siccinio and Tardini2020), and database studies have suggested that physics-based models of heating and transport perform equally as well as, if not better than, empirical scalings in predicting performance in present devices. Integrated simulations are now routinely used to inform and optimize the design of SPARC.
3.1 Methodology
The modelling workflow used in this work to assess SPARC performance utilizes the TRANSP 1.5-D power-balance code (Breslau et al. Reference Breslau, Gorelenkova, Poli, Sachdev and Yuan2018), coupled to the PT_SOLVER numerical scheme (Yuan et al. Reference Yuan, Jardin, Hammett, Budny and Staebler2013) to solve the set of implicit transport equations. Particularly in this work, ion and electron energy and electron particle equations are evolved using the TGLF-SAT1 turbulent transport model (Staebler, Kinsey & Waltz Reference Staebler, Kinsey and Waltz2007; Staebler et al. Reference Staebler, Howard, Candy and Holland2017). Sources of heat (including ohmic heating) and particles are calculated self-consistently through TRANSP, including coupling to the full-wave TORIC code (Brambilla Reference Brambilla1999) to calculate ICRF heating and NUBEAM Monte–Carlo fast-ion code (Pankin et al. Reference Pankin, McCune, Andre, Bateman and Kritz2004) for calculation of alpha heating, fast ion populations and the thermal  ${}^{4}\textrm {He}$ ash particle source. The boundary condition for the kinetic profiles prediction is chosen as the value of pressure at the top of the pedestal, as given by the EPED model (Snyder et al. Reference Snyder, Groebner, Leonard, Osborne and Wilson2009, Reference Snyder, Groebner, Hughes, Osborne, Beurskens, Leonard, Wilson and Xu2011, Reference Snyder, Hughes, Osborne, Paz-Soldan, Solomon, Knolker, Eldon, Evans, Golfinopoulos and Grierson2019) and choosing a density consistent with the desired SPARC operating point. In the following subsections, details on the different physics assumed in TRANSP are presented.
3.1.1 Heating models
During nominal operation, D–T( ${}^{3}\textrm {He}$) ICRF minority heating at $120\ \textrm {MHz}$ will be utilized for on-axis heating of both ${}^{3}\textrm {He}$ and T, employing field-aligned ICRF antennas (Wukitch et al. Reference Wukitch, Brunner, Ennever, Garrett, Hubbard, Labombard, Lau, Lin, Lipschultz and Miller2014). RF power deposition is modelled with the TORIC (Brambilla Reference Brambilla1999) code, and the bounce-averaged Fokker–Planck FPPMOD (Hammett Reference Hammett1986) model is used in TRANSP to estimate the response of the minority species to the wave field and thus predict power absorption. In this work, the ${}^{3}\textrm {He}$ minority density profile is taken to be proportional to the electron density at all times during the simulations. A minority concentration of $5\,\%$ relative to the electron density is found optimal for efficient bulk ion heating and single pass absorption (Lin, Wright & Wukitch Reference Lin, Wright and Wukitch2020). Future work will explore ${}^{3}\textrm {He}$ profile and concentration effects on the ICRF power deposition.
In plasmas with significant fusion reaction rates, it is important to appropriately model fusion ion sources, slowing down and accompanying deposited power profiles. TRANSP is capable of modelling  $\textrm {D}+\textrm {D}$, $\textrm {T}+\textrm {T}$ and $\textrm {D}+\textrm {T}$ fusion reactions (isotropic and monoenergetic) and resulting fast ions are followed by the NUBEAM (Pankin et al. Reference Pankin, McCune, Andre, Bateman and Kritz2004) Monte–Carlo code, which models the time-dependent evolution of the slowing-down population. Deposited power during the slowing-down process is used to heat up electrons and thermal ion species, and thermalized NUBEAM ${}^{4}\textrm {He}$ particles are used as the particle source of thermal ${}^{4}\textrm {He}$ (ash) species.
3.1.2 Magnetic equilibrium, current diffusion and sawtooth modelling
The magnetic equilibrium is computed self-consistently with the TEQ Grad–Shafranov solver (LoDestro & Pearlstein Reference LoDestro and Pearlstein1994) in fixed-boundary mode, i.e. taking the last-closed flux surface (LCFS) as input. The LCFS in this work comes from simulations with the Tokamak Simulation Code (TSC) (Jardin, Pomphrey & Delucia Reference Jardin, Pomphrey and Delucia1986) free-boundary equilibrium solver. TSC is able to evolve the LCFS and internal equilibrium self-consistently with the machine central solenoid, poloidal field coil set and passive electrical elements, from plasma breakdown to ramp-down, using simplified transport and heating. The flat-top LCFS is given to TRANSP in the form of Fourier moments and not evolved during the simulation.
In TRANSP, poloidal magnetic field diffusion is self-consistently solved along with the Grad–Shafranov equations, and bootstrap current is predicted using the Hager model (Hager & Chang Reference Hager and Chang2016), which uses an analytical formula based on nonlinear simulations with gyro-kinetic ions and drift-kinetic electrons. Current density is initialized in the simulation by taking the  $q$-profile obtained from the TSC simulation at the beginning of the current flat-top. Because this work presents results of SPARC performance in standard H-mode operation using conservative assumptions, beneficial transport effects related to possible fine-tuning of the magnetic shear profile (Kessel et al. Reference Kessel, Manickam, Rewoldt and Tang1994) are not included (e.g. heating during ramp-up or current drive).
Due to the presence of a  $q=1$ surface soon after the beginning of the flat-top, sawtooth crashes are present throughout the simulation, and must be taken into consideration. The Porcelli sawtooth model (Porcelli, Boucher & Rosenbluth Reference Porcelli, Boucher and Rosenbluth1996) is used to predict the sawtooth trigger times and mixing. The onset of an $m=1$ mode associated with the effective potential energy functional (equation (13) in Porcelli et al. Reference Porcelli, Boucher and Rosenbluth1996) is predicted to be the dominant instability mechanism, and modest fast ion stabilization is assumed. A magnetic reconnection fraction of $37\,\%$ is used, which was shown to provide the best overall agreement with experiments in JET and TFTR (Bateman et al. Reference Bateman, Nguyen, Kritz and Porcelli2006). In practice, this means that $q$ becomes unity after the sawtooth crash only in the $37\,\%$ of the plasma core inside, and closest to, the sawtooth mixing radius radius, and $q$ remains below unity for the rest of the inner plasma core. Consequently, two current sheets form (which diffuse away soon after the crash), and this workflow employs a finite current sheet width of ${\rm \Delta} \rho _{N}=0.05$, where $\rho _{N}$ is the square root of the normalized toroidal flux, to help convergence of the equilibrium solver during sawtooth crashes.
3.1.3 Impurity content
Impurity content is provided as an input to the simulation by supplying a spatially uniform value of  $Z_{\textrm {eff}}=1.5$, along with concentrations of a mix of impurity ions. A main-ion dilution of $n_{\textrm {DT}}/n_e=0.85$ is assumed, to be consistent with the 0-D analysis (Creely et al. Reference Creely, Greenwald, Ballinger, Brunner, Canik, Doody, Garnier, Granetz, Holland and Howard2020). The average impurity mix that will be present in SPARC H-mode plasmas is beyond current predictive capabilities because source rates depend on details of plasma–wall interactions and edge transport. Here we include the contributions of both low- and high- $Z$ impurities. Tungsten ( $Z=74$) is used as proxy for high- $Z$ impurities in SPARC, with a nominal concentration of $n_W/n_e=1.5\times 10^{-5}$ assumed for baseline simulations. This W concentration was demonstrated to be feasible in ASDEX Upgrade and JET (Neu et al. Reference Neu, Dux, Kallenbach, Pütterich, Balden, Fuchs, Herrmann, Maggi, O'Mullane and Pugno2005, Reference Neu, Brezinsek, Beurskens, Bobkov, de Vries, Giroud, Joffrin, Kallenbach, Matthews and Mayoral2014) and it was assumed in the POPCON analysis in Creely et al. (Reference Creely, Greenwald, Ballinger, Brunner, Canik, Doody, Garnier, Granetz, Holland and Howard2020). Accounting also for 5 % ${}^{3}\textrm {He}$ minority, the contribution from low- $Z$ impurities can be self-consistently calculated from quasineutrality and the assumptions of $Z_{\textrm {eff}}=1.5$ and $n_{\textrm {DT}}/n_e=0.85$. In SPARC, the average impurity that is consistent with these constraints has $Z=9$ (‘lumped’ low- $Z$ impurity). A full coronal equilibrium for the two proxy impurities ( $Z=74, Z=9$) is used throughout the simulations, which is important in order to calculate line radiation from each impurity charge state. Bremsstrahlung and synchrotron radiation are also modelled in TRANSP.
3.1.4 Transport
The boundary condition for transport calculations is chosen as the value of temperature and density at the top of the pedestal. Both height and width of the pressure pedestal are computed with the EPED model (Snyder et al. Reference Snyder, Groebner, Leonard, Osborne and Wilson2009, Reference Snyder, Groebner, Hughes, Osborne, Beurskens, Leonard, Wilson and Xu2011, Reference Snyder, Hughes, Osborne, Paz-Soldan, Solomon, Knolker, Eldon, Evans, Golfinopoulos and Grierson2019), which accounts for instabilities and transport driven by kinetic-ballooning and peeling-ballooning modes, believed to set pedestal conditions for type I ELMy H-mode conditions. The electron density at the pedestal top is an input to the model to give desired volume average density (in order to match the volume-averaged Greenwald fraction, as specified in table 1). It is found that predicted pedestal pressure is not a strong function of the global normalized beta in the range of interest for SPARC ( $\beta _{N}\sim 1.0\text {--}1.3$). Consequently, EPED is run outside of TRANSP. This modelling choice substantially reduces computational cost and improves convergence of the transport solver. The validity of this assumption is demonstrated in § 3.4.
The time-dependent evolution of the nonlinear energy and particle equations for electron and ion temperatures and electron density are solved using Newton iterations (Jardin et al. Reference Jardin, Bateman, Hammett and Ku2008) over 100 equally spaced radial zones, from the top of the pedestal up to  $\rho _{N}=0.2$. Neoclassical transport is estimated using the Chang–Hinton analytic model (Chang & Hinton Reference Chang and Hinton1982), and turbulent transport fluxes are calculated with the trapped gyro-Landau fluid (TGLF-SAT1) quasilinear model (Staebler et al. Reference Staebler, Kinsey and Waltz2007, Reference Staebler, Howard, Candy and Holland2017). From $\rho _{N}=0.2$ to the magnetic axis, anomalous thermal diffusivities are forced to follow a linear profile, with an on-axis value of $\chi _{\textrm {anom}} =0.1\,\textrm {m}^{2}\,\,\textrm {s}^{-1}$, which is roughly the value calculated by TGLF at $\rho _{N}=0.2$. This ad hoc treatment of on-axis transport is implemented because of the known difficulties of present heat transport models to predict turbulence and associated transport near the magnetic axis. This choice of diffusivities is a conservative assumption, and provides smooth temperature profiles with reasonable peaking near-axis, compared to the very peaked profiles when physics-based models for turbulence and neoclassical transport are used all the way to the magnetic axis.
The SPARC tokamak will not have neutral beams, and thus toroidal plasma rotation is expected to only have contributions from self-generated residual turbulent stresses, i.e. intrinsic rotation (Rice et al. Reference Rice, Ince-Cushman, deGrassie, Eriksson, Sakamoto, Scarabosio, Bortolon, Burrell, Duval and Fenzi-Bonizec2007; Diamond et al. Reference Diamond, McDevitt, Gürcan, Hahm, Wang, Yoon, Holod, Lin, Naulin and Singh2009). Since intrinsic toroidal rotation is predicted to be small and the uncertainties are significant, the workflow used here to predict SPARC performance makes the conservative assumption that there will be no rotation. The presence of intrinsic rotation would probably lead to a small increase in performance through perpendicular flow shear stabilization of core turbulence.
3.2 Nominal performance
To initialize TRANSP, the  $q$-profile is taken from the TSC simulation at the beginning of the current flat-top. To accelerate initial convergence of transport and equilibrium solvers, GLF23 (Waltz et al. Reference Waltz, Staebler, Dorland, Hammett, Kotschenreuther and Konings1997) is used initially as the turbulent transport model, which has a more simplified treatment of the gyro-fluid equations and saturation rule than TGLF, allowing for much higher speed. GLF23 is used to estimate the evolution of core profiles during the L–H transition and is run for at least two energy confinement times ( ${\sim }1.5\ \textrm {s}$). It is found that the Porcelli model for sawtooth triggering indicates that the first sawtooth crash occurs soon after the plasma enters into H-mode. Kinetic and current profiles $50\ \textrm {ms}$ before the last sawtooth crash with GLF23 are taken to initialize the TGLF simulations. Using this modelling technique, we have observed improved speed and convergence. As will be shown in § 3.5, the evolution of the kinetic quantities during the TGLF evolution phase follow a monotonic trend. Consequently, simulations are terminated when the volume-averaged ion temperature and density and fusion gain $Q$ do not change more than $5\,\%$ at the top of two consecutive sawtooth crashes. This convergence criterion is typically met after ${\sim }4\text {--}5$ energy confinement times.
Figure 3(a) shows the plasma separatrix and calculated internal equilibrium (equally spaced square root of normalized toroidal flux surfaces). Figure 3(b) depicts the predicted temperature and density profiles with nominal parameters and heating power as indicated in table 1. Only profiles at the top of the last simulated sawtooth crash are plotted. It is observed that electron and ion temperatures are fairly well equilibrated ( $T_e\approx T_i$), and density exhibits moderate peaking ( $\nu _{n_e}= n_{e0}/\langle n_e\rangle \sim 1.3$), which is lower than the empirical scaling observed for density peaking, but is within the observed spread in experimental data (Angioni et al. Reference Angioni, Weisen, Kardaun, Maslov, Zabolotsky, Fuchs, Garzotti, Giroud, Kurzan and Mantica2007). Current density and $q$-profile are plotted in figure 3(c). For this set of plasma parameters, $q^*=3.05$ and the equilibrium calculations using TEQ in TRANSP give $q_{95}\approx 3.4$, which self-consistently accounts for the edge bootstrap current. The Hager model (Hager & Chang Reference Hager and Chang2016) estimates that the total bootstrap current fraction in this plasma is $f_B\approx 0.12$.
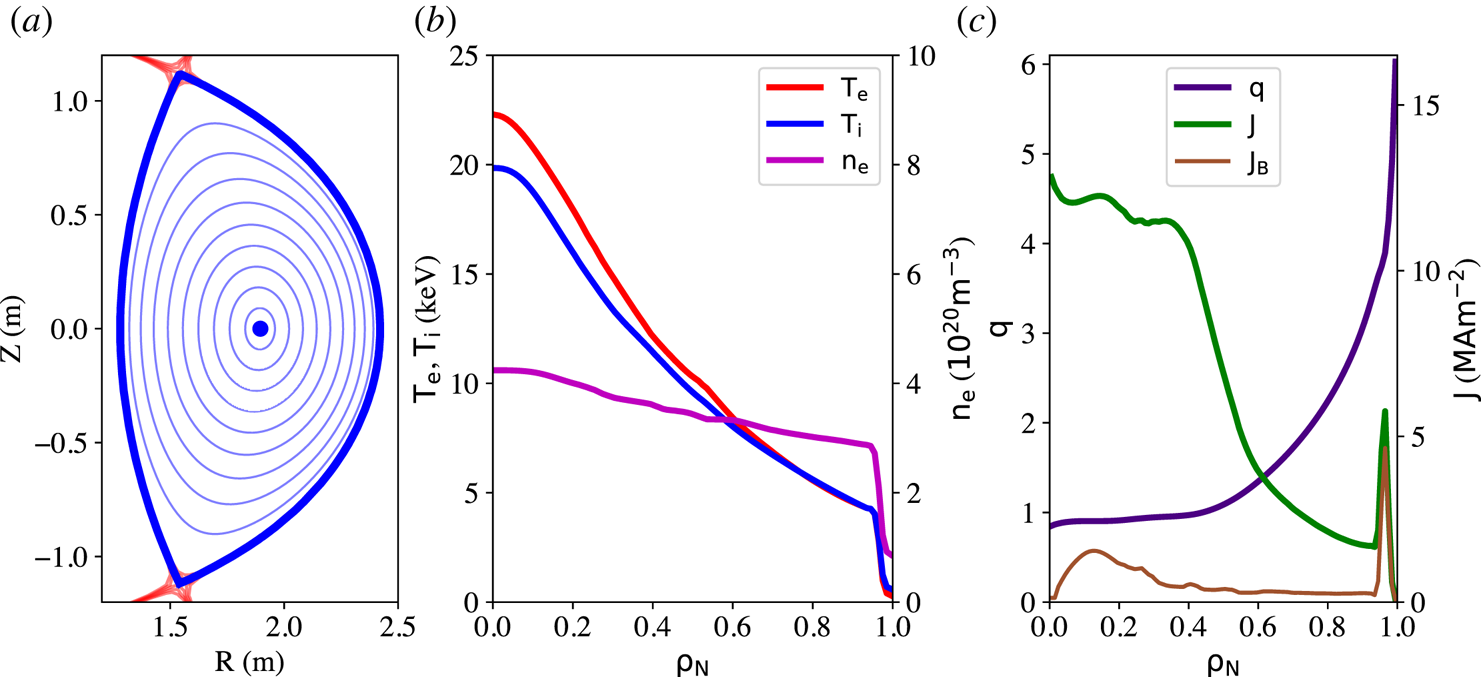
Figure 3. (a) LCFS used as input to TRANSP simulations and internal flux surfaces as calculated by the fixed-boundary TEQ solver. (b) Electron and ion temperature and electron density profiles at the top of the last simulated sawtooth crash. (c)  $q$-profile, flux surface averaged total toroidal current density and the contribution from bootstrap current.
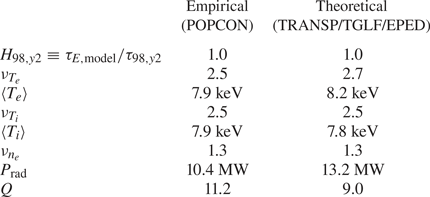
Table 3 indicates the differences in confinement, peaking factors, volume average temperatures and total predicted radiation for the two workflows. As a consequence of the different profile shapes and lower volume-averaged ion temperature predicted, fusion gain in TRANSP is lower than that estimated by the POPCON analysis ( $Q=9.0$ in TRANSP vs. $Q=11.2$ in POPCON). To compare POPCON and TRANSP results, density and ICRF input power were kept constant. Although the TRANSP simulations results feature a total power into the plasma above the L–H threshold estimated at the H-mode density, $P_{\textrm {in}}/P_{\textrm {thr}}\sim 1.14$, the net power loss (subtracting radiation) is somewhat below, $P_{\textrm {net}}/P_{\textrm {thr}}\sim 0.70$. This is a consequence of the lower fusion power predicted with TRANSP compared to POPCON, and the higher radiated losses. As described in Hughes et al. (Reference Hughes, Howard, Rodriguez-Fernandez, Creely, Kuang, Snyder, Wilks, Sweeney and Greenwald2020), there is no validated projection for the H-L back-transition, and hysteresis has been observed throughout many machines (e.g. see Hughes et al. (Reference Hughes, Loarte, Reinke, Terry, Brunner, Greenwald, Hubbard, LaBombard, Lipschultz and Ma2011) on Alcator C-Mod experiments). It is out of the scope of this paper to perform theory-based optimization of density and input power, but because the operational density for this set of SPARC parameters is not limited by plasma physics but by a maximum fusion power (see the discussion in § 2), it is expected that a slightly different operational point in TRANSP could recover $P_{\textrm {net}}/P_{\textrm {thr}}\geq 1.0$ while still maintaining high fusion gain. Notwithstanding, these predictions are in remarkable agreement, given that the two predictive workflows are completely independent and very different from one another. Empirical predictions employ scaling laws obtained from past and present experiments, whereas theory-based models do not use any empirical information. This provides high confidence that, from the core plasma perspective, SPARC will accomplish its $Q>2$ performance mission comfortably.
Table 3. Comparison of plasma performance metrics between empirical POPCON projections and theoretical TRANSP predictions with EPED and TGLF models.
3.3 Heating physics
As described in previous sections, SPARC will utilize D–T( ${}^{3}\textrm {He}$) ICRF minority heating at $120\ \textrm {MHz}$ for its full-performance DT discharges. This ICRF scheme is used for on-axis heating of both ${}^{3}\textrm {He}$ (fundamental resonance) and T (second harmonic resonance at the same position). Figure 4(a) shows the power absorbed by different species, demonstrating that only a small fraction of the launched power reaches the high-field side of the machine. Most ( $80\,\%$) of the ICRF power is damped by the fast ${}^{3}\textrm {He}$ minority population, which has a fundamental resonance near-axis (red vertical line in figure 4a). Here $3\,\%$ of the power is damped by the tritium (second harmonic resonance), and $16\,\%$ is Landau-damped by the electrons over a much broader portion of the plasma, but mostly on the low-field side.

Figure 4. (a) Absorbed ICRF power density by different species as a function of major radius (absorption by  ${}^{3}\textrm {He}$ has been divided by $5$ for visualization purposes). (b) Total, ICRF and alpha power to electrons and bulk ions. Deposited power has been integrated inside each flux surface and differentiated with respect to the $\rho _{N}$ spatial coordinate, to illustrate more clearly where the power is actually being absorbed. The integral below the curve gives the total deposited power.
Figure 4(b) depicts the power absorbed by the bulk ion and electron species from both ICRF and fusion alphas after slowing down, plotted in such a way that the area below the curve represents the total deposited power. The D–T( ${}^{3}\textrm {He}$) ICRF minority heating scheme with $5\,\%$ ${}^{3}\textrm {He}$ used in SPARC turns out to be very efficient in heating the ion species. In global terms, $78\,\%$ of the ICRF power is utilized to heat up the ions, with a good spatial localization on axis. Of this power, $94\,\%$ comes from ${}^{3}\textrm {He}$ minority slowing down, leaving only $6\,\%$ absorbed directly by the D and T ions. The electrons absorb the remaining $23\,\%$ of the power, mostly through direct Landau damping ( $70\,\%$ of the electron absorbed power), receiving only a modest contribution from the slowing down of minorities.
In terms of fusion power, the absorbed alpha power profile is broader and  $77\,\%$ of the total power is used to heat the electrons because of the high energy of fusion alpha particles at birth, $3.5\ \textrm {MeV}$. The simulations of alpha slowing-down and collisional heating of background plasma in TRANSP with NUBEAM (Pankin et al. Reference Pankin, McCune, Andre, Bateman and Kritz2004) ignores anomalous radial transport mechanisms (such as ripple or Alvén eigenmodes) and collisional coupling between fast ion populations of different species. Future work will address changes in the radial profile of the alpha deposited power, but it is expected that, given the high heat transport stiffness, temperature predictions will not change significantly.
3.4 Transport physics
The use of the TGLF quasilinear model to predict core turbulent transport allows us to take a look at the expected turbulence regimes in SPARC. In the simulations used in this work, the set of linear gyro-fluid equations is solved with a wavenumber grid from  $k_\theta \rho _s=0.05$ up to $k_\theta \rho _s=20.0$, thus including both ion and electron scales simultaneously. The TGLF saturation rule based on zonal flow mixing, SAT1 (Staebler et al. Reference Staebler, Candy, Howard and Holland2016, Reference Staebler, Howard, Candy and Holland2017), is used, which includes cross-scale coupling identified in high-fidelity realistic-mass multi-scale nonlinear gyro-kinetic simulations (Howard et al. Reference Howard, Holland, White, Greenwald and Candy2015).
Figure 5(a) shows the linear growth rate spectra of the most unstable modes at all simulated radial positions for the SPARC baseline plasma (profiles at the top of a sawtooth). Gyro-fluid turbulence in SPARC appears to be dominated by ion-scale modes propagating in the ion diamagnetic direction, i.e. ion temperature gradient (ITG) modes, with some electron-scale activity in the outer part of the plasma core. Recent work (Howard et al. Reference Howard, Holland, White, Greenwald, Candy and Creely2016; Creely et al. Reference Creely, Rodriguez-Fernandez, Conway, Freethy, Howard and White2019) has suggested that multi-scale effects may play a strong role in the prediction of turbulent transport only if  $(\gamma /k)_{\textrm {high}\text {-}k}>(\gamma /k)_{\textrm {low}\text {-}k}$, which is a condition not met at most radii in SPARC under the modelling assumptions used in this analysis.

Figure 5. (a) Most unstable linear growth rate from TGLF (normalized to wavenumber  $k_{\theta }\rho _s$) as a function of normalized radius and wavenumber spectrum. Positive and negative growth rates indicate modes propagating in the electron and ion diamagnetic directions, respectively. (b) Electron and ion total conducted powers, and radiated and collisional exchange powers inside each flux surface.
Somewhat surprisingly, electron heat flux is, on average, one third of the ion heat flux, as shown in figure 5(b), even though 77 % of the alpha power (16.6 MW), 23 % of the ICRF power (2.6 MW) and 1.3 MW of ohmic power are deposited in the electron channel, resulting in  $60\,\%$ of the total heating going to the electrons. This is a consequence of the impurity assumption and radiation model accounting for coronal equilibrium of all charge states used in this work, which predicts that 39 % of the total power is radiated inside the LCFS (13.2 MW). This significant radiated power fraction can be beneficial for divertor power handling (Kuang et al. Reference Kuang, Ballinger, Brunner, Canik, Creely, Gray, Greenwald, Hughes, Irby and LaBombard2020). Line radiation from W contributes to 46 % of the total radiated power, and comes predominantly from the plasma edge. Radiation becomes the dominant heat exhaust mechanism for the electrons. This, along with a non-negligible heat exchange power from electrons to ions (as shown in figure 5b) leads to a total electron conducted power through the LCFS of only 4.6 MW. Different assumptions of impurity content do indeed change the ratio of conducted vs. radiated power, but due to the high stiffness of heat turbulent transport, temperature profiles do not change significantly when the fraction of conducted to radiated power changes. Recent work (Ryter et al. Reference Ryter, Orte, Kurzan, McDermott, Tardini, Viezzer, Bernert and Fischer2014; Schmidtmayr et al. Reference Schmidtmayr, Hughes, Ryter, Wolfrum, Cao, Creely, Howard, Hubbard, Lin and Reinke2018) has emphasized the important role of the edge ion heat flux on the L–H transition, which may be favourable for SPARC, given the large ion to electron heat flux ratio predicted in these simulations.
As described in earlier sections, pedestal pressure is predicted with the EPED model. As shown in figure 6(a), the EPED model indicates that the pedestal is limited by peeling modes and the strong shaping suggests a wide range of operation with a favourable density scaling, given that the ballooning boundary is far from nominal parameters (in part due to the low Greenwald fraction,  $f_{G}=0.37$). Further examination of SPARC pedestal predictions and confinement mode transitions is presented in Hughes et al. (Reference Hughes, Howard, Rodriguez-Fernandez, Creely, Kuang, Snyder, Wilks, Sweeney and Greenwald2020). As discussed earlier, pedestal density is treated in this work as an input, and it is assumed to be achievable in H-mode operation. The low normalized densities in SPARC could make the fuelling issue less of a problem than in low-field machines that require operation near the Greenwald limit to achieve high performance. However, we recognize that fuelling could be an issue and the SPARC design team is planning accordingly. While the fuelling systems for SPARC are not fully specified yet at the time of writing this paper, it may possibly involve both a mix of gas fuelling and high-field-side pellet injection, which can help mitigate the fuelling risk. Future integrated modelling work will examine the sensitivity of the global performance projections to deviations from target densities.

Figure 6. Pressure at pedestal top for a scan of (a) pedestal density with  $\beta _{N}=1.05$ and (b) global $\beta _{N}$ with $n_{e,\textrm {ped}}=3.0\times 10^{20} \ \textrm {m}^{-3}$. (c) Fusion gain (crosses) and predicted $H$-factor (diamonds) corresponding to simulations with temperature pedestal degraded from EPED predictions. (d) Temperature profiles corresponding to each case.
The effect of global  $\beta _{N}$ in the EPED results has been studied, to build confidence that TRANSP simulations can be run without accounting for this feedback. Figure 6(b) demonstrates that the EPED prediction is not affected significantly in the range of operation of SPARC, $\beta _{N}=1.0\text {--}1.3$. Given the scatter in the data for $P_{\textrm {top}}(\beta _{N})$, convergence of the transport model would be difficult if EPED is used during the Newton iterations of the transport solver. To be conservative, elongation and triangularity used in EPED for the calculation of pedestal width and pressure are adjusted to the $99.5\,\%$ normalized poloidal flux surface as calculated with TEQ, rather than taking separatrix values.
When designing a new tokamak such as SPARC, it is important to account for alternative high-performance operational regimes such as Enhanced D-Alpha (EDA) H-modes, which were typically accessed in Alcator C-Mod at high density and are characterized by the lack of ELMs (Hughes et al. Reference Hughes, Snyder, Reinke, LaBombard, Mordijck, Scott, Tolman, Baek, Golfinopoulos and Granetz2018), and I-modes (Hughes et al. Reference Hughes, Snyder, Walk, Davis, Diallo, LaBombard, Baek, Churchill, Greenwald and Groebner2013). In practice, operation with ELM-suppressed H-modes generally means that the pedestal pressure is being regulated at a level somewhat below the peeling–ballooning boundary. Assuming that nominal density pedestal can still be attained, a scan of pedestal temperature has been performed. Figure 6(c) shows that, provided H-mode operation can be sustained at the same auxiliary input power,  $Q>2$ can still be achieved with nominal parameters with H-modes operating at $50\,\%$ from the peeling-ballooning stability pressure limit (which results in $H_{98,y2}\equiv \tau _{E,\textrm {model}}/\tau _{98,y2}=0.75$, consistent with the POPCON). Figure 6(d) illustrates the importance of pedestal prediction in the evaluation of performance, as core ion temperature gradient scale lengths are virtually unchanged, which is a consequence of the high heat transport stiffness of ITG modes as predicted with the TGLF model. This analysis not only confirms the possibility of reaching $Q>2$ in operational regimes with pedestals regulated below the peeling–ballooning boundary, but it also mitigates risks related to uncertainties in pedestal predictions, such as in cases where pedestals are degraded as a consequence of high gas puffing (e.g. see Maggi et al. (Reference Maggi, Saarelma, Casson, Challis, de la Luna, Frassinetti, Giroud, Joffrin, Simpson and Beurskens2015) for experience in JET-ILW) that may be needed to reach target densities.
3.5 Time-dependent dynamics
TRANSP is a flexible tool that not only evaluates the performance of tokamak scenarios, but also provides insights in time-dependent dynamics. Here, we investigate the plasma evolution to steady state during the current flat top. The L–H transition is assumed to happen at the very beginning of the flat-top, but convergence issues required us to use GLF23 to predict core temperature and density evolution during the transition. The analysis presented next ignores the possible plasma trajectory needed to access (and subsequently sustain) the H-mode, which may require higher auxiliary power than assumed here,  $P_{\textrm {ICRF}}=11\ \mathrm {MW}$, for some early portion of the current flat-top. Such simulations and trajectory optimization will be addressed in future work.
The simulation results presented in previous sections assumed that main fusion fuel ion dilution was  $n_{\textrm {DT}}/n_e=0.85$, and that the remaining ion content comes from impurities, ICRF minorities and fast ${}^{4}\textrm {He}$ alphas. They thus ignored the accumulation in time of thermal ${}^{4}\textrm {He}$ ash, which may have an effect on performance via dilution of fusion fuel ions. In the following simulations, diffusion and convection particle coefficients for thermal ${}^{4}\textrm {He}$ are calculated using standalone NEO (Belli & Candy Reference Belli and Candy2008) and TGLF models at a single time slice, but kept constant throughout the simulations. Because details on recycling and scrape-off layer transport are required to truly evaluate core ${}^{4}\textrm {He}$ accumulation and are out of the scope of this paper, the particle flux at the LCFS is adjusted so that the ${}^{4}\textrm {He}$ effective particle confinement time is equal to ${\sim }4$ times the energy confinement time, which is within estimates for ${}^{4}\textrm {He}$ ash transport in ELMy H-modes (Ishida & Team Reference Ishida1999). The effect of ELMs on time-dependent core performance will be explored in future work.
Figure 7(a) depicts the time traces of core electron and ion temperatures, clearly showing the effect of the sawtooth crashes, which occur with an inversion radius covering a significant portion of the plasma core ( $r/a\sim 0.5$) with a period of $\tau _{\textrm {saw}}\approx 1\ \textrm {s}$. The effect on fusion power and fusion gain is also observed in figure 7(a), indicating a variation of about ${\sim }10\,\%$ during a sawtooth period. In between sawtooth crashes, the confinement time is very close to the empirical predictions, revealing that the $H$-factor remains $H_{98,y2}\equiv \tau _{E,\textrm {model}}/\tau _{98,y2}=1.0\text {--}1.1$, which is within one standard deviation of the empirical scaling law.

Figure 7. Time evolution of SPARC standard baseline discharge. (a) Central temperatures and density and volume-averaged density, (b) total fusion power and fusion gain  $Q$, (c) $H_{98,y2}$ factor and ${}^{4}\textrm {He}$ volume-averaged concentration, and (d) terms in the Porcelli model for sawtooth triggering. The blue shaded area indicates initial plasma evolution following the L–H transition simulated with the GLF23 model.
As depicted in figure 7(c), the total amount of  ${}^{4}\textrm {He}$ becomes stationary by the end of the current flat-top (even when ignoring the accumulation during the GLF23 simulation phase), reaching a volume-averaged concentration of ${\sim }1.5\,\%$ with respect to the electron density. The dilution of main fuel ions, which starts with the POPCON assumption of $n_{\textrm {DT}}/n_e\sim 0.85$, ends up with $n_{\textrm {DT}}/n_e\sim 0.82$. However, we must point out that the effective ion charge $Z_\mathrm {eff}$ was assumed to be constant throughout the time-dependent simulation and therefore the effect of ${}^{4}\textrm {He}$ ash accumulation on main fuel ions dilution is optimistic. Nevertheless, the correction is expected to be small.
Figure 7(d) shows the two terms in the Porcelli model that dominate the sawtooth triggering in SPARC. When the normalized plasma core potential energy functional  $\delta \hat {W}_c$ becomes negative, the internal kink is expected to be unstable. The stabilizing effect of fast trapped ions is accounted for by allowing $\delta \hat {W}_c$ to become negative, as long as the magnetic perturbation time ( ${\sim }\tau _A|\delta \hat {W}_c|^{-1}$, where $\tau _A$ is the Alfvén time) is longer than the time for fast particles to perform precessional drift orbits ( ${\sim }\omega _{\textrm {Dh}}^{-1}$, where $\omega _{\textrm {Dh}}$ is the fast ion precession frequency). A constant value of the multiplicative factor $c_h=0.4$ is assumed, following recommendations in Porcelli et al. (Reference Porcelli, Boucher and Rosenbluth1996). The rest of the sawtooth triggering conditions, related to microscopic effects near the $q=1$ surface, do not seem to play an important role in this SPARC reference plasma and are never satisfied. We acknowledge that the prediction of sawtooth period and dynamics is highly uncertain, and the Porcelli model implemented in this work depends on numerous free parameters. The results of sawtooth dynamics presented here should only be taken as rough estimates; the model was implemented for the primary goal of preventing unrealistic on-axis current peaking while still solving poloidal field diffusion and Grad–Shafranov equations self-consistently. Future work will investigate the effect of model parameters on the predicted sawtooth period, and will explore sawtooth physics in more detail.
Figure 8(a) depicts the density profiles at the end of the simulation. It is observed that  ${}^{4}\textrm {He}$ ash has a peaked profile on-axis at the top of the sawtooth crash. Consequently, both DT fusion ions ( $n_D=n_{T}$ is assumed at all times) and impurities exhibit a hollowed profile, which is due to quasineutrality and the assumption of uniform and constant $Z_{\textrm {eff}}$ throughout this simulation. Nevertheless, such a deficit of fusion fuel ions at the plasma centre where the temperature is the highest (but the volume is small) does not result in a strong decrease in fusion gain, which remains within ${\sim }10\,\%$ from the nominal performance at the beginning of the simulation without ash accumulation. Figure 8(b) shows the distribution of charge states for W and the lumped impurity ( $Z=9$) in coronal equilibrium. The low- $Z$ lumped impurity is fully stripped throughout the plasma core. Tungsten exhibits a volume-averaged charge of $Z_{\textrm {ave}}\approx +51$, but charge states as high as W $^{67+}$ are found in the plasma centre with a density ${>}10^{14}\ \textrm {m}^{-3}$.

Figure 8. (a) Electron, DT ions, impurities and  ${}^{4}\textrm {He}$ ash density profiles before the last sawtooth crash from the simulation in figure 7. Distribution of charge states (colours) and total density (black) for the two impurities considered in this work: (b) W and (c) low- $Z$ (
$Z$ ( $Z=9$) lumped impurity.
4 Gyro-kinetic predictions in SPARC
The integrated modelling work presented in this paper employed the TGLF model for turbulent transport, which has been extensively validated and is currently used worldwide to study and predict tokamak turbulence. However, TGLF makes a number of approximations in order to calculate turbulent transport fluxes efficiently enough to be implemented in integrated solvers, which often require thousands of calls to the transport model. The goal of this section is to check the validity of the TGLF approximations against fully nonlinear gyro-kinetic simulations in the SPARC operational space, in order to make sure that predicted temperature and density profiles used in TRANSP are within reasonable agreement.
First, TGLF constructs a gyro-fluid set of equations as a proxy for gyro-kinetic turbulence (Staebler, Kinsey & Waltz Reference Staebler, Kinsey and Waltz2005), retaining some kinetic effects by fitting the closure coefficients to the exact kinetic response. Second, a saturation rule converts linear turbulence features (wavenumbers, growth rates and real frequencies) into saturated levels of potential fluctuations (Staebler et al. Reference Staebler, Kinsey and Waltz2007). The eigenmode solution of the linear set of gyro-fluid equations along with the saturated level of potential fluctuations are then used to calculate heat and particle fluxes through a quasilinear formulation. Because the equations solved in TGLF do not contain, in principle, information about the truly nonlinear effects that govern turbulence dynamics, the saturation rule in TGLF is constructed from a database of nonlinear (and some multi-scale Staebler et al. (Reference Staebler, Candy, Howard and Holland2016)) gyro-kinetic simulations.
While no experimental information is used in the construction of the TGLF model, it is important to verify its validity in the range of operation of SPARC. To this end, a set of multi-scale linear and ion-scale nonlinear gyro-kinetic simulations with the CGYRO code (Candy, Belli & Bravenec Reference Candy, Belli and Bravenec2016) are performed using the kinetic profiles predicted by TGLF at the end of the simulation presented in figure 7. Each simulation accounted for electromagnetic turbulence ( $\delta \phi$ and $\delta A_{||}$), captured collisions using the Sugama collision operator and included six gyro-kinetic species: deuterium, tritium, a lumped low- $Z$ impurity ( $Z=9, A=18$), tungsten ( $Z=50, A=192$), fast ${}^{3}\textrm {He}$ and electrons. Nonlinear simulation box sizes and resolutions slightly varied depending on the radial location, with simulations typically using ${\sim }77 \times 64 \rho _s$ box sizes with approximately 300 radial modes and 16 toroidal modes spanning up to $k_\theta \rho _s = 1.4$. It is important to note that the CGYRO linear and nonlinear simulations were not run in an identical manner to those performed with TGLF. While the CGYRO simulations include electromagnetic effects and six species, the implementation of TGLF in TRANSP groups the main ions and impurities in order to reduce computation time and does not include electromagnetic effects or fast particles. These differences are expected to play a small role but we acknowledge that some of the reported discrepancies may arise from the slight differences in the simulations.
4.1 Linear simulations
Figure 9 presents a comparison between the linear growth rate ( $\gamma$) and real frequency ( $\omega$) as predicted by the gyro-fluid TGLF model in TRANSP and the fully gyro-kinetic CGYRO simulations. Both electrostatic (ES) and electromagnetic (EM) CGYRO simulations have been performed. TGLF runs inside TRANSP had to be electrostatic to avoid convergence problems when EM effects were enabled. Interestingly, CGYRO predicts the presence of two clearly separated dominant branches: ITG at long wavelengths and electron temperature gradient (ETG) at short wavelengths. TGLF matches very well the linear growth rate and real frequency of the ITG branch, whereas only moderate agreement is found for the ETG portion of the spectrum, which gets worse in inner plasma regions. However, the most pronounced discrepancy between the turbulence models is that TGLF predicts the existence of an intermediate- $k$ trapped electron mode (TEM) branch that is stable in CGYRO simulations, which is probably a consequence of the different treatment of collisions in the models.

Figure 9. (a,c,e) Linear growth rates and (b,d,f) real frequency spectra at (a,b)  $\rho _{N}=0.4$, (c,d) $\rho _{N}=0.6$ and (e,f) $\rho _{N}=0.8$. Comparison between TGLF as run inside TRANSP and standalone electromagnetic and electrostatic linear simulations with CGYRO.
The primary observation from this linear analysis is that the gyro-fluid approximation in TGLF does a reasonable job at matching ES CGYRO at low- $k$ (
$k$ ( $k_\theta \rho _s<0.8$), whereas at high- $k$ (
$k$ ( $k_\theta \rho _s>0.8$) TGLF tends to over-predict linear growth rates.
4.2 Nonlinear simulations
As explained in § 3.4, linear growth rate analysis suggests that ion-scale simulations are enough for the prediction of the nonlinear saturation of turbulence and resulting transport fluxes (since  $(\gamma /k)_{\textrm {high}\text {-}k}<(\gamma /k)_{\textrm {low}\text {-}k}$). Motivated by this observation and limited by computational resources, ion-scale ( $k_\theta \rho _s\leq 1.4$) nonlinear CGYRO simulations have been performed at selected radial locations ( $\rho_{N} = 0.4, 0.6, 0.8$), including a scan of the driving gradient for ITG, $a/L_{T_i}$. These ion-scale simulations were performed with relatively high physics fidelity, as described at the beginning of this section.
Figure 10 compares the electron and ion heat fluxes and the electron particle flux from TGLF and nonlinear CGYRO. Around mid-radius ( $\rho _{N}=0.6$), CGYRO only needed an increase of less than $5\,\%$ from the nominal $a/L_{T_i}$ to match both ion and electron heat flux. At this position, the plasma sits right at the critical gradient and TGLF correctly predicts the ITG threshold. However, at $\rho _{N}=0.8$, TGLF under-predicts turbulent heat flux significantly relative to CGYRO. A reduction of ${\sim }35\,\%$ in temperature gradient is required to match power balance levels, revealing that TGLF is probably over-predicting the gradient at the edge of the plasma. In contrast, at $\rho _{N}=0.4$, TGLF was over-predicting transport, and profile predictions with nonlinear CGYRO would probably yield higher central temperature gradient.

Figure 10. (a) Ion heat flux, (b) electron heat flux and (c) electron particle flux at  $\rho _{N}=0.4$, $0.6$ and $0.8$ as predicted with TRANSP/TGLF (in red) and with standalone ion-scale nonlinear CGYRO simulations, including scans of $a/L_{T_i}$ (in blue to purple). Particle flux is plotted using a bi-symmetric logarithmic scale for values with absolute magnitude greater than $10^{-1}$ and linear scale otherwise.
The linear growth rate analysis with EM CGYRO in figure 9 indicated the existence of linearly unstable micro-tearing modes (MTMs) at low- $k$. Initial investigations comparing electromagnetic and electrostatic nonlinear simulations at $\rho _{N}=0.6$ indicate nearly identical ion heat flux and small differences in electron heat flux. Although this is consistent with other gyro-kinetic studies that have shown that the presence of MTMs in an ITG background may not cause significant transport even in cases with comparable growth rates (e.g. Doerk et al. Reference Doerk, Dunne, Jenko, Ryter, Schneider and Wolfrum2015; Holland, Howard & Grierson Reference Holland, Howard and Grierson2017), a more complete assessment of the role of electromagnetic turbulence in SPARC will be the subject of future work.
Figure 11(a) depicts the flux-surface-averaged inverse normalized ion temperature gradient scale length ( $a/L_{T_i} = -a/T_i\cdot \partial T_i/\partial \rho _{N}\boldsymbol {\cdot }\langle |\boldsymbol {\nabla }\rho _{N}|\rangle$) profile from TRANSP/TGLF and the corresponding gradients from the ion heat flux matched nonlinear CGYRO simulations at three radial positions. A Gaussian process (GP) fit is also plotted (mean of posterior distribution and 2- $\sigma$ confidence bounds). Figure 11(b) shows the ion temperature profile that results from integrating the fitted gradients from a boundary condition at $\rho _{N}=0.8$ up to the magnetic axis. The posterior distribution of the GP has been sampled 1000 times, and each gradient profile has been integrated inwards to obtain a distribution of temperature profiles (for which we plot also the mean and 2- $\sigma$ confidence bounds).

Figure 11. (a) Inverse normalized ion temperature gradient scale length from TRANSP/TGLF and ion heat flux matched nonlinear CGYRO simulations. A Gaussian process fit is also depicted (mean of the posterior distribution in solid lines and 2- $\sigma$ confidence bounds as the shaded region). (b) Comparison between the TRANSP/TGLF ion temperature profile and the prediction from CGYRO. CGYRO profile predictions inside $\rho _{N}<0.4$ are not constrained by simulation data, but plotted anyway for visualization of possible profiles as constrained by the GP model and a zero gradient on-axis.
It is important to note that the flux-matched gradients and temperature profile from CGYRO have been obtained by making two assumptions: (i) ion heat transport is a function of  $a/L_{T_i}$ only, and (ii) power balance ion heat flux remains unchanged. For a self-consistent profile prediction, one would have to vary core parameters as the profiles are integrated from the edge to the core, evaluate the transport fluxes with updated plasma parameters (such as $T_i/T_e$, $\nu _{ei}$, $a/L_n$ and $a/L_{T_e}$) and iterate again by matching power balance fluxes, which will also be different due to changes in fusion rates (thus changing alpha heating) and collisional exchange between ions and electrons. However, in the region where predictions from CGYRO are relevant ( $\rho _{N}=0.4\text {--}0.8$), the resulting temperature profile is close enough to the TGLF prediction that one would expect changes in plasma parameters not to play a dominant role in this exercise.
Nonetheless, with these standalone simulations alone it is difficult to assess to what degree TGLF predictions of SPARC performance really differ from CGYRO. While the reduction of gradients at the plasma edge would lead to an overall decrease of performance, the higher central gradients (where most fusion reactions happen) may lead to an overall balance, as is implied in figure 11. Furthermore, the predicted inward particle flux (figure 10c) at  $\rho _{N}=0.6$ and $\rho _{N}=0.8$ suggests that TGLF is under-predicting density peaking, which is an important parameter to determine fusion power. Given the dominance of electrostatic ITG modes in this reference SPARC plasma, and the expected lack of high- $k$ and multi-scale turbulence effects, SPARC is an ideal candidate for fully nonlinear profile predictions with CGYRO, which is left for future work.
5 Conclusions
This paper has presented integrated modelling simulations with high-fidelity physics models that confirm the 0-D empirical results of the current SPARC design: the  $Q>2$ mission is amply satisfied, with enough margin for extensive exploration of burning plasma physics regimes ( $Q>5$). Empirical scalings and integrated simulations provide very similar performance projections for the nominal full-field, DT, H-mode plasma in SPARC. From the core plasma performance perspective, no obstacle has been identified that could jeopardize the success of the SPARC programme. Although not discussed here, Creely et al. (Reference Creely, Greenwald, Ballinger, Brunner, Canik, Doody, Garnier, Granetz, Holland and Howard2020) presents a comparison of the proposed SPARC DT H-mode plasma with JET discharges that are a close match of dimensionless parameters such as $q_{95}$, $\beta _{N}$, $n/n_{G}$, $\nu ^*$ and (although somewhat smaller in SPARC) $\rho ^*$. In addition, energy confinement time is within the ranges of the H-mode database. This suggests that SPARC will probably not operate in an unexplored plasma physics regime, and builds confidence that both the empirical projections and the theory-based predictions are reliable.
Comprehensive models for different physics have been used in integrated simulations with the TRANSP framework (Breslau et al. Reference Breslau, Gorelenkova, Poli, Sachdev and Yuan2018), and conservative assumptions have been maintained throughout this analysis. The effects of rotation shear, electromagnetic stabilization and isotopic content are not accounted for in the turbulent transport simulations with the TGLF model. These effects are expected to improve performance, although detailed analysis still needs to assess to what degree. Furthermore, a monotonic  $q$-profile has been used, and hence no favourable effect of reversed shear in advanced scenarios was considered. ICRF tail temperatures of tritium were not taken into account, which could also benefit performance by contributing to the fusion rate. An impurity mix assumption considering both low- and high- $Z$ impurities, and coronal equilibrium was considered, yielding moderately high levels of radiated power. The effect of transport on impurity density profiles and the deviation from coronal equilibrium will be addressed in future work. For the design of SPARC, safety factor ( $q^*=3.05$, $q_{95}=3.4$), normalized density ( $f_{G}=0.37$) and normalized pressure ( $\beta _{N}=1.0$) are all at reasonably safe levels of operation. Aspects related to disruptions and magnetohydrodynamic stability, including discussion about neoclassical tearing modes and the effect of high magnetic field on stability, are discussed in detail in Sweeney et al. (Reference Sweeney, Creely, Doody, Fülöp, Garnier, Granetz, Greenwald, Hesslow, Irby and Izzo2020). With all these considerations, physics-based models indicate that the current version of the SPARC design with nominal parameters will generate $P_{\textrm {fus}}\approx 100\ \textrm {MW}$ of fusion power, with a gain of $Q\approx 9.0$.
Linear and nonlinear turbulence simulations with the CGYRO (Candy et al. Reference Candy, Belli and Bravenec2016) code have also been presented. Although clear differences are found in predicted transport levels, TGLF may still provide a reasonably good prediction of overall performance, thanks to a balance between edge and core deviations in heat transport and a more peaked density profile. Profile predictions with nonlinear CGYRO simulations are expected for future work.
Looking ahead to the design and construction of pilot fusion power plants, such as those based on the ARC design (Sorbom et al. Reference Sorbom, Ball, Palmer, Mangiarotti, Sierchio, Bonoli, Kasten, Sutherland, Barnard and Haakonsen2015; Kuang et al. Reference Kuang, Cao, Creely, Dennett, Hecla, LaBombard, Tinguely, Tolman, Hoffman and Major2018), SPARC will provide important insights into the physics of burning plasmas and high-field tokamaks, and the predictive workflow developed here will be validated. In particular, SPARC data will be crucial for validating existing and emerging models in the burning plasma regime. As one of the missions of the programme, SPARC is designed to provide as much knowledge as possible on the engineering and plasma physics relevant for a pilot plant. The large margin with respect to its performance goal ( $Q=9\text {--}11$ predicted vs. $Q>2$ mission) will allow detailed study of burning plasmas and alpha physics and transport.
In conclusion, this integrated modelling work and turbulence analysis implies that SPARC will be truly capable of achieving its core plasma mission and will provide the physics basis for the high-field pathway for fusion energy.
Acknowledgements
The authors appreciate discussions and thank G.M. Staebler for developing and maintaining TGLF, P.B. Snyder for EPED and J. Candy and E.A. Belli for CGYRO. We thank F. Poli for discussions on TRANSP physics, J. Sachdev for his work on the implementation of the transport solver and the TRANSP team for their support with the runs, which were performed using TRANSP version v20.1 with TGLF from GACODE master version as of 23 May 2019. Part of the data analysis was performed using the OMFIT framework (Meneghini et al. Reference Meneghini, Smith, Lao, Izacard, Ren, Park, Candy, Wang, Luna and Izzo2015). We also acknowledge insightful discussions with the entire SPARC Physics Basis group and the excellent work of the broader SPARC team in moving forward this inspiring project. This work was funded by Commonwealth Fusion Systems under RPP005. C. Holland was supported by the US Department of Energy, Office of Science, Office of Fusion Energy Sciences, under Award No. DE-SC0018287. This research used resources of the National Energy Research Scientific Computing Center (NERSC), a US Department of Energy Office of Science User Facility operated under Contract No. DE-AC02-05CH11231.
Editor William Dorland thanks the referees for their advice in evaluating this article.
Declaration of interests
The authors report no conflict of interest.


 Open access