


Over the past two decades, more older adults are carrying more debt into retirement than in prior generations (Moulton et al., Reference Moulton, Haurin and Loibl2019; Brown et al., Reference Brown, Dynan and Figinski2020a, Reference Brown, Lee, Scally and van der Klaauw2020b; Collins et al., Reference Collins, Hembre and Urban2020; Lusardi et al., Reference Lusardi, Mitchell and Oggero2020a). This may not necessarily be a cause for concern, since household debt levels are not good or bad as long as borrowers are effectively managing cash flows and balance sheets. However, recent studies indicate significant heterogeneity in the types and amounts of debt held by older adults, with financially vulnerable older adults holding higher-cost forms of debt and being more likely to experience debt-related financial distress than older adults with higher levels of income and wealth (Brown et al., Reference Brown, Dynan and Figinski2020a, Reference Brown, Lee, Scally and van der Klaauw2020b; Butrica and Karamcheva, Reference Butrica and Karamcheva2020; Loibl et al., Reference Loibl, Moulton, Haurin and Edmunds2020). Given these trends, the onset of the COVID-19 pandemic in early 2020 had the potential to exacerbate disparities in the debt experiences of older adults.
This study investigates how debt levels and credit outcomes changed among older adults during the COVID-19 pandemic. There are multiple paths through which the COVID-19 pandemic may affect the economic security of older adults. Disruptions to the economy and risk of disease spread led many older adults who were working prior to the pandemic to exit the labor market (Cheng et al., Reference Cheng, Carlin, Carroll, Gupta, Rojas and Montenovo2020; Moen et al., Reference Moen, Pedtke and Flood2020; Goda et al., Reference Goda, Jackson, Nicholas and Stith2021; Quinby et al., Reference Quinby, Rutledge and Wettstein2021), thereby reducing income from wages. Aside from labor market effects, the economic security of older adults is also a function of their interaction with credit markets, including the use of consumer debt to finance consumption.
On the one hand, studies document reduced consumption in the general population after the onset of the COVID-19 pandemic and a subsequent decline in consumer debt levels that can be attributed in part to reduced consumption (Baker et al., Reference Baker, Farrokhnia, Meyer, Pagel and Yannelis2020; Horvath et al., Reference Horvath, Kay and Wix2021). Aside from spending less in general, people may have changed their rate of paying down of outstanding debt balances. Some of the decline in debt levels, however, may be involuntary – as creditors also contracted their supply of new credit during this period (Horvath et al., Reference Horvath, Kay and Wix2021). Thus, a decline in debt alone is not necessarily a positive outcome, but requires further decomposition of its mechanisms. Further, households experiencing direct financial hardship as a result of the COVID-19 pandemic, through loss of wage income or medical distress, faced challenges in paying their bills (Schneider et al., Reference Schneider, Tufano and Lusardi2020; Clark et al., Reference Clark, Lusardi and Mitchell2021).
Some of these households were able to qualify for forbearance or payment accommodations which prevented delinquency on debt payments, but this subsequently results in an increase in their level of indebtedness. A recent study estimates that $2 trillion in consumer and mortgage debt entered forbearance between March and October 2020 (Cherry et al., Reference Cherry, Jiang, Matvos, Piskorski and Seru2021). Debt in forbearance is not forgiven and will need to be repaid later, either through lump-sum payments or by being re-amortized into the loan balance. There is increasing evidence of disparities in exits from forbearance, where lower-income and Black borrowers are less likely to catch up with payments (Gerardi et al., Reference Gerardi, Lambie-Hanson and Willen2021).
While there are studies that analyze trends in credit and debt following COVID-19 in the general population (Cherry et al., Reference Cherry, Jiang, Matvos, Piskorski and Seru2021; Horvath et al., Reference Horvath, Kay and Wix2021), this is the first study to focus explicitly on older adults. To do this, we construct a national credit panel measured quarterly from the first quarter of 2019 through the fourth quarter of 2020. The panel data includes a 1% random sample from the more than 250 million adults in the United States with complete credit records, resulting in 2.5 million adults aged 18 and older, of whom 1.2 million are aged 50 and older. Importantly, this sample includes information for all members of the household who have credit, not just the randomly selected individual. This allows us to construct household measures of debt balances. In addition to traditional credit, we supplement our credit panel with data on the use of alternative financial services (AFS) at the individual level – allowing us to measure changes in reliance and use of high-cost forms of credit.
This study uses quarterly data before and after the start of the pandemic in March 2020 to estimate changes in debt levels and other credit outcomes by age group, controlling for demographic and financial characteristics as well as for lifecycle patterns in the accumulation and repayment of debt. In addition to these overall trends, this study also presents estimates for adults aged 50 and older by income quartiles. These estimates provide insights into some key differences in trends in debt since the start of the pandemic for lower- versus higher-income people.
1. Prior literature
1.1 Consumer debt and credit among older adults
Growing debt among older households in the United States has been observed in studies as early as 2013 (Collins et al., Reference Collins, Scholz and Seshadri2013; Trawinski, Reference Trawinski2013). Recent research demonstrates an ongoing rise in debt carried into consumers' retirement years, with particularly striking increases in mortgage debt (Haurin et al., Reference Haurin, Loibl and Moulton2019; Brown et al., Reference Brown, Dynan and Figinski2020a, Reference Brown, Lee, Scally and van der Klaauw2020b; Collins et al., Reference Collins, Hembre and Urban2020; Lusardi et al., Reference Lusardi, Mitchell and Oggero2020a) and for adults aged 70 and older (Bhutta et al., Reference Bhutta, Blair, Dettling and Moore2020). But the increase is not restricted to mortgage debt, as balances held in retirement years have increased for automobile loans, student loans, and credit cards as well, even as mortgage, automobile, and credit card borrowing decreased for younger consumers (Haurin et al., Reference Haurin, Loibl and Moulton2019; Brown et al., Reference Brown, Lee, Scally and van der Klaauw2020b). Further, Brown et al. (Reference Brown, Lee, Scally and van der Klaauw2020b) demonstrate that the increase in debt held in retirement arises not merely from a slowdown of debt originated during and after the Great Recession; a substantial tilting of new mortgage and auto loan originations toward older borrowers, and away from younger borrowers, between 2003 and 2017 was equally consequential. Older Americans, then, are carrying more long-held consumer debt and more recently originated consumer debt than their predecessors managed at similar ages. Such a steep increase in debt held late in the life cycle might lead to difficulties in repayment. Yet, older borrowers reliably repay debt, even in the recent decades of rising consumer credit in retirement (Brown et al., Reference Brown, Lee, Scally and van der Klaauw2020b; Collins et al., Reference Collins, Hembre and Urban2020). Still, older borrowers have unprecedented levels of debt heading into the COVID-19 pandemic. This dynamic raises more concerns given the age-dependent health and economic risks of the COVID-19 pandemic.
A small set of studies examine the likely implications of this rising debt for the financial security of older people prior to the pandemic. Butrica and Karamcheva (Reference Butrica and Karamcheva2020) found that indebted older people are more likely to work, less likely to be retired from the labor force, and, on average, expect to work longer than those with less debt. Collins et al. (Reference Collins, Hembre and Urban2020) demonstrate that rising participation in mortgage markets among retirees is tied to a rising rate of homeownership at older ages, with its attendant financial security implications. Loibl et al. (Reference Loibl, Moulton, Haurin and Edmunds2020) describe the association between levels of debt, particularly non-housing debt, and psychological stress for older adults. Lusardi et al. (Reference Lusardi, Mitchell and Oggero2020b) establish and estimate interest rate risk, and other financial risks, affecting retired borrowers as a result of debt at older ages. Brown et al. (Reference Brown, Dynan and Figinski2020a) use near-retirement debt and other financial circumstances to project economic hardship in old age for the cohorts in the United States that were nearing retirement in the 1990s and in the 2010s; they predict a substantial increase in hardship among older men from the 1990s to the 2010s cohort. Our study builds on this prior work, providing an initial look at the consequences of the COVID-19 pandemic for the credit outcomes of older households.
1.2 COVID-19 and the financial security of older adults
There is a burgeoning body of literature on the economic consequences of the COVID-19 pandemic for households in the United States. Most directly, several studies analyze changes in labor force participation and unemployment in response to the COVID-19 pandemic (e.g., Cheng et al., Reference Cheng, Carlin, Carroll, Gupta, Rojas and Montenovo2020), with a few studies focusing on labor trends among older adults (Moen et al., Reference Moen, Pedtke and Flood2020; Goda et al., Reference Goda, Jackson, Nicholas and Stith2021; Quinby et al., Reference Quinby, Rutledge and Wettstein2021). In a study of labor force exits using data from the Consumer Population Survey (CPS), Cheng et al. (Reference Cheng, Carlin, Carroll, Gupta, Rojas and Montenovo2020) find that adults aged 61 and older were more likely to exit the labor force in March 2020 than any other age group (aged 25 and older) and were less likely to re-enter the labor market in April 2020.
Quinby et al. (Reference Quinby, Rutledge and Wettstein2021) use CPS data to compare changes in labor force exits among adults aged 55 and older 1 year prior to the pandemic to 1 year after the onset of the pandemic. They find an 8 percentage point increase in exits from the labor force among older adults following the onset of the COVID-19 pandemic. However, they observed only a 1 percentage point increase in the probability of retirement following the onset of the pandemic. In a similar analysis with CPS data, Goda et al. (Reference Goda, Jackson, Nicholas and Stith2021) also document significant increases in labor force exits following the onset of the pandemic for adults aged 50–61, with a smaller increase in exits for adults aged 62–70. In a separate analysis, they analyze changes in Social Security retirement applications between March 2020 and March 2021, finding no evidence of a significant increase. Thus, older adults who left the labor force during the COVID-19 pandemic do not appear to be offsetting the reduction in income with retirement benefits in the short term, although the implications for longer term claiming behaviors are unclear.
Reductions in income may be offset in part by reductions in consumption. While not focused on older adults, several studies document reductions in consumption and consumer spending associated with the COVID-19 pandemic in the general population (Baker et al., Reference Baker, Farrokhnia, Meyer, Pagel and Yannelis2020; Casado et al., Reference Casado, Glennon, Lane, McQuown, Rich and Weinberg2020; Chetty et al., Reference Chetty, Friedman, Hendren and Stepner2020; Farrell et al., Reference Farrell, Ganong, Greig, Liebeskind, Noel and Vavra2020; Horvath et al., Reference Horvath, Kay and Wix2021; Meyer et al., Reference Meyer, Murphy and Sullivan2022). For example, Farrell et al. (Reference Farrell, Ganong, Greig, Liebeskind, Noel and Vavra2020) find an overall 10% decline in consumer spending following the onset of the pandemic. However, the effects on consumption are heterogeneous across several dimensions. Baker et al. (Reference Baker, Farrokhnia, Meyer, Pagel and Yannelis2020) find that individuals living in areas with active shelter in place orders experienced larger reductions in consumption than individuals living in areas without such orders. Chetty et al. (Reference Chetty, Friedman, Hendren and Stepner2020) find that much of the reduction in spending is concentrated among higher-income households; households in the top income quartile spent 13% less as of mid-July 2020 relative to January 2020, whereas households in the bottom income quartile reduced consumption by only 4% during the same period. For those experiencing a COVID-related loss of income, Farrell et al. (Reference Farrell, Ganong, Greig, Liebeskind, Noel and Vavra2020) find that receipt of pandemic-related unemployment benefits is associated with a 10% increase in consumer spending relative to the prior year.
Changes in income and consumption during the COVID-19 pandemic may be associated with changes in consumer debt. Consumer debt can be an important source of liquidity to smooth consumption for individuals experiencing a loss of income (Collins et al., Reference Collins, Edwards and Schmeiser2015; Braxton et al., Reference Braxton, Herkenhoff and Phillips2020), thereby leading to an increase in debt. On the other hand, pandemic-induced reductions in spending may lead to a decrease in the accumulation of new debt and may allow for the pay down of prior debt balances. Using monthly account-level credit card data, Horvath et al. (Reference Horvath, Kay and Wix2021) find a sharp decrease in credit card balances following the onset of the pandemic, with the reduction being larger for individuals with higher credit scores. In addition to reductions in debt levels, there is some evidence for a reduction in the rate of opening new accounts following the pandemic. The Consumer Financial Protection Bureau (CFPB) (2020) found a 40% reduction in new credit card originations after the onset of the pandemic.
Reductions in credit use could be the result of supply or demand. There is some evidence in line with supply effects. Horvath et al. (Reference Horvath, Kay and Wix2021) document a 4 percentage point increase in the interest rate spread on new credit cards to borrowers with low credit scores following the onset of COVID-19, with no change in the interest rate spread for higher credit score borrowers. Also in line with supply effects, industry data indicate a 40% decrease in the aggregate credit limits on bankcards as of the fourth quarter of 2020 relative to the fourth quarter of 2019 (Equifax, 2021). These studies highlight the importance of considering not only changes in debt levels following the onset of COVID-19, but also the mechanisms underlying changes in levels. While consumer debt can be a source of liquidity to smooth consumption, required monthly payments can also be a source of financial strain – particularly following an income shock. Typically, the onset of an economic crisis such as the COVID-19 pandemic would trigger widespread consumer default on debt payments (Dettling and Lambie-Hanson, Reference Dettling and Lambie-Hanson2021). Indeed, many consumers reported difficulty paying bills following the onset of the COVID-19 pandemic (Schneider et al., Reference Schneider, Tufano and Lusardi2020; Clark et al., Reference Clark, Lusardi and Mitchell2021). However, rather than being reported as being in default on their debt payments, a large proportion of consumers were able to obtain temporary suspension of their debt payments through forbearance. Using credit panel data, Cherry et al. (Reference Cherry, Jiang, Matvos, Piskorski and Seru2021) estimate that 60 million individuals had a collective $2 trillion in debt that was in forbearance as of October 2020, including 4.6% of credit card trades, 8.8% of auto loans, 8.8% of mortgages, and 92% of student loans. They find that areas with higher unemployment rates, higher COVID-19 case counts, and a higher share of workers employed in an ‘at-risk’ industry had higher shares of the population with loans in forbearance.
While the studies described above shed some light on the trends in debt and credit for the general population during the COVID-19 pandemic, they do not focus on trends among older adults explicitly. It is quite possible that the experiences of older adults – many of whom were out of the labor force prior to the onset of the pandemic – differ from the experiences of younger adults. Further, there is likely substantial heterogeneity among groups of older adults, with some emerging from the pandemic in a significantly better financial position than before, while others emerge with higher levels of debt and increased financial burden, placing economic security at risk.
We expect the net effect of the COVID pandemic on debt levels of older adults to vary based on household income prior to the pandemic. For higher-income older adults, debt balances should remain flat, or even decrease, relative to younger adults and lower-income older adults. This is due to higher-income older adults being less reliant on more volatile sources of labor income during the pandemic (Montenovo et al., Reference Montenovo, Jiang, Rojas, Schmutte, Simon, Weinberg and Wing2021), combined with reduced consumption (Meyer et al., Reference Meyer, Murphy and Sullivan2022) that may have allowed higher-income older adults to accelerate debt repayment. For lower-income older adults, debt balances should increase relative to higher-income older adults. This is due to lower-income household's higher reliance on more volatile labor income during the pandemic (Montenovo et al., Reference Montenovo, Jiang, Rojas, Schmutte, Simon, Weinberg and Wing2021), increases in relative consumption (Parker et al., Reference Parker, Schild, Erhard and Johnson2022), and lower-income households' higher use of payment forbearance or accommodations (Cherry et al., Reference Cherry, Jiang, Matvos, Piskorski and Seru2021) which delayed debt repayment during the pandemic and would increase debt balances.
2. Data and methods
2.1 Data and sample construction
The primary data for this analysis are consumer-level credit attribute data from Experian, one of the three national credit bureaus. Experian's credit data include approximately 300 million unique consumer records at any given point in time, representing more than 90% of the population in the United States aged 18 and older (Brown et al., Reference Brown, Stein and Zafar2015). We obtain a panel level dataset consisting of a 1% random sample of consumers who were in Experian's credit data as of a given quarter, beginning with the first quarter of 2019 (Q1-2019) through the fourth quarter of 2020 (Q4-2020). The random sample is generated by including all consumers in the sample with the same last two-digits of a unique randomly generated eight-digit time-invariant consumer sequence number. This allows us to follow the same randomly selected consumers over time, and allows new consumers to enter the sample over time who also have the same last two digits of their consumer sequence number. This process is similar to that used to generate other established credit panels, such as the Federal Reserve Bank of New York's Equifax-sourced Consumer Credit Panel (CCP), see Lee and van der Klaauw (Reference Lee and van der Klaauw2010).
As of Q4-2020, the random sample includes over 3 million unique individuals. We exclude individuals with missing data for age or who do not have any trade data.Footnote 1 We also exclude individuals who are deceased as of a given quarter. Some of the outcomes for this analysis, such as debt levels, are best constructed at the household level.Footnote 2 A unique feature of our credit panel is that it includes data for all other individuals with a credit file living at the same address at the same point in time as the randomly selected individual. In our analysis sample, we have credit data for 6.73 million unique individuals in the random sample aged 18 and older used to construct household debt levels. Household level data also allow us to construct an indicator for the number of people with a credit file in the household by quarter, and track changes in the number of people with a credit file in a household over time.Footnote 3
2.2 Credit outcomes
2.2.1 Total household debt
Total household debt is constructed as the sum of all debt held by all consumers aged 18 and older with a credit file living at the same address as the randomly selected individual.Footnote 4 Debt is defined to include all trade types reported to the credit bureau, including mortgages, student loans, auto loans, other installment loans, credit cards, other revolving trades, and collections (including medical collections). The total includes debt that is current as well as debt that is delinquent or severely derogatory, debt on accounts that are open or closed, and debt that is deferred (e.g., deferred student loans or trades in payment accommodations or forbearance). To avoid double counting, we identify any trades that are jointly held and divide by two before aggregating to the household level (most common in mortgages, auto loans, and other revolving trades).Footnote 5 We also exclude from the total trades where the individual is only an authorized user (most common in credit card trades). To address outliers, we top code individual debt levels at the 99.5 percentile before aggregating.
2.2.2 Credit lines closed or cut by creditor
Creditors can restrict debt use by closing revolving lines of credit (home equity lines of credit and credit cards) or by reducing the credit limit on revolving lines of credit. Such credit line closures and cuts are commonly made by creditors when there is uncertainty in the macro-economic environment (Dempsey and Ionescu, Reference Dempsey and Ionescu2021) or when an individual consumer's repayment behavior or credit record suggests financial duress (Federal Trade Commission, 2016). For this study, we construct a combined indicator (0,1) of the randomly selected individual experiencing a creditor initiated closure of a revolving credit line in a 6-month period or experiencing a decrease in the credit limit on revolving trades in a 6-month period. We then calculate the change in a consumer experiencing a credit line cut or closure as of Q4-2020, relative to experiencing a credit line cut or closure as of Q4-2019.
2.2.3 Use of alternative financial services
In addition to traditional forms of credit, our data include information about the use of AFS from Experian's Clarity Services data. We construct an indicator (0,1) if the randomly selected individual made a new inquiry for AFS credit that was reported in the Clarity data (by one of the Clarity creditors) in a quarter. This identifies a consumer who is seeking higher cost, often short-term forms of credit – a proxy for potential financial distress. For this study, we calculate the change in having any Clarity inquiry at the consumer level before and after the onset of the COVID-19 pandemic (Q3-2019 and Q3-2020, respectively).
2.2.4 Payment delinquencies
For this study, we construct an overall indicator (0,1) of payment delinquencies that takes the value of 1 if the randomly selected individual was presently 60–180 days late on any debt payment in a given quarter. This is aggregated across all debt types. It does not code as delinquent payments that are more than 180 days late or derogatory (often in collections or charged-off), but instead is intended to capture debt that is recently delinquent.
2.2.5 Payment accommodations on installment loans
Following the onset of the COVID-19 pandemic, numerous consumers received accommodations on their debt payments, including temporary suspension of required payments. Debts that are in accommodations are not coded as delinquent, even if the consumer does not make a payment for 60 or more days. For federal student loans, forbearance was automatic. For mortgages federally insured by Fannie Mae, Freddie Mac, or the Federal Housing Administration, forbearance was required as an option if a homeowner sought leniency due to a COVID-19-related financial hardship. Many lenders of non-federally insured mortgages also offered temporary forbearance during this period (Cherry et al., Reference Cherry, Jiang, Matvos, Piskorski and Seru2021). There were no requirements for automobile and other installment lenders to offer forbearance or payment accommodations; however, many offered temporary payment suspension without delinquency for distressed consumers.
We construct an indicator (0,1) that takes the value of 1 if an individual received any payment accommodations or forbearance in any quarter of 2020 on mortgages, automobile loans, personal loans, or student loans. Because most student loans were in forbearance during 2020, we separately construct an indicator that excludes forbearance on student loans. We identify payment accommodations and forbearance in the credit data as trades with a non-zero balance but with no required monthly payment, or as trades coded by the creditor as in forbearance or as being affected by a natural disaster.Footnote 6 This is a commonly used approach to identify trades in forbearance or payment accommodations using credit data (e.g., Cherry et al., Reference Cherry, Jiang, Matvos, Piskorski and Seru2021).
2.3 Covariates
Table 1 reports on the covariates used in our analysis sample as of Q4-2019, which is the quarter prior to the onset of the COVID-19 pandemic in 2020. We report covariates by age of the randomly selected individual, in categories: <50, 50–51, 62–66, 67–71, and 72 and older. These age categories demarcate specific policy thresholds in older age, including eligibility to claim early Social Security retirement benefits (age 62), eligibility for full Social Security retirement benefits (age 67), and eligibility for larger delayed Social Security retirement benefits (age 72).
Table 1. Summary distributional statistics for demographic and financial covariate factors by age: Q4-2019
Each factor is share of total. Each section may not sum to 100 due to rounding. HH size and change based on the number of consumers per address in credit record and does not represent standard definitions for households in other data. Income based on Experian ‘Insight’ imputed from tax form 1040-based models. Zip code race based on Census ACS shares of total population in zip code.
Source: Experian National Data Sample 2019–20.
Our first set of demographic indicators measures the number of adults aged 18 or older with a credit file in the household of the randomly selected individual. This is a proxy for household size but excludes children and people in the household who do not have a credit file. In our sample, approximately 19–20% of the randomly selected individuals aged 62 and older live in households with only one consumer. According to 2019 United States Census data, 28% of adults aged 65 and older lived alone. The relatively low share of older adults living in single consumer households in the credit sample may reflect the selectivity of people in credit data being those who are more connected to the financial system and less likely to live alone. It may also reflect the difference between the housing unit criteria used in the census to establish single living and the shared mailing address criterion we apply to our Experian data. Further, there can be a delay between death and when a consumer no longer is reported in credit data which may bias the household size to be larger in credit data, particularly at older ages. In addition to the measure of household size, we also construct indicators for adding or losing a household member between Q4-2019 and Q4-2020. The majority shows no change in household size, especially at older ages. We also include indicators measuring the gender of the randomly selected consumer in the household as reported by Experian, with about 52% being men, but declining to only 46% being men among the oldest group aged 72 and older. This reflects predictable differences in mortality rates by age and gender.
Another set of indicators measure household income. Experian imputes household income for each consumer using a proprietary model that predicts income based entirely on attributes in the consumer's credit file. We segment consumers by income quartile of the full credit population. As summarized in Table 1, adults are progressively less likely to fall in the lowest population income quartile as they age – with 38% of adults aged 18–49 falling in the bottom quartile relative to just under 5% of adults aged 72 and older.
We also include indicators for credit score. We group credit scores following industry thresholds as follows: <580, 581–669, 670–739, 740–799, 800 or higher. Scores below 580 indicate a very poor credit history, whereas scores of 740 or higher are generally considered ‘prime’ scores. These thresholds are selected based on industry standards for the VantageScore product that we use in these analyses, as well as for similarly defined and scaled score products such as the FICO score. Experian and Equifax, two of the three leading national credit bureaus in the United States, list these five credit score ranges as the relevant credit score ranges used by lenders in underwriting.Footnote 7 Credit scores tend to increase with age (Brown et al., Reference Brown, Lee, Scally and van der Klaauw2020b). It is thus not surprising that the proportion of older adults with credit scores below 580 declines monotonically by age category in our sample, with 13% of adults aged 50–61 having credit scores below 580 and only 3.4% of adults aged 72 and older having credit scores below 580.Footnote 8
We also include monthly debt burden using Experian-imputed household annual income and monthly debt-to-income (DTI) variables as of Q4-2019. We rely on a common industry standard of a DTI of 30% or higher indicating a consumer with high debt burden. We also include an indicator for a consumer with no monthly debt payments (DTI = 0). The share of adults with an estimated DTI of 30% or more declines with age in our sample, from 12% of adults aged 50–61, to only 2.3% of adults aged 72 and older.
For mortgage debt, we also construct an indicator for a household holding any mortgage debt. As summarized in Table 1, the share of individuals living in households with mortgage debt as of Q4-2019 declines with age, from 53% of individuals aged 50–61 to 33% of individuals aged 72 and older.
Credit history data do not include any information on race or ethnicity. We use the 2019 American Community Survey (ACS) 5-year estimates to categorize the majority race or ethnicity of the ZIP code as follows: (1) majority Black if more than 50% of people in the ZIP code report their race as Black; (2) majority Hispanic if more than 50% of the people in the ZIP code report Hispanic ethnicity and not more than 50% report Black race; (3) majority White non-Hispanic if more than 50% of the people in the ZIP code identify as White and not more than 50% report Hispanic ethnicity; and (4) no majority race or ethnicity if there is no majority race or ethnicity in the ZIP code. In our sample, about 5% of randomly selected individuals live in majority Black ZIP codes, and 7–10% of adults aged 50 and older live in majority Hispanic ZIP codes (decreasing by age group).
2.4 Methods
We begin the analysis by describing the difference between the level of each credit and debt outcome as of the end of Q4-2020 and the level of the outcome as of the end of Q4-2019 – essentially just before the pandemic onset in March 2020 until the end of the calendar year. These descriptive statistics paint a picture of debt trends by age group across each subgroup. A series of cross-tabulations compares the levels of change in outcomes across categories of key covariates. This allows us to identify particular groups of older adults who may be more or less affected by the COVID-19 pandemic. Estimating change as of the end of the fourth quarter in each period holds constant seasonal variation in credit use.
We next estimate a series of panel regression models predicting debt levels and delinquency on debt from Q1-2019 to Q4-2020. The regression models allow us to control for lifecycle differences and trends in debt and credit by age prior to the pandemic – thereby isolating the added pandemic effect on debt and repayment outcomes. The empirical specification for these ordinary least squares models is:

where Y is the level in the outcome for individual i in period t. D is a vector of individual time-invariant characteristics as of the first quarter the individual enters the regression sample (typically Q1-2019) including the number of adults in the household with a credit file, income quartile categories, imputed DTI ratio (in categories), credit score (in categories), and an indicator for holding a mortgage. V is a vector of time varying individual characteristics, including household status and gender of the individual (single women, single men, not single household, other), as well as the change in household size as of time t. Age is vector of categorical variables defined in Table 1. Age varies over time to control for age-specific lifecycle trends. The pandemic variable is a dummy indicator coded ‘1’ if the quarter is the second through fourth quarters of 2020, and ‘0’ otherwise. The interactions of Age and Pandemic are intended to estimate the differential change in Y during the COVID-19 pandemic for each age group. Z is a vector of indicators for the majority race and ethnicity of the ZIP code where the household is located, and Q is a vector of indicators for quarters two through four, to account for seasonality. Finally, E is an idiosyncratic error term affecting individual i in period t that we then cluster at the individual level to account for repeated individual observations over time.
To explore heterogeneous effects for older adults by income, we re-estimate equation (1) limiting the sample to adults aged 50 and older. This version includes interactions by time with income quartile to estimate the differential change in Y during the COVID-19 pandemic for older adults by income.
3. Findings
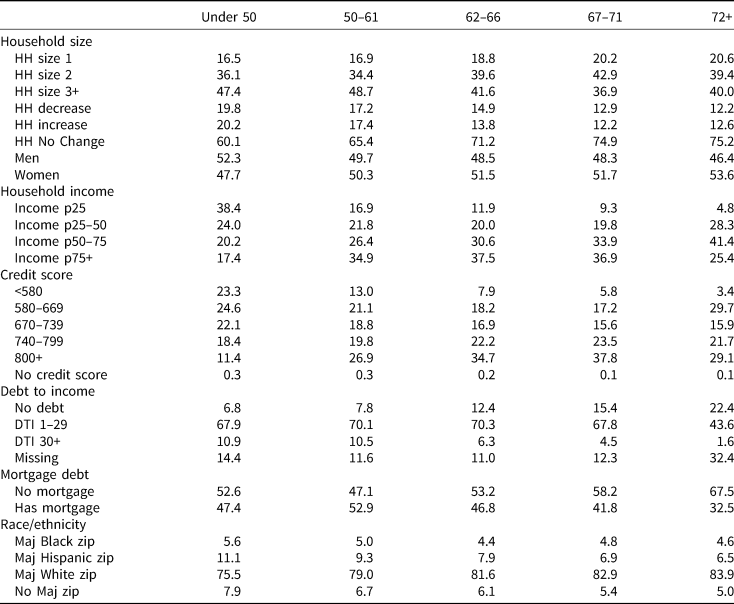
We begin with a visual analysis of the change in total debt amounts by age category in Figure 1a. This graph plots percent changes in average total household debt from Q1-2019 through Q4-2020 among people aged 18–50, 51–62, 62–65, 66–71, and then 72 and older. Debt balances grow faster for youngest households in the second half of 2020 (the pandemic period), but decline for other age groups, except for those 72 and older. The groups closest to retirement ages, in the 62–66 and 67–71-year-old categories, show substantial declines in debt over the course of the pandemic, especially relative to the younger 18–50 age group. Upon visual analysis, the pandemic is not associated with rising debt levels for older workers or people approaching typical retirement years, but some modest increases in debt for people aged 72 and older. Figure 1b shows a similar pattern in percent changes in average mortgage debt. Figure 1c shows a decline in credit card debt during the pandemic for all age groups, with a similar ordering where 62–66 and 67–71-year-olds show larger and faster decreases in credit card debt than those 50 and younger or 72 and older.
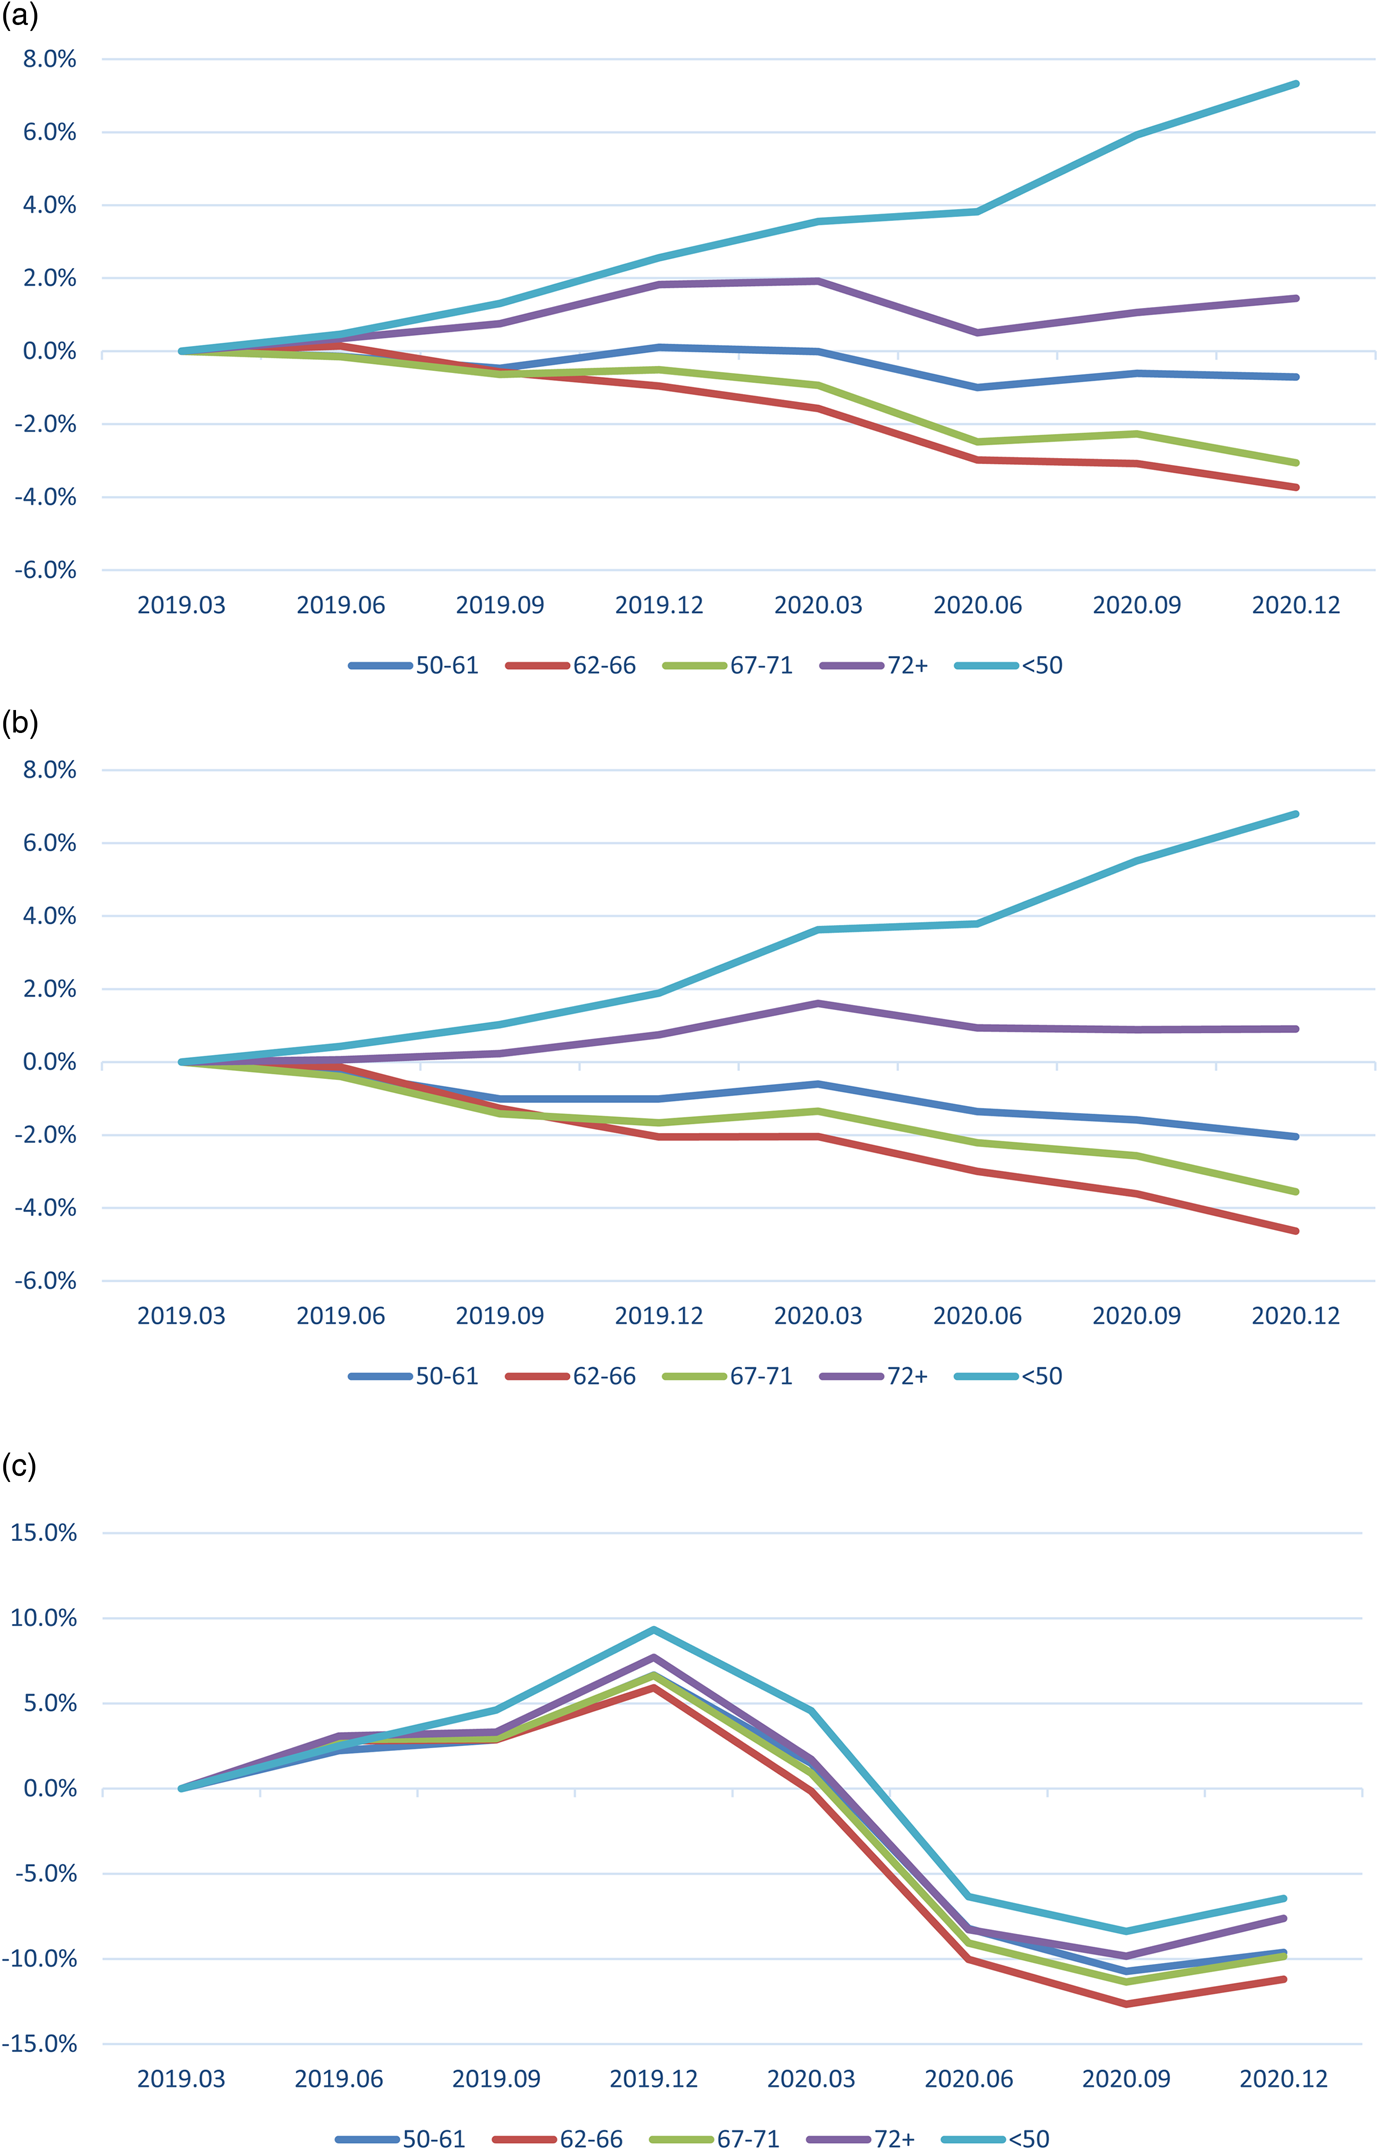
Fig. 1. (a) Change in total household debt balance from Q1-2019, by age and quarter. Source: Experian National Data Sample 2019–20. N = 2.5M. The figure shows changes average debt balances by age group, with the larger declines in 2020 among people aged 50 and older compared to people aged 18–50. (b) Change in mortgage debt balance, by age and quarter. Source: Experian National Data Sample 2019–20. N = 2.5M. The figure shows changes average mortgage balances by age group, with the larger declines in 2020 among people aged 50 and older compared to people aged 18–50. (c) Change in credit card debt balance, by age and quarter. Source: Experian National Data Sample 2019–20.
N = 2.5M. The figure shows changes average credit card balances by age group, with the larger declines in 2020 among people aged 50 and older compared to people aged 18–50.
Table 2 shows average total household debt levels as of Q4-2019 and the change from Q4-2019 to Q4-2020, by key covariates within each age group. For example, the under 50 group began with $153,927 in total household debt and experienced an increase by the end of Q4-2020 of $7,152. The 72 and older group began with $77,710 and experienced a decrease in debt of $291. Single-adult households on average experienced pronounced debt increases over the pandemic, while debt balances decreased on average for households containing three or more adults with credit reports. This relationship between debt growth and household size appears at every age. In addition, households that gain a member see an increase in debt of almost $60,000 or more, and those that lose a member see a drop in debt of $55,000 or more, for all age groups. This is in part mechanical, as we track debt at the household level at each wave, and departing members take their debt with them. Women and men show similar debt changes over the year for all age groups, with men reducing debt by a small amount more in three of the older age groups.
Table 2. Total household debt by age: Q4-2019 balances and balance changes for Q4-2019 to Q4-2020
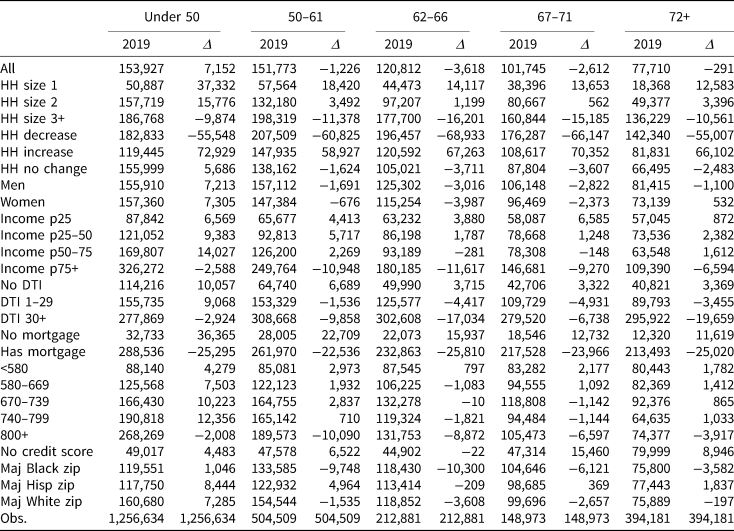
Note: Δ is the change in balance Q4-2019 to Q4-2020. Mean values.
Source: Experian National Data Sample 2019–20.
By income quartile, debt balances decline over the pandemic on average only for the fourth income quartile and increase for lower-income quartiles. This is true at all ages. The decline in debt for younger people in the higher-income quartile is, however, quite modest, while the decline for older people in the higher-income quartile is on the order of $10,000.
Debt balances decline for those who had DTI ratios of 30% or more in Q4-2019, regardless of age group. It is the moderate debt of the young and old which differs meaningfully, as young people with moderate debt loads (1–29%) increased their debt and older people with moderate debt loads decreased their debt during 2020. Debt changes are negative for mortgage holders and positive for non-mortgage holders across all age groups, and the divergence here is large.
All age groups show some increase in debt for the lowest credit score group, those with VantageScore credit scores under 580. But people with middle-level credit scores among the under 50 age group increase their debt substantially over the pandemic year, while older people with similar credit scores in many cases show decreasing or relatively flat balances. High scorers of all age groups decreased their debt, on average, with the 50- to 61-year-old group with good credit decreasing average debt by $10,090.
The pattern of debt change by neighborhood race and ethnicity characteristics is similar for the old and the young, in that debt increases were the smallest (or decreases the largest) in zip codes in which a majority of residents identify as Black, increases were the largest (or smallest decreases) in zip codes in which a majority of residents identify as Hispanic, and in between these two poles for zip codes in which a majority of residents identify as White. However, mean debt levels rise in all three of these neighborhood race/ethnicity categories for residents under 50, while debt levels decline for residents of majority Black and majority White neighborhoods for each of the older age groups.
Given the marked declines in debt for the older, higher credit score, higher income, and mortgage holding subgroups, the picture that emerges from Table 2 is one of declining pandemic-era debt among the older and economically advantaged, and rising debt for most others. At the same time, residents of majority Black neighborhoods and people with substantial pre-pandemic debt relative to income also show steep balance declines.
Table 3 summarizes average changes in key credit outcomes by age group from Q4-2019 to Q4-2020, before and during the pandemic. The first row (ΔTotal Balance) repeats the estimates from Table 2, adding the standard deviation for each mean estimate. The rows below, however, offer more details on the composition of total debt. Mortgage balances appear to be a large share of the changes in the average total debt, increasing for younger households (50 and under) and decreasing or close to no change for older households. Credit card balances, the form of debt we might expect to be used for goods and services on a regular basis, show declines for all age groups. This likely reflects the general decline in consumption during 2020.
Table 3. Changes in credit outcomes by age: Q4-2019 to Q4-2020
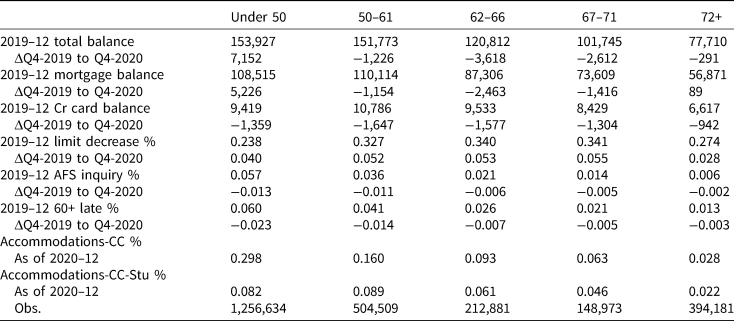
Δ is the difference between Q4-2020 and Q4-2019 levels in whole 2020 dollars, except for AFS which is Q3 differences. 60+ late is the rate of 60 days or more late payments. Accommodation is a payment reduction or deferral in place in 2020, excluding credit cards (−CC), and then excluding credit cards and student loans (−Stu). Accommodations were not reported before 2020. Mean values. Standard deviation in parentheses (SD).
Source: Experian National Data Sample 2019–20.
Table 3 also shows an increase in the rate at which people were involuntarily restricted in their borrowing as lenders lowered credit limits or closed accounts, with the rate of limit decreases meaningfully higher for those aged 50–71. The share experiencing cuts or closures increased by more than 5 percentage points, or roughly 15%, for adults aged 50–71 between Q4-2019 and Q4-2020. There does not appear to be an increase in high-cost AFS lending, however. The ΔAFS Inquiry measure is negative or unchanged for all age groups. Likewise, 60-day late payments also declined for all age groups. Accommodations are present for people in all age groups, however, and especially for people 50 and under and when including student loans. Even excluding student loans, nearly 9% of people aged 50–61 – the so-called ‘prime’ working ages when people save for retirement – are benefiting from payment holidays or extensions. While payment accommodations prevent a person from being delinquent on debt payments, such accommodations lead to otherwise higher debt balances than would be observed if the individual made regular monthly payments.
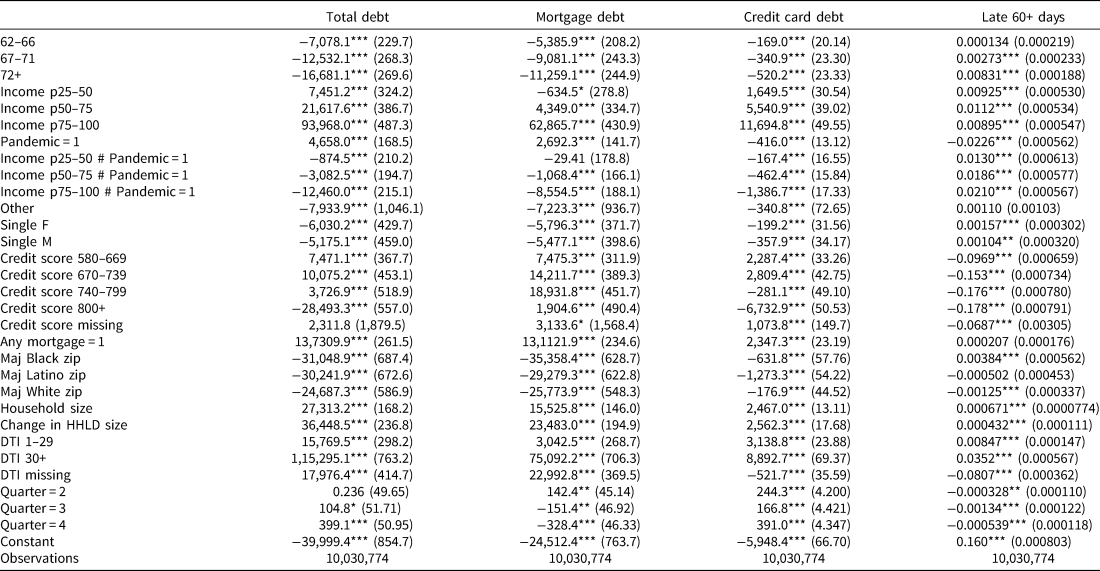
We next shift to the estimates from the specifications described in equation (1). Table 4 reports the focal estimates from the panel regression specifications. These are essentially conditional means of credit outcomes by age group, holding constant general lifecycle trends and other factors that are associated with debt levels and repayment outcomes (see Table A1 for all covariate estimates). Like the summary statistics in Table 2, older people show reductions in debt levels during the 2020 pandemic (Q2, Q3, and Q4). While adults under age 50 had substantial increases in debt during the pandemic, adults aged 62 and older experienced a significant decrease in total debt during the pandemic in 2020. These estimates show an increase in total debt for the pandemic dummy but decreases in debt by quarter for the pandemic by age interactions.Footnote 9
Table 4. Panel regression estimates, all age groups, pandemic by age interactions
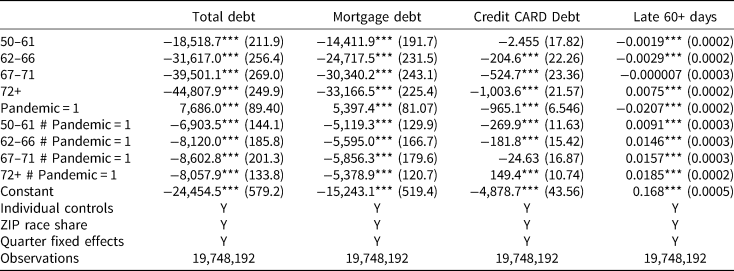
Note: standard errors in parentheses; *p < 0.05; **p < 0.01; ***p < 0.001.
Source: Experian National Data Sample 2019–20. Quarterly data Q1-2019 to Q4-2020. Pandemic defined as Q2, Q3, and Q4-2020. Under aged 50 omitted/constant. Individual controls include household size and type/gender, change in household size income quartile, credit score category (580–669, 670–739, 740–799, 800+, missing), mortgage holder dummy, and debt to income ratio category (1–29, 30+, missing). ZIP code controls include Maj Black, Maj Latino, Maj White.
A large portion of the change in total debt is comprised of changes in mortgage debt, mirroring the pattern for total debt. Increases in mortgage debt during the pandemic can occur because of a reduced rate of debt repayment (including payment accommodations which expanded during the pandemic) or because of expanded mortgage borrowing, such as through the refinance or purchase of a home, especially given the generally low loan interest rates in 2020. Younger age groups are more likely to purchase or refinance mortgages in any quarter regardless of the pandemic. While all age groups took out more mortgages in 2020 than 2019; borrowing rates increased more for younger households.Footnote 10 Looking back at pandemic-related accommodations in Table 3, younger adults are much more likely to have loans placed in payment accommodations or forbearance during the COVID period than older adults, which may also contribute to this pattern.
Regarding credit card debt (Table 4), all age groups show reductions in debt levels in the pandemic period, with the largest reductions for those aged 50–61 and the smallest for the oldest adults (aged 72+). These trends reflect the net effects of reduced consumption through credit cards and changes in credit card repayment during the pandemic – although we cannot isolate which effect dominates. Finally, Table 4 shows an age gradient in pandemic-related changes in delinquency on debt payments, with younger adults experiencing the greatest decline in delinquency during the pandemic quarters – an effect that diminishes monotonically with age. Figure 2 provides descriptive evidence that much of the decline in delinquency on debt payments is likely due to an increase in payment accommodations during the pandemic quarters. For both older and younger adults, rates of payment accommodations increase as rates of delinquency drop, beginning in the second quarter of 2020.
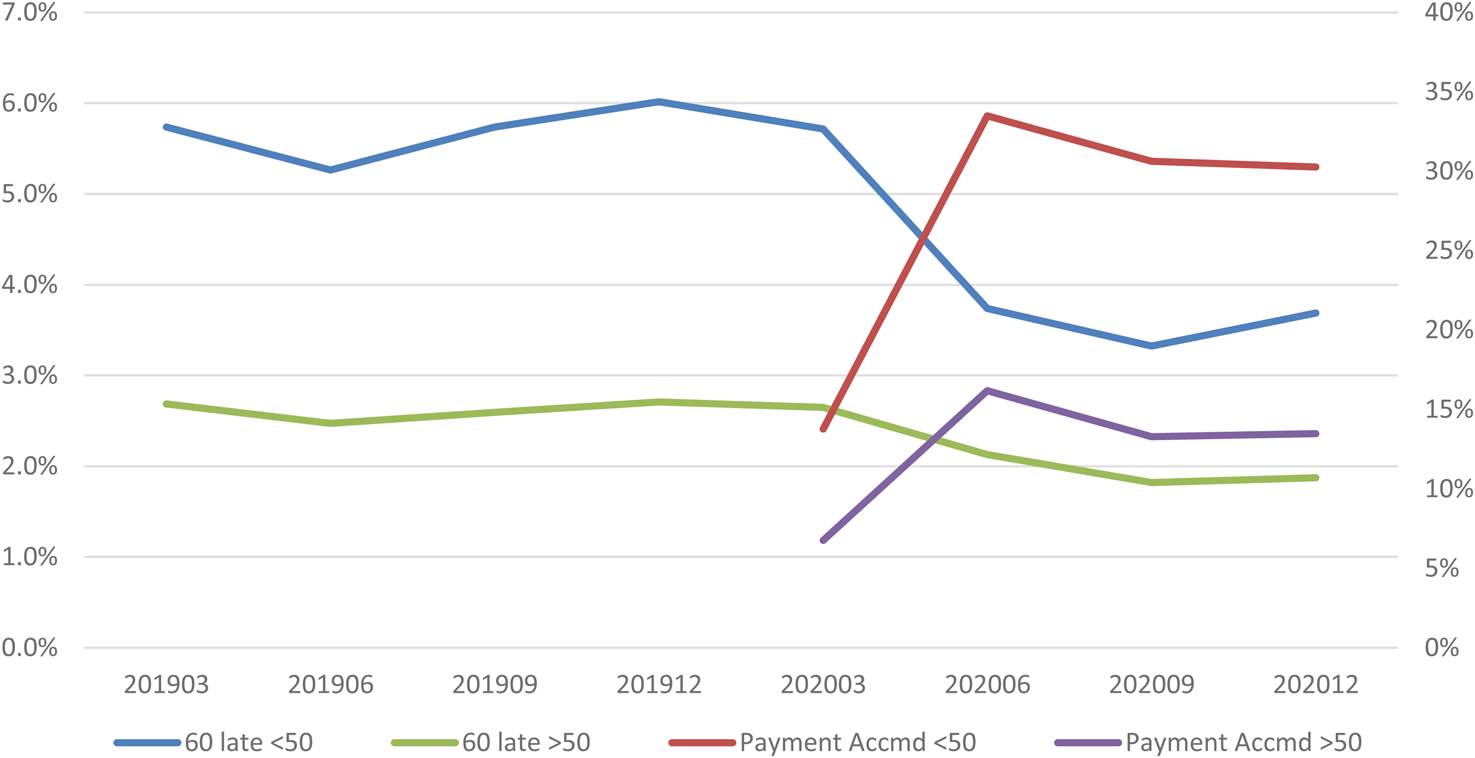
Fig. 2. 60-Day delinquency and payment accommodation rates by age and quarter. Source: Experian National Data Sample 2019–20. N = 2.5M. The figure shows delinquency (left Y axis) and payment accommodations (right Y axis) rates for people aged 18–50 compared to those aged 50 and older. As the pandemic begins in 2020, the delinquency rate declines for all people, but more for those under 50, who also have higher accommodations rates, peaking at nearly one in three borrowers.
The estimates in Table 5 are restricted to adults aged 50 and older (see Table A2 for all covariate estimates). The results show stark differences by income in pandemic-era changes in total debt levels and mortgage debt levels. The highest income quartile of older adults reduced their total debt and mortgage amounts, while older adults in the lowest income quartile increased total debt and mortgage debt. While credit card debt declined for older adults in all income quartiles in the pandemic, credit card debt decreased more for older adults in the highest income quartile. Table 5 also shows divergent trends in debt payment delinquency during the pandemic. These results largely mirror the descriptive trends by income reported in Table 2, but the panel regression estimates are conditional on demographic and other factors, suggesting patterns by age that are not driven by lifecycle trends.
Table 5. Panel regression estimates, age × pandemic interactions, age 50+
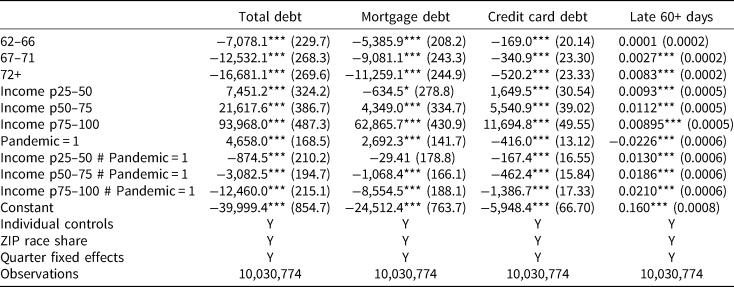
Note: Standard errors in parentheses; *p < 0.05; **p < 0.01; ***p < 0.001.
Source: Experian National Data Sample 2019–20. Quarterly data Q1-2019 to Q4-2020. Pandemic defined as Q2, Q3, and Q4-2020. Under aged 50 omitted as constants. Individual controls include household size and type/gender, change in household size, credit score category (580–669, 670–739, 740–799, 800+, missing), mortgage holder dummy, and debt to income ratio category (1–29, 30+, missing) . ZIP code controls include Maj Black , Maj Latino, Maj White.
4. Conclusion
This study investigated changes in debt levels and credit outcomes of older adults in the United States following the onset of the COVID-19 pandemic. On average, older adults appear to have reduced debt during the first three quarters of the pandemic in 2020, relative to debt levels in 2019. This overall reduction in debt presumably resulted, in some combination, from lost consumption opportunities that arose because of the pandemic and from the massive and unprecedented stimulus program mounted by the government. The $1.7 trillion CARES Act provided Economic Impact Payments of $1,200 per adult and $500 per child, expanded unemployment insurance benefits of $600 per week, eased unemployment benefits eligibility, and was followed by a series of extensions of various unemployment benefits and stimulus payments. Supplemental Nutrition Assistance Program benefits underwent an emergency expansion, and, of relevance to the older population that is the focus of this research, the federal government together with some employer retirement plan administrators implemented coronavirus-related retirement account withdrawal and loan relief options.
However, the decline in debt is not uniform. We find significant differences by income, where older adults in the highest income quartile prior to the pandemic experienced significant and large pandemic-period reductions in total debt, while older adults in the three lower-income quartiles experienced pandemic-period increase in total debt. Our panel regression framework indicates that these changes in debt are not simply a function of lifecycle trends or other factors.
Despite debt levels increasing for lower-income older adults, we observe a significant decrease in payment delinquencies during the COVID quarters relative to pre-COVID quarters. Our descriptive results suggest that much of this reduction is due to an increase in payment accommodations during the same period. Creditors, and in particular mortgage lenders, offered generous temporary payment holidays after the onset of the COVID (Cherry et al., Reference Cherry, Jiang, Matvos, Piskorski and Seru2021) and our results indicate that older adults – and in particular lower-income older adults – benefited from these accommodations, preventing delinquencies but leading to higher debt balances than would have otherwise occurred with regular payments.
On average, people on the cusp of retirement and those already retired weathered the early periods of the pandemic in 2020 without experiencing significant payment distress or turning to high-cost AFS. Lower-income and more economically vulnerable populations experienced greater increases in debt balances and were more likely to receive payment accommodations – and may also struggle when loan payment accommodations expire. Our results provide important motivation for researchers and policymakers to closely monitor outcomes for economically vulnerable households who often rely on Social Security benefits and pensions in older ages.
Acknowledgements
The research reported herein was performed pursuant to a grant from the US Social Security Administration (SSA) funded as part of the Retirement and Disability Research Consortium (RDRC) project WI20-Q2. The opinions and conclusions expressed are solely those of the authors and do not represent the opinions or policy of SSA or any agency of the Federal Government. Neither the United States Government nor any agency thereof, nor any of their employees, makes any warranty, express or implied, or assumes any legal liability or responsibility for the accuracy, completeness, or usefulness of the contents of this report. Reference herein to any specific commercial product, process or service by trade name, trademark, manufacturer, or otherwise does not necessarily constitute or imply endorsement, recommendation, or favoring by the United States Government, or any agency thereof.
Appendix
Table A1. Panel regression estimates, all age groups, pandemic by age interactions
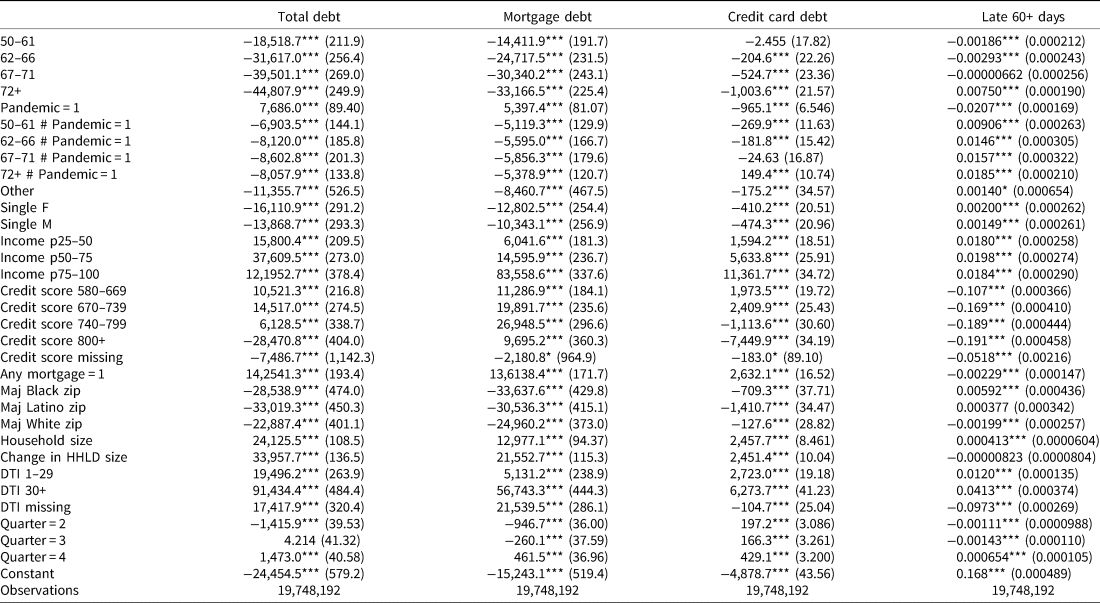
Table A2. Panel regression estimates, age × pandemic interactions, age 50+


 Open access