


Consumption of sugars and their role in the development of obesity and related co-morbidities is a major public health concern. Most studies regarding sugar consumption are limited because of their reliance on self-reported intake through FFQ and 24-h dietary recalls. Self-reported intake can be problematic because it can be poorly recalled in terms of the foods consumed and the estimation of portion size and can be subject to social-desirability bias. Moreover, in the context of an intervention study where participants are receiving advice to change their sugar intake, it is important to have a measure of compliance that is not self-reported. Therefore, a biomarker of sugar intake that accurately reflects intake, and can be obtained from a simple blood draw is needed to monitor changes in dietary sugar intake for nutrition research.(Reference Subar, Freedman and Tooze1)
The carbon stable isotope ratio, 13C:12C (reported as δ13C), is proposed to be an objective measure of sugar intake, as it is naturally elevated in maize and sugar cane relative to other plant-based foods, such that consumption of maize- and cane-derived sugars as well as meat from animals fed primarily on maize (beef cattle, pigs, poultry) would result in an elevated δ13C(Reference O'Brien2). Cross-sectional studies in adults(Reference Nash, Kristal and Hopkins3,Reference Davy, Hope Jahren and Hedrick4) and 6- to 18-year-old children(Reference MacDougall, Hill and Jahren5) have shown that the δ13C biomarker is associated with reported added sugar intake, and particularly intake of sugar-sweetened beverages. An intervention in an obese adult population showed that a mean reduction in sugar-sweetened beverage intake (one 12-fluid ounce serving/d (355 ml)) was associated with a reduction of δ13C over 18 months(Reference Fakhouri, Jahren and Appel6). Similar findings were reported from 6-month(Reference Davy, Jahren and Hedrick7) and 12-week(Reference Votruba, Shaw and Oh8) interventions focusing on decreasing sugar-sweetened beverage intake in overweight adults.
High reported total sugar intakes(Reference Lamb, Frederiksen and Seifert9) and higher glycaemic index of the diet(Reference Lamb, Yin and Barriga10) have been associated with increased risk of progression to type 1 diabetes in children. If one were to design a dietary sugar reduction intervention to prevent progression to type 1 diabetes, it would be important to determine whether the δ13C biomarker would reflect change in dietary sugar intake in a paediatric population at risk for type 1 diabetes that is typically not overweight.
The purpose of the present study is to determine the relationship between self-reported change in added sugar intake and the δ13C biomarker in ‘free-living’ children at increased type 1 diabetes risk between the ages of 5 and 10 years.
Methods
Diabetes Autoimmunity Study in the Young (DAISY) cohort
Samples and data included in the present study were previously obtained from the Diabetes Autoimmunity Study in the Young (DAISY), a cohort study with longitudinal follow-up of children who were recruited from the following two populations in Denver, CO, USA: (1) unaffected children with a first-degree relative with type 1 diabetes (n 1123); and (2) children from the general population born in 1993–2006 who, through newborn screening for diabetes-susceptibility HLA-DR (human leucocyte antigen-DR) alleles, were identified to have an increased risk for the disease (n 1424)(Reference Rewers, Bugawan and Norris11). The present study was conducted according to the guidelines laid down in the Declaration of Helsinki and all procedures involving human subjects were approved by the Colorado Multiple Institutional Review Board (IRB no. 92-080). Parental consent was obtained for all participants, and assent was obtained from children ≥7 years of age.
Islet autoimmunity was defined as the presence of at least one serum autoantibody against insulin, the tyrosine phosphatase-like protein IA2 (islet antigen 2), GAD (glutamic acid decarboxylase), or Zn transporter 8, twice or more in succession, as described previously(Reference Barker, Barriga and Yu12). Children with islet autoimmunity were followed for the development of type 1 diabetes, as determined by American Diabetes Association criteria. We measured HbA1c using a DCA_2000 Vantage analyser (Siemens Medical Solutions). HbA1c measures the average amount of glucose in the blood over the last 2–3 months by measuring the percentage of Hb with glucose attached. The normal range for HbA1c is between 4 and 5⋅6 %, and levels of 6⋅5 % or higher are indicative of diabetes.
Dietary assessment
A semi-quantitative FFQ measuring the child's usual dietary intake during the previous year was administered to the parents of the children at each visit. The FFQ has been validated in DAISY using biomarkers(Reference Brady, Lamb and Sokol13,Reference Orton, Szabo and Clare-Salzler14) and 24-h dietary recalls(Reference Parrish, Marshall and Krebs15). The FFQ contains food items with portion sizes and covers the average consumption frequency with alternatives ranging from: ‘never or less than once a month’ to ‘six or more times per day’. Added sugars (g/d) are defined as sugars and syrups that are added to foods or beverages when they are processed or prepared. Estimates of added sugar intake in our data were based on added sugar values in the United States Department of Agriculture (USDA) Database for the Added Sugars Content of Selected Foods, Release 1, Standard Release 21. Foods not having added sugar values in the USDA database had their added sugar values derived in recipes, using label ingredients, or imputed from similar USDA foods using total sugar ratios. ‘Total sugars’ (g/d) includes added sugars and natural sugars. The sugar-sweetened beverage variable was calculated from the frequencies of reported intake of carbonated and non-carbonated beverages with sugar (soft drinks, punch, lemonade, fruit drinks, iced tea, sports drinks and energy drinks) with one glass, bottle or can (12 fluid ounces) as the standard serving size. Also, 100 % fruit juice was not included as a sugar-sweetened beverage. No dietary advice was offered to the children.
Study population
From the DAISY population, we selected all children that fulfilled all four of the following criteria: (1) between the ages of 5 and 10 years (inclusive), (2) available dietary added sugar intake data, (3) available HbA1c measures, and (4) an erythrocyte sample available for the measurement of the δ13C biomarker on two visits. Of the thirty-nine children who met these four criteria, the two study visits were approximately 2 years apart. The BMI at the first visit was 16⋅9 mg/m2. Of the thirty-nine children, thirty (77 %) had islet autoimmunity; none had type 1 diabetes at the time of the included study visits.
The δ13C biomarker
Our primary outcome was the carbon isotope ratio, 13C:12C (reported as δ13C), which can be measured in erythrocytes, plasma, capillary (fingerstick) blood and hair. Given the typical lifespan of erythrocytes of 90–120 d, erythrocyte measures of isotope ratios may better reflect longer-term intake than plasma, and plasma may be better at indicating shorter-term changes in diet(Reference Nash, Kristal and Hopkins3,Reference Votruba, Shaw and Oh8) . For the purposes of the present study, we measured isotope ratios in erythrocytes since our dietary intake measure was an annual FFQ and we were comparing change over approximately 2 years. Since levels of δ13C may be affected by intake of maize-fed meat, we also measured 15N:14N, expressed as δ15N, which is a biomarker of animal protein/meat intake(Reference Votruba, Shaw and Oh8,Reference Cuparencu, Praticó and Hemeryck16) , so that this could be accounted for in our analyses. Erythrocytes were sent to the Alaska Stable Isotope Facility at the University of Alaska Fairbanks Water and Environmental Research Center for analysis. Aliquots of erythrocytes were pipetted into tin capsules (Elemental Microanalysis; IsoMass Scientific, Inc.), autoclaved, dried and prepared for isotopic analysis. The tin capsules were crushed and introduced into a Costech Elemental Analyzer (ECS 4010; Costech Analytical Technologies) using an autosampler. The elemental analyser was interfaced to a Delta V Plus isotope ratio mass spectrometer via the Conflo IV interface (Thermo Scientific, Inc.). Isotope ratios are presented in permil (‰) abundance of heavy isotope relative to reference values as follows: δX = (Rsample − Rreference)/(Rreference) × 1000 (‰), where X is the heavy isotope, R is the ratio of heavy to light isotope (13C:12C or 15N:14N), and the reference values are internationally recognised standards calibrated to Vienna Pee Dee Belemnite (13C:12C = 0⋅01124) and atmospheric nitrogen (15N:14Natm-N = 0⋅003677). Analytical precision was assessed as the standard deviation of laboratory working standards calibrated to the above reference materials that were measured after every 10th sample; these were typically within 0⋅2‰ for δ13C and δ15N.
As most living organisms have a smaller 13C:12C ratio than the Vienna Pee Dee Belemnite carbon standard, the measured δ13C values are generally negative. Previous literature demonstrates that there is a positive relationship between δ13C and added sugar intake, where greater intake is associated with greater (less negative) δ13C levels(Reference Nash, Kristal and Hopkins3–Reference MacDougall, Hill and Jahren5). When examining change, one would expect that increasing sugar intake over time, as indicated by a positive (+) change in intake variable, would be associated with increasing δ13C, as indicated by a positive (+) change in the δ13C variable.
Statistical analyses
In order to determine whether a change in added sugar intake is associated with a change in δ13C over time, we calculated a change variable by subtracting added sugars in the last visit from added sugars in the first visit and similarly for the biomarker. Change variables were also created for total sugar intake, sugar-sweetened beverage intake, HbA1c and δ15N. We calculated Pearson correlation coefficients between the intake and biomarker change variables. To evaluate potential covariates, we examined whether change in δ13C was associated with sex, race/ethnicity, change in age and change in δ15N. Of these, only change in δ15N was associated with change in δ13C. We used linear regression analysis to test both crude and adjusted models examining the association between change in intake and change in δ13C. Even though change in δ15N was not associated with the intake change variables (and thus did not meet the classical definition of confounding), we included it in our models because previous studies have shown that the δ15N enhances the ability of δ13C to predict added sugar intake(Reference Nash, Kristal and Bersamin17). We performed a sensitivity analysis in the subgroup of children with islet autoimmunity, because this would be the group that would most likely receive a sugar reduction intervention to prevent type 1 diabetes. Given that HbA1c levels increase in children with autoimmunity as they progress to type 1 diabetes(Reference Stene, Barriga and Hoffman18), we adjusted our analyses for change in HbA1c to examine whether the association between δ13C and intake is independent of HbA1c in this population.
Results and discussion
Descriptive characteristics of the thirty-nine children in the study are shown in Table 1. The mean age was 7⋅4 years at the first visit and 9⋅4 years at the second visit. Of these thirty-nine children, 79 % were non-Hispanic White. Increasing sugar intake over time, as indicated by a more positive (+) change in intake variable, is correlated with increasing δ13C, as indicated by a positive (+) change in the δ13C variable (Pearson r 0⋅37; P = 0⋅02) (Fig. 1).
Table 1. Descriptive characteristics of the study populations (n 39) at the first and last visits and change between visits
(Numbers and percentages; mean values and standard deviations)
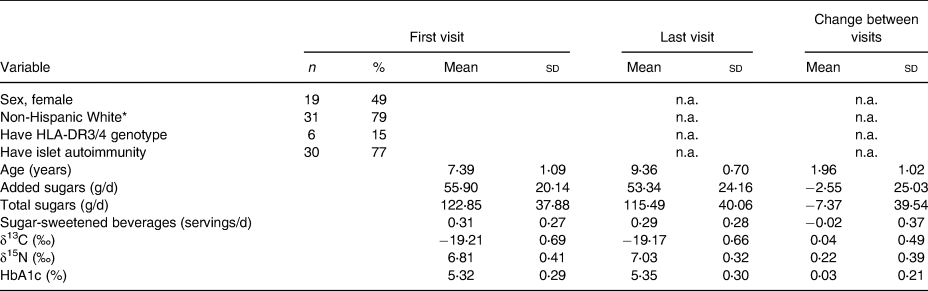
n.a., Not applicable; HLA-DR, human leucocyte antigen-DR.
* The other category included Hispanic American, African American and biracial subjects.
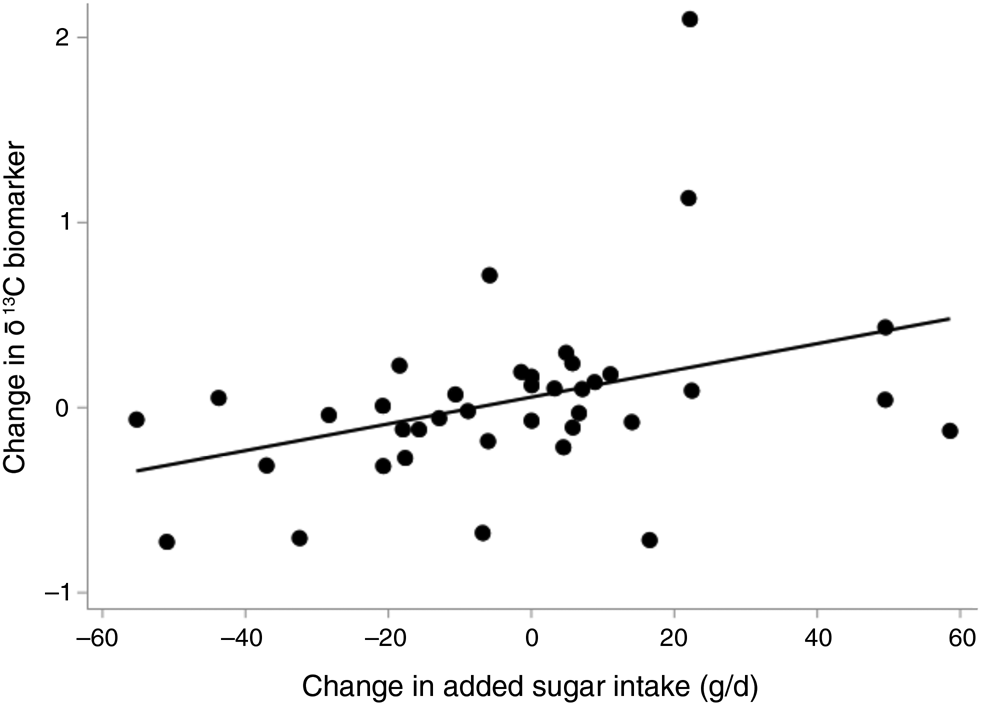
Fig. 1. Change in the δ13C biomarker by change in reported added sugar intake. Dots represent the data points and the line represents the unadjusted regression line.
In our unique population of children at increased risk for type 1 diabetes, we found that a change in added and total sugar intake over time was associated with change in the δ13C biomarker, independent of change in δ15N and change in HbA1c. For every 1-g increase in added sugar intake between the first and the last visit, the δ13C biomarker increased by 0⋅0082 (i.e. the biomarker becomes less negative over time) (P = 0⋅0053), adjusting for change in δ15N and change in HbA1c (Table 2). A similar, although weaker, positive association was seen between change in total sugar intake and change in the δ13C biomarker (β = 0⋅0029; P = 0⋅0497) (Table 2). This is a similar change relationship as that seen in an intervention study in overweight adults(Reference Fakhouri, Jahren and Appel6), indicating that this biomarker may be used to monitor change in sugar intake in children at increased risk for type 1 diabetes. The lack of association between change in sugar-sweetened beverage intake and change in the δ13C biomarker (β = 0⋅2074; P = 0⋅3310) may be due to the low consumption of sugar-sweetened beverages in our relatively young population.
Table 2. Associations between change in reported sugar intake and change in the δ13C biomarker
(β Coefficients and 95 % confidence intervals)
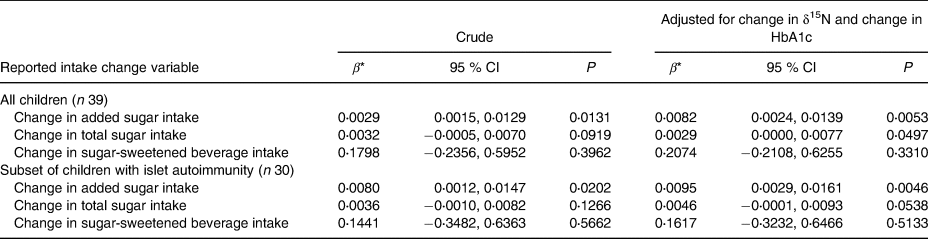
* Each dietary intake variable was analysed in a separate model.
While a relationship between a change in added sugar intake, particularly in sugar-sweetened beverages, and a change in the δ13C biomarker has been reported previously, these studies have been in either overweight(Reference Votruba, Shaw and Oh8) or obese(Reference Fakhouri, Jahren and Appel6,Reference Davy, Jahren and Hedrick7) adults. The only study in children (6–11 years old) reported a cross-sectional analysis(Reference MacDougall, Hill and Jahren5). Our study extends these findings by showing that change in reported diet is associated with change in the δ13C biomarker over an average of 2 years in 5- to 10-year-old children.
The majority of the children in our study had islet autoimmunity, which is a typical population for whom a dietary sugar intervention may be designed, given the epidemiological evidence that higher sugar intake is associated with increased risk of progression from islet autoimmunity to type 1 diabetes(Reference Lamb, Frederiksen and Seifert9,Reference Lamb, Yin and Barriga10) . In the subgroup of thirty children with islet autoimmunity, we found that change in added sugar intake is associated with change in δ13C (β = 0⋅0095; P = 0⋅0046), while adjusting for change in HbA1c and change in δ15N (Table 2). Since HbA1c levels also increase during this time period(Reference Stene, Barriga and Hoffman18) it is important that we show that the association between change in intake and change in δ13C is independent of change in HbA1c.
While erythrocyte δ13C provides an assessment of usual diet over several months, plasma δ13C may be a better biomarker to use to monitor compliance in shorter-term (<3 month) dietary interventions(Reference Votruba, Shaw and Oh8). A limitation of our study is a lack of variability in race/ethnicity, although our study population reflects the race/ethnicity of those at risk for type 1 diabetes. Additional limitations include the relatively small sample size and the reliance on reported diet via a FFQ rather than a more quantified measure of intake, such as food records. And finally, we note that the erythrocyte δ13C biomarker is most useful in populations in which the added sugars in the diet is from sugar cane or maize, rather than beets.
Conclusions
The δ13C biomarker was associated with change in reported added sugar intake in young children, suggesting that this biomarker could be used as an objective measure of compliance in an intervention study in which the goal was to reduce sugar intake. This research project has contributed to the body of knowledge surrounding this novel biomarker in providing evidence for the use of this objective measure of sugar intake in children, under the age of 10 years, who are at high risk for developing type 1 diabetes.
Acknowledgements
We thank Timothy Howe at the Alaska Stable Isotope Facility at the University of Alaska Fairbanks for assistance with the laboratory analysis. We would like to thank the generous contributions made by all participants and families enrolled in DAISY as well as the dedicated clinical and research staff at the Barbara Davis Center.
The present study was funded by the National Institutes of Health (R01-DK104351 and R01-DK32493).
M. H. designed the study, performed the data analysis, interpreted the data, and drafted the manuscript. J. N. designed the study, interpreted the data and drafted the manuscript. E. B. performed the data analysis. J. S., R. J., F. D. and M. R. collected the data. E. B., J. S., F. D., M. R. and R. J. reviewed and edited the manuscript.
The authors declare no conflicts of interest.


 Open access