


I. INTRODUCTION
Two-phase nanolayered metallic thin films fabricated by deposition techniques, such as magnetron sputtering, present an unusual structure whose crystals are nanoscale in dimension and the biphase interfaces, thus, closely spaced and high in volume fraction of coarser layered composites. In this way, nanolayered composite thin films can permit the study of interface-driven phenomena, not possible in coarse-grained composites.Reference Van Heerden, Josell and Shechtman1–Reference Chakraborty, Kumar, Ranjan, Chowdhury and Singh7
One outstanding example is the formation of pseudomorphic phases, during the fabrication of nanolayered thin films. Epitaxial growth can be exploited to cause the deposited layer to match the lattice of the underlying substrate. Provided that the layer thickness is sufficiently fine, the drive to create a low energy, coherent bimetal interface can induce a phase transformation of the deposited metal layer from its stable form under ambient conditions.Reference Dregia, Banerjee and Fraser8 Of the two dissimilar metals that are joined at their common interface, one metal adopts the crystal structure of the other.Reference Dregia, Banerjee and Fraser8 The new phase is a pseudomorphic phase. Above a critical layer thickness, the metal reverts back to its original phase under ambient conditions since misfit dislocations get introduced into the interface, which allow for coherency strain relaxation. Thus, to retain the transformed pseudomorphic phase, the individual layer thicknesses must be kept sufficiently fine, and the critical value is usually on the order of a few nanometers.
Just some of the many examples of pseudomorphic phases that have reported are body centered cubic (BCC) Zr, formed by joining Zr to BCC Nb, and face centered cubic (FCC) Ti, formed by joining it with FCC Al or Ag, and lastly, BCC Mg formed when Mg is joined with BCC Nb,Reference Dregia, Banerjee and Fraser8 Some of these studies have shown that the pseudomorphic phase can exhibit unusual properties, unlike those of its more familiar, stable state. One example is the decrease in the superconducting transition temperature in fully BCC Zr/Nb.Reference Lowe and Geballe9 As another example, Zhang et al.Reference Zhang, Zhang, Zhang, Wang, Liu, Zhang and Sun10 showed that FCC Cu/FCC Nb, containing the metastable FCC Nb phase, had higher indentation hardness than the FCC/BCC Cu/Nb composite for the same layer thickness. Most of the deposited film thicknesses, containing pseudomorphic phases, are in the range of submicrometer to a few (2–5 µm) micrometers, making the investigation of the mechanical properties of the individual phases alone very difficult. Indentation hardness measurements are the most ubiquitous for such small thickness films, but it is challenging to separate the contribution of the hardness enhancement from the new phase with those from differences in other microstructural aspects, such as interface type.
With the introduction of micropillar testing, it is possible to fabricate micron-diameter and nanodiameter pillars from thin films, often using focused ion beam (FIB)-based techniques and test their mechanical response in compression.Reference Uchic, Shade and Dimiduk11–Reference Snel, Monclús, Castillo-Rodríguez, Mara, Beyerlein, Llorca and Molina-Aldareguía14 This technique has been used over the recent years to study the elastic and inelastic responses of nanolayered composites comprised of phases in their stable state at ambient temperatures and pressures.Reference Zhang, Lei, Liu, Niu, Chen, Liu, Zhang and Sun15,Reference Raghavan, Wheeler, Harzer, Chawla, Djaziri, Thomas, Philippi, Kirchlechner, Jaya, Wehrs, Michler and Dehm16 It has been shown that bimetal nanolayered composites can possess extraordinarily high strengths when the individual layer thickness is decreased down to 5–10 nm, several times larger than a simple volume average of the strengths of the constituents.Reference Mara, Bhattacharyya, Dickerson, Hoagland and Misra12,Reference Monclús, Zheng, Mayeur, Beyerlein, Mara, Polcar, Llorca and Molina-Aldareguía13,Reference Zhang, Lei, Liu, Niu, Chen, Liu, Zhang and Sun15,Reference Raghavan, Wheeler, Harzer, Chawla, Djaziri, Thomas, Philippi, Kirchlechner, Jaya, Wehrs, Michler and Dehm16 Equal volume fraction (50/50) Cu/Nb nanolayered composites, for instance, are found to be much stronger (five times) than the volume average of the strength of the individual phases and much more thermally stable, shock resistant, and radiation resistant than Cu alone.Reference Monclús, Zheng, Mayeur, Beyerlein, Mara, Polcar, Llorca and Molina-Aldareguía13,Reference Mara and Beyerlein17–Reference Misra and Hoagland22 Likewise, 50/50 Zr/Nb nanolayered composites are much harder and stronger than bulk Zr and bulk Nb alone.Reference Knezevic and Savage23 This type of exceptional strengthening in fact has been reported in many two-phase metallic systems.Reference Subedi, Beyerlein, LeSar and Rollett24 Furthermore, when pillar testing is combined with transmission electron microscopy, the analysis can reveal evidence of deformation and failure mechanisms, such as interfacial sliding, confined layer slip (CLS), twinning, and cracking.Reference Zheng, Wang, Carpenter, Mook, Dickerson, Mara and Beyerlein25–Reference Hattar, Misra, Dosanjh, Dickerson, Robertson and Hoagland28
Relatively few reports exist using micro- and nanomechanical testing techniques to study the properties of nanolayered composites with pseudomorphic phases. Recently, by testing of micron-sized pillars of Mg/Nb layered composites, it was demonstrated that the BCC Mg/Nb composite was 50% stronger and had a strain to failure 36% larger than that of the HCP Mg/Nb nanocomposite.Reference Pathak, Velisavljevic, Baldwin, Jain, Zheng, Mara and Beyerlein29 For Mg, the difference marked an outstanding result from a technological point of view. While HCP Mg is attractive due to its lightweight and abundance, it has low strength and ductility at room temperature relative to other commonly available metals like steel and aluminum alloys.Reference Mordike and Ebert30,Reference Pollock31 One of the main reasons for its poor formability concerns the low symmetry HCP crystal structure, which leads to a pronounced sensitivity of its plastic behavior to loading direction, temperature, and strain rate.Reference Beyerlein, McCabe and Tomé32–Reference Watanabe and Ishikawa39 Usually the critical stresses to activate slip in the 〈a〉 direction are several times smaller than those in the 〈c + a〉 direction,Reference Arul Kumar, Beyerlein and Tomé40,Reference Arul Kumar, Beyerlein, Lebensohn and Tomé41 so crystals oriented well for predominant 〈a〉 slip activity deform under less stress than those oriented well for predominant 〈c + a〉 slip activity. The BCC crystal structure, on the other hand, is more symmetric and has at least 48 available slip systems with similar activation stresses and hence generally more ductile than HCP metals. Qualitatively, therefore, the BCC Mg phase composite would be expected to be more ductile than the HCP Mg phase composite. Quantitatively supporting this notion, however, is challenging for much the same reasons as mentioned earlier; the crystal structure is not the only microstructural aspect that differs between materials that contain the pseudomorphic phase and those that contain the stable phase.
The nanostructure between the two composites bears other microstructural differences that accompany the formation of the pseudomorphic phase, which accompanies other changes. For instance, in the case of the Mg/Nb example above, the two nanolayered composites, the 5 nm BCC Mg/Nb and 50 nm HCP Mg/Nb composites, differed in layer thickness, grain aspect ratio, crystal structure, potential slip and twinning systems, crystallographic texture, and interface type. All these factors can play a role in the strength of the composite. Thus, macroscopic differences in strength between composites comprised of the stable phase and metastable pseudomorphic phase cannot be easily attributed to the pseudomorphic phase change alone. Another issue in determining the mechanical properties of pseudomorphic phases is that many of their basic deformation mechanisms and properties are not known.
In this work, we investigate the elastic and plastic properties of nanolayered Mg/Nb composites. Thin film composites were synthesized via physical vapor deposition (PVD) with three different Mg target layer thicknesses: h = 5 nm/5 nm, 6.7 nm/6.7 nm, and 50 nm/50 nm Mg/Nb. These layer thicknesses were chosen so that the deformation responses of BCC Mg (h = 5 nm) versus HCP Mg (h = 50 nm) versus a mix of HCP and BCC Mg phases (h = 6.7 nm) could be compared. Micropillar compression tests were carried out in two different loading configurations, with the compression axis either (i) normal or (ii) parallel to the Mg/Nb interface planes. To gain some insight into mechanisms, a suite of methods was used. The TEM analysis of the deformed pillars suggested layer co-deformation and no twinning. Density functional theory (DFT) was used to calculate the ideal shear strengths as a way of identifying the likely slip systems in BCC Mg. The information from both analyses helped to build a crystal plasticity finite element-confined layer slip model (CPFE–CLS), a 3D full-field, multiscale, crystal plasticity-based simulation that calculates texture evolution, elastic and plastic layer deformation, and stress–strain response during the compression tests. The critical resolved shear stress (CRSS) values used in the CP constitutive law are calculated following a CLS model, which gives a layer size h, dependence via a log(h)/h scaling. The CPFE–CLS model is applied to both the HCP Mg/Nb and BCC Mg/Nb nanostructures to simulate compression applied along the parallel and normal (ND) directions to the Mg/Nb interface planes. The results suggest that the two key contributors that dominate the strengthening in the BCC Mg nanocomposite are the increase in resistance to dislocation threading as the layer thickness h reduces from 50 to 5 nm and the higher resistance to the preferred {110} and {112} slip modes in BCC Mg than resistance to the preferred basal slip in HCP Mg.
II. INTERFACE-INDUCED PHASE TRANSFORMATION
In a layered composite, the pseudomorphic phase transformation results from a balance of interface energy and bulk energy.Reference Dregia, Banerjee and Fraser8,Reference Junkaew, Ham, Zhang and Arróyave42,Reference Kumar, Beyerlein and Wang43 A rough approximation of the critical layer thickness below which the Mg phase can transform from its stable HCP form to its BCC form can be obtained by comparing the total energy with an HCP Mg layer and a BCC Mg layer. The total energy of the system per unit area is comprised of the elastic energy resulting from the coherency strains, the cohesive energy in each phase, and the interface energy,Reference Kumar, Beyerlein and Wang43 i.e.,
 $${{{E^{{\rm{tot}}}}} / A} = {h_{{\rm{Mg}}}}\left( {E_{{\rm{Mg}}}^{{\rm{elas}}} + E_{{\rm{Mg}}}^{{\rm{bulk}}}} \right) + {h_{{\rm{Nb}}}}\left( {E_{{\rm{Nb}}}^{{\rm{elas}}} + E_{{\rm{Nb}}}^{{\rm{bulk}}}} \right) + 2\gamma \quad ,$$
where h Mg and h Nb are the layer thicknesses for the Mg and Nb phase and γ is the interface energy. The calculation is performed separately for a 1:1 volume fraction of Mg:Nb and for both the HCP Mg/BCC Nb and BCC Mg/BCC Nb systems, as a function of their common h value. The interface energies for coherent BCC Mg/BCC Nb and semicoherent HCP Mg/BCC Nb interfaces were obtained from DFT and are 304 mJ/m2 and 624 mJ/m2, respectively.Reference Kumar, Beyerlein and Wang43 For the elastic energy, it is assumed that under no applied strain or pressure, the elastic strains result solely from the coherency strains generated at the coherent Mg/Nb interface. With these values inserted into Eq. (1), the model predicts that the critical Mg layer thickness h for the HCP Mg/Nb composite, at which the total energy with the coherent BCC Mg phase exceeds that of the hcp Mg phase is 4.2 nm. This result is not too different from the 5 nm value predicted for the same 1:1 Mg/Nb composite by more sophisticated thermodynamic calculations carried out by Junkaew et al.Reference Junkaew, Ham, Zhang and Arróyave42
Based on this prediction, nanolayered Mg/Nb composites with three different layer thicknesses were synthesized using the hybrid sputtering-evaporation PVD chamber (AJA International, Inc., Scituate, Massachusetts). Both Mg and Nb layers were deposited using DC magnetron sputtering at a process pressure of 3 millitorr with 300 W of power on a 2-inch target. The deposition rates were 0.83 nm/s for Mg and 0.22 nm/s for Nb. The total film thicknesses for all samples were approximately 5 µm. To minimize residual stresses, several substrate materials (MgO, sapphire and Si) and orientations were considered. The substrate material leading to the smallest residual stresses was Si in the (001) orientation, and this was used for all samples studied here.
Transmission electron microscopyReference Oppedal, El Kadiri, Tomé, Kaschner, Vogel, Baird and Horstemeyer44 and X-ray diffraction (XRD) analyses were used to determine the crystal structure and measure the layer thicknesses in the three deposited nanolayered Mg/Nb composites (Fig. 1). In the target 50 nm/50 nm Mg/Nb nanocomposite with the largest layer thickness, the Mg phase was found to be in its natural HCP phase but with an actual Mg layer thickness of h ∼ 35 nm and a Nb layer thickness of h ∼ 65 nm [Fig. 1(a)]. The second 5 nm/5 nm Mg/Nb nanocomposite had an almost equal Mg and Nb layer thickness of h = 5.5 nm, with the Mg phase present in its pseudomorphic BCC phase [Fig. 1(b)]. The third Mg/Nb nanocomposite was found to bear a range of layer thicknesses, with the Mg layers varying from h = 6.7–7.8 nm (with most layers predominantly around h = 6.7 nm) and the Nb layers lying between h = 9–10 nm. Corroborating TEM results (not shown) indicate that both BCC Mg/BCC Nb and HCP Mg/BCC Nb interfaces exist in this third nanocomposite, with the HCP Mg/BCC Nb interfaces being present in regions where the Mg layer thicknesses are the thickest (around h = 7.8 nm). This third nanocomposite is designated as 6.7 nm Mg/Nb nanocomposite.
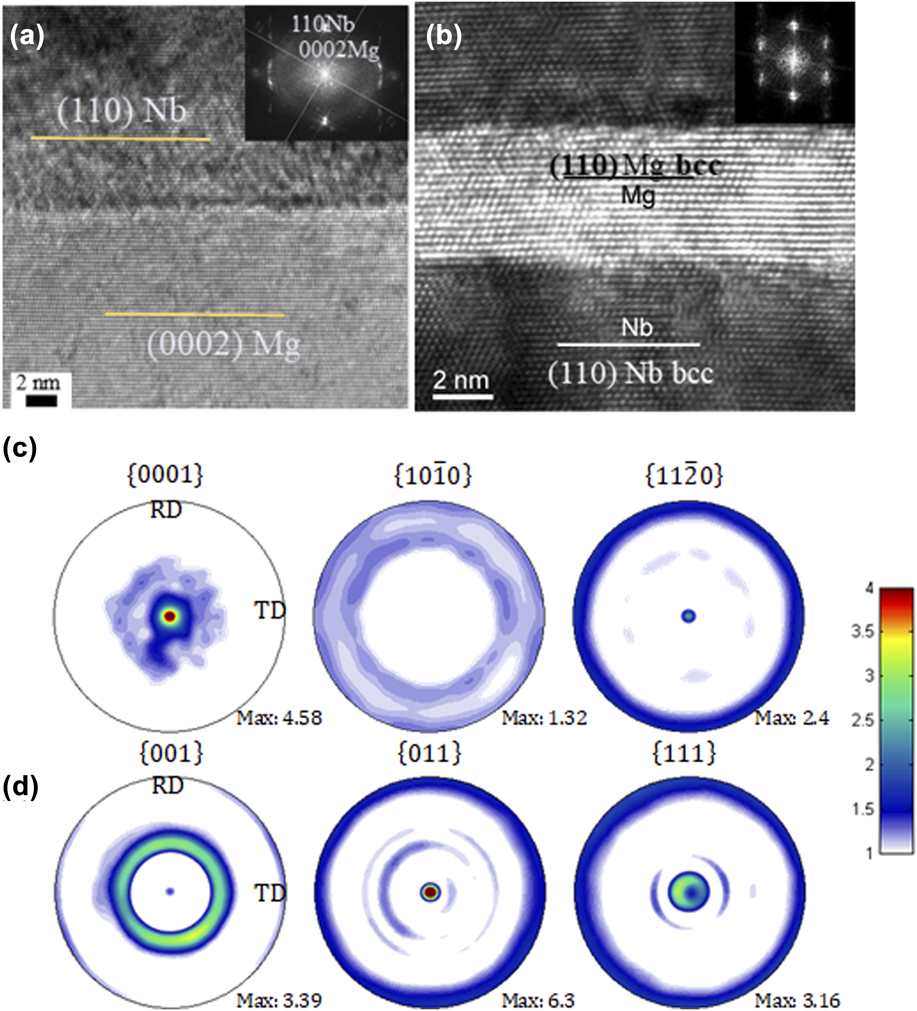
FIG. 1. (a) and (b) HR-TEM images taken for the (a) 50 nm/50 nm HCP Mg/BCC Nb and (b) 5 nm/5 nm BCC Mg/BCC Nb. Taken with permission from Ref. Reference Pathak, Velisavljevic, Baldwin, Jain, Zheng, Mara and Beyerlein29. Initial pole figures of the XRD measured textures of (c) HCP Mg (50 nm) and (d) BCC Nb (5 and 50 nm) and BCC Mg (5 nm). At 5 nm layer thickness, BCC Nb and BCC Mg have the same initial texture.
XRD analysis is also used on all the samples for texture measurement. Textures were measured on both the top or bottom surfaces of the samples using a Bruker/AXS diffractometer (Bruker, Karlsruhe, Germany) equipped with a general area detector diffraction system area detector, Co-Kα radiation (operating at 40 kV and 20 mA), and a graphite incident beam monochromatic to eliminate the Kβ line. The beam was collimated to a spot size of ∼1.0 mm. The Matlab toolbox software MTEXReference Hielscher and Schaeben45 was utilized to reconstruct the orientation distribution functions from the measured XRD pole figures with the crystallite orientation densities in 3D orientation space, defined by the Bunge-Euler angles φ1, Φ, and φ2.
Figures 1(c) and 1(d) show the measured XRD textures for the 50 nm/50 nm and 5 nm/5 nm Mg/Nb nanocomposites. In all the cases, the texture is strong and axisymmetric about the ND. For the 50 nm/50 nm Mg/Nb nanocomposite, the basal poles in the HCP Mg phase are highly aligned along the ND of the film. In the BCC Nb phase in this composite, the {011} poles are oriented along the ND. In the 5 nm/5 nm and 6.7 nm Mg/Nb nanocomposites, texture measurements show that the textures of the BCC Mg and BCC Nb phase textures are identical and very similar to the Nb phase texture in the 50 nm/50 nm nanocomposite. These textures are consistent with prior microstructural analyses of fully BCC Mg/Nb composites.Reference Junkaew, Ham, Zhang and Arróyave42,Reference Ham and Zhang46,Reference Junkaew, Ham, Zhang, Talapatra and Arróyave47 In other studies, however, the 5 nm/5 nm Mg/Nb composite was not fully BCC. Instead, there, finer h to 2.5 nm (with Nb at the same h) or 1.5 nm (with Nb at a smaller h) was needed to create the fully BCC Mg/BCC Nb composite.
Presuming that the Mg/Nb interface planes are nominally planar and hence the interface plane normals lie nominally parallel to the film deposition axis, the bulk texture result would suggest that the nanocrystalline HCP Mg and BCC Nb phases are joined at an interface with their {110}//{0001}. In the 5 nm/5 and 6.7 nm Mg/Nb nanocomposites, the BCC Mg and BCC Nb phases share the same orientations, and from this, it would be expected that the BCC Mg/BCC Nb interfaces are cube-on-cube, with all crystallographic planes and directions aligned on either side of the interface.
TEM analysis provides a closer look at the interface in these two types of Mg/Nb nanocomposites. The TEM images of the layered material and HR-TEM images of one typical interface are presented in Fig. 1. As shown, in the 50 nm/50 nm Mg/Nb nanocomposite, the hcp Mg/bcc Nb forms an interface that joins the {0001} Mg plane with the {110} Nb plane. The 〈1120〉 Mg is aligned with the 〈111〉 Nb. This crystallographic character would be associated with a semicoherent interface, described by a network of misfit dislocations separated by the coherent interface.Reference Chen, Shao, Liu, Yadav, Li, Mara and Wang48 The 5 nm/5 nm BCC Mg/BCC Nb forms a coherent, cube-on-cube interface. They are joined at their mutual {110} planes. This crystallographic interface character is similar to those found in other fully coherent BCC Mg/BCC Nb composites made by PVD reported in the literature.Reference Junkaew, Ham, Zhang and Arróyave42,Reference Ham and Zhang46
To determine the effect of layer thickness on strength, indentation hardness measurements were conducted on the three types of Mg/Nb nanocomposites. The hardness measurements were conducted using a diamond Berkovich tip using two nanoindentation machines—Hysitron Triboindenter™ and Agilent XP™. A total of 50 tests per sample were made in each nanoindenter machine using a 10 s (loading)–100 s (hold)–10 s (unloading) cycle. The longer hold time of 100 s was chosen to offset any potential creep effects after the high temperature exposures. Tests were conducted to a maximum displacement of 200 nm for the Hysitron Triboindenter™ (instrument limit) and up to a maximum displacement of 200 and 400 nm for the Agilent XP™. These choices of indentation depth ensured that in each case, the indenter was sampling regions within and beyond at least one bilayer thickness (2h). Figure 2 shows the hardness values plotted against the bilayer thicknesses (2h) for each Mg/Nb nanocomposites on a Hall–Petch type of plot. The hardness values of the Mg/Nb nanocomposites are outstandingly higher, over 10 times that of coarse-grained Mg or Nb, and approximately 2–3 times that of the volume average nanocrystalline Mg and Nb.Reference Youssef, Wang, Liao, Mathaudhu, Kecskés, Zhu and Koch49,Reference Popova, Popov, Romanov and Pilyugin50 Another important finding is that the hardness numbers are sensitive to 2h, continually strengthening as 2h decreases, at least down to 2h = 4 nm. It is noteworthy to mention that compared to prior results on PVD films,Reference Ham and Zhang46 the hardness values for the 5 nm/5 nm Mg/Nb nanocomposites reported in this work are considerably (around 47%) higher (see Fig. 2). As mentioned earlier, in the prior work, the Mg phase in the nanocomposites was not fully BCC Mg until h < 5 nm.
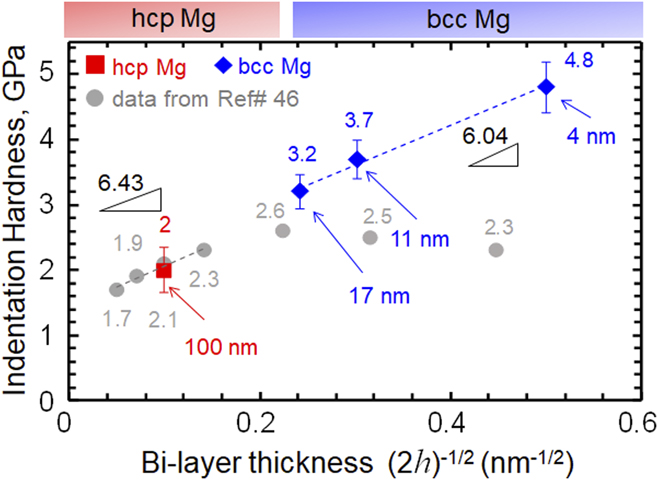
FIG. 2. Hall–Petch plot of indentation hardness with bilayer thickness. The diamonds represent the bilayer thicknesses of 17, 11, and 4 nm nanocomposites, respectively, which were all fully BCC Mg/Nb. The square data point represents the 100-nm thick bilayer composite which was fully HCP Mg/Nb. Data shown using circles were taken from Ref. Reference Ham and Zhang46.
As can be seen in Fig. 2, the strengthening slope for hcp Mg/Nb nanocomposites was calculated to be 6.43 GPa nm1/2, which is similar to the strengthening slope of 6.04 GPa nm1/2 in bcc Mg/Nb nanocomposites. These results indicate that by enabling an hcp → bcc phase transition in Mg, we are able to increase the strength of the composite to levels that have not been achieved in Mg/Nb nanocomposites before. Additionally, the hcp → bcc transition is able to delay the plateau region (which has been reported to occur at layer thicknesses of 2h ≈ 20 nm or below in Mg/Nb nanocompositesReference Ham and Zhang46) in the hardness values for the Mg/Nb nanocomposites reported in this work, thus allowing them to continue hardening with decreasing layer thicknesses at least down to 2h = 4 nm. These values also compare favorably to that of polycrystalline (nonlaminated) Mg, with grain sizes ranging from 4 to 450 µm, where the Hall Petch slope has been found to vary between k y = 1.9–9.3 GPa nm1/2.Reference Yu, Xin, Wang and Liu51–Reference Cordero, Knight and Schuh54
III. DEFORMATION RESPONSE
To investigate the effect of the phase on the deformation properties, micropillar compression experiments were carried out on the 50 nm/50 nm and 5 nm/5 nm Mg/Nb nanocomposites. The mechanical responses of the Mg/Nb nanocomposites were investigated in two loading directions, with compression applied normal and parallel to the Mg/Nb interface planes. The micropillars were fabricated on a dual beam FEI Helios™ FIB SEM, using a beam of Ga+ ions to remove the material and shape it in pillar form. The micropillars fabricated in the normal orientation had a circular cross-section with a height-to-diameter ratio of around 2:1 (5 µm:2.5 µm) and around six degrees of vertical taper. Due to the taper, the diameter measured at the pillar top (the smallest measurement) was used for stress calculations. A total of 4–5 pillars of each of the 50 nm/50 nm and 5 nm/5 nm Mg/Nb nanocomposites were tested in microcompression. The tapering in the micropillars of circular cross-section could have an effect on their hardening response in compression. To check the effect of tapering, a limited number of additional experiments were conducted using micropillars of square cross-section, which had zero taper and a similar cross-sectional area as the circular micropillars. No significant difference was noted in the hardening responses between either pillar shapes. All remaining compression experiments normal to the Mg/Nb interface planes were conducted on micropillars of circular cross-section (since they are faster to mill using the FIB as compared to micropillars of square cross-section). All the micropillars fabricated in the parallel orientation had a square cross-section with a similar 2:1 height-to-width ratio without any taper. The length of the square cross-section was 4.5 µm and the height was 10 µm.
The above pillar dimensions were specifically chosen to be large enough so that the effects of any FIB-induced damage can be minimized. Earlier experimentalReference Gao and Bei55 and computationalReference El-Awady, Woodward, Dimiduk and Ghoniem56 studies have suggested that the effect of any FIB-altered microstructure on micropillar plasticity is negligible for pillar diameters larger than 1 µm. The dimensions of the micropillars shown in this work are well above the critical size of 1 µm described in the earlier reportsReference Gao and Bei55,Reference El-Awady, Woodward, Dimiduk and Ghoniem56 for FIB-induced plasticity changes. Additional tests (unpublished results) were also conducted on varying pillar diameters in the range of 2–4.5 µm to check for the effects of pillar size on the mechanical properties. The results from these tests were comparable to those shown in the current work, suggesting that there is no appreciable size effect for the dimensions of the Mg/Nb multilayered micropillars shown in this work.
In situ uniaxial compression tests were conducted to capture the local microstructural evolution during deformation. The nanomechanical instrument used is comprised of a nanomechanical tester (Hysitron PI-85™) inside of a SEM (FEI Magellan™). The pillars were compressed with a flat punch conductive diamond tip of 20 µm diameter and at a nominal displacement rate of 2 nm/s.
A. Compression normal to the Mg/Nb interfaces
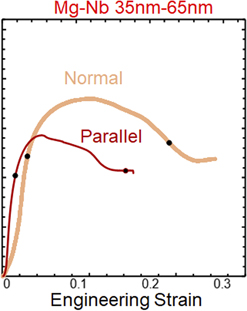
Figure 3 shows the engineering stress–strain curves obtained from the micropillar compression tests in which the interface normal is aligned with the loading direction (see the inset in Fig. 3). Two representative stress–strain curves for each layer thickness are shown in Figs. 3(a) and 3(b), demonstrating the excellent repeatability of the results. Comparing the two samples, the results revealed that BCC Mg in the nanocomposite is 50% stronger and has a higher strain to failure than its HCP counterpart (see Fig. 2). In situ observations during the compression tests show that the 50 nm/50 nm Mg/Nb nanocomposite failed by shear localization, whereas the 5 nm/5 nm Mg/Nb nanocomposite did not. In the former, when the peak stress is reached, a shear band has already formed in the lower half of the pillar and propagated across the diameter.

FIG. 3. Comparison of the engineering stress–strain responses between (a) Mg/Nb 5 nm/5 nm and (b) Mg/Nb 50 nm/50 nm multilayered nanocomposites with interfaces oriented normal (isostress) and parallel (isostrain) to the loading direction. (c) and (d) Two SEM images for each combination of layer thickness and orientation are shown below the stress–strain graphs displaying the pillar deformation at yield and after instability, [as indicated by the black dots on the stress–strain graph in (a)].
Post-mortem TEM analysis was carried out on the deformed 50 nm/50 nm and 5 nm/5 nm Mg/Nb nanocomposite micropillars. The compressive direction is normal to the Mg/Nb interfaces, and the strain level is 22% for 5 nm/5 nm and 19% for 50 nm/50 nm pillars. TEM foils were prepared from the central regions of the micropillars using FIB. The final cleaning step was performed with a beam current of ∼50 pA and a voltage of 8 keV, which is expected to minimize the Ga+ FIB-induced damage. An FEI Tecnai F30 field emission gun TEM was used for the analysis.
Figure 4(a) shows the deformed 50 nm/50 nm Mg/Nb micropillar in the normal orientation. The dark layers in the TEM image correspond to Nb and light layers correspond to the Mg phase. A shear band is seen to have developed in the micropillar when the strain goes beyond 10%. The nominal plane of the shear band is closely aligned with the (2-1-14) plane in Mg. To assess co-deformation between the Mg and Nb layers, the average bilayer thickness was also measured as a function of the distance to the substrate. At the top region of the pillar, the average bilayer thickness was found to have the minimum value and uniform compression deformation was found to occur in this region. At the edge of the pillar, there is no indication of extrusion of the Mg phase from the surface. Also, the Mg and Nb phases co-deformed before commencement of the shear band. No deformation twins were found in the Mg/Nb micropillars from the post TEM analyses.
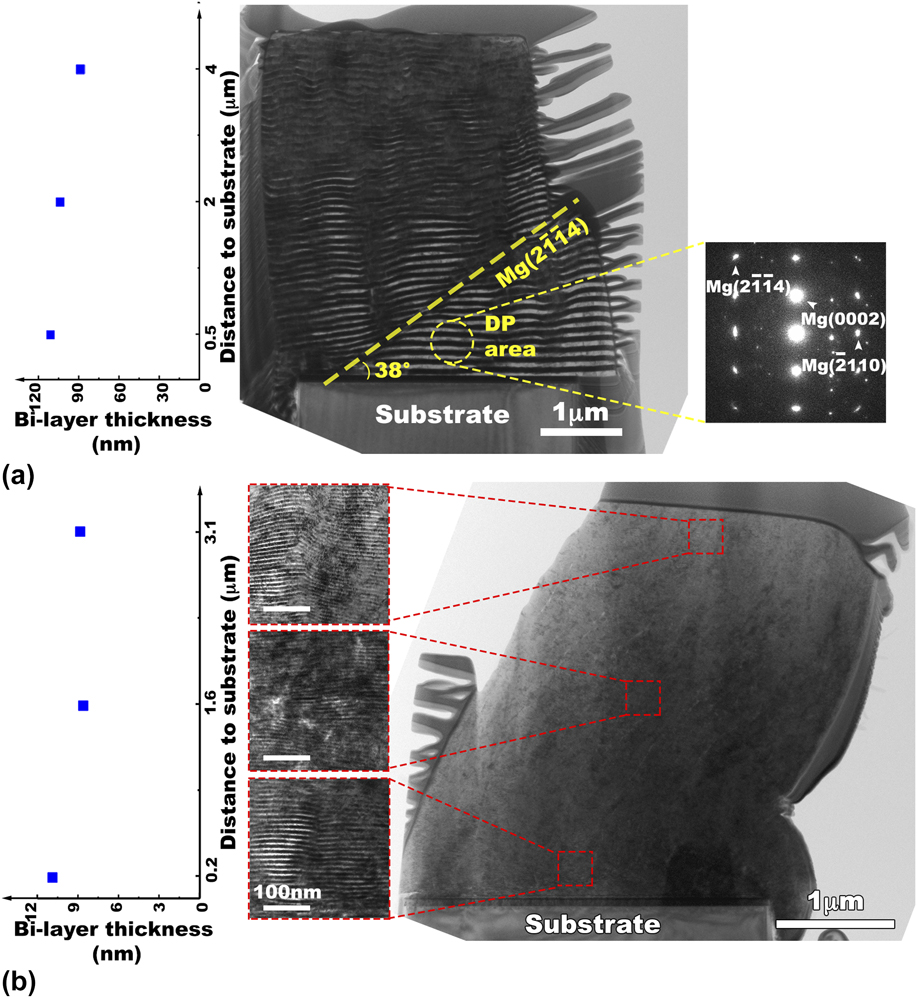
FIG. 4. TEM images after deformation of the (a) 50 nm HCP Mg/BCC Nb pillar and (b) 5 nm BCC Mg/BCC Nb pillar. The protruding parts in (a) are a result of TEM sample preparation. We note that in the in situ analysis during micropillar deformation that neither phase extruded.
Pure Mg, as a coarse-grain polycrystal, is known to deform by slip and deformation twinning and to have limited ductility and small strains to failure in compression, e.g., <10% at room temperature. Nanoscale HCP Mg, however, does not twin as readily and could have larger strains to failure than coarse grained Mg.Reference Yu, Qi, Mishra, Li and Minor57 Thus, the present observation of slip-dominated deformation in both types of composites is consistent with prior reports of nanoscale hcp Mg.Reference Zhu, Liao and Wu58,Reference Lentz, Risse, Schaefer, Reimers and Beyerlein59 For comparison, Fig. 4(b) shows a TEM image of a 5 nm/5 nm BCC Mg/Nb micropillar after deformation to 22% strain in the normal orientation. The morphology of three different locations (top, middle, and bottom of the pillar) has been magnified, and the correlated average bilayer thickness has been measured and plotted on the left. Again, the key observations are the co-deformation of the Mg and Nb phases and no deformation twinning. Taken together, the analysis suggests that the nanocomposite deformation was dominated by crystallographic slip in the layers.
B. Compression parallel to the Mg/Nb interfaces
Figure 3 also shows the stress–strain curves measured from micropillar compression testing parallel to the Mg/Nb interfaces. For both 50 nm/50 nm and 5 nm/5 nm Mg/Nb nanocomposites, the flow stress in the interface-parallel loading direction is lower than in the interface-normal direction (see Table I). As in the normal loading configuration, the flow response of the BCC Mg/Nb composite is higher than that of the HCP Mg/Nb composite. However, the difference in compression peak strength between the 5 nm/5 nm versus 50 nm/50 nm Mg/Nb nanocomposites is not as great in the parallel configuration (peak stresses of 1.62 GPa versus 1.46 GPa) as it is in the ND (peak stresses of 2.48 GPa versus 1.8 GPa, see Table I). Also, the compression strain to reach the peak stress is nearly the same (∼0.06 versus 0.04). Lastly, the plastic anisotropy as measured by the difference in the parallel and normal layer cases for the same composite is higher than in the BCC Mg/Nb case than in the HCP Mg/Nb case. This last aspect may be counterintuitive as BCC metals typically are less plastically anisotropic than HCP metals.
TABLE I. Comparison of the micropillar compression response between 50 nm/50 nm and 5 nm/5 nm Mg/Nb nanocomposites in normal and parallel loading directions.
In the 50 nm/50 nm Mg/Nb nanocomposite, the softening occurred due to the onset of kink banding. The fully developed kink band can be seen at the bottom of the pillar in Fig. 3(d). Kink banding has been previously observed in layer parallel compression tests on accumulative roll-bonded Cu–Nb nanolayered composites.Reference Nizolek, Mara, Beyerlein, Avallone and Pollock60 In these earlier studies, Cu–Nb samples of all layer thicknesses from h = 15–250 nm failed by kink banding and the finer h, the lower the strain to initiate kink banding. It was proposed that the strongly textured layers lead to the highly anisotropic properties of this material, which is a characteristic of materials that tend to fail by kink banding.Reference Nizolek, Begley, McCabe, Avallone, Mara, Beyerlein and Pollock61 A similar anisotropy-induced argument could also be made for the 50 nm/50 nm Mg/Nb nanocomposite, where loading in the parallel direction exposes the plastic anisotropy of the highly textured (epitaxial) HCP Mg phase and the Mg/Nb layering. No such kink banding or pronounced softening, however, was seen in the 5 nm/5 nm Mg/Nb nanocomposite micropillars. In this case, the plastic anisotropy is greatly reduced since both Mg and Nb are BCC, and BCC phases tend to be less plastically anisotropic. Following the argument of anisotropy-induced kink banding, the texture BCC Mg and Nb phases were evidently not sufficiently anisotropic to trigger kink banding.
IV. DEFORMATION MECHANISMS
Knowledge of the deformation mechanisms is critical for understanding the various aspects in the flow responses of these two materials, bearing different crystal structures of Mg, and for potential employment of pseudomorphic phase-based materials in structural applications. Deformation mechanisms in nanolayered composites deformation include dislocation slip and interfacial sliding. Thus far, the analysis of the 50 nm/50 nm and 5 nm/5 nm Mg/Nb nanocomposites suggests that deformation occurred by plasticity in the layers and not by interfacial slip. The decreasing strain hardening rate with strain in each micropillar deformation curve in Figs. 3(a) and 3(b) suggests that the curves were mediated by dislocation glide. As a further support, the TEM analysis of the samples deformed in compression normal to the layers did provide evidence of co-deformation and did not provide evidence of twinning or interfacial slip.
By itself, the experimental analysis from micropillar compression tests and TEM analysis provided above is inadequate for explaining fully the operative mechanisms underlying the observations. Furthermore, the two materials tested here differ in many aspects—not just in the crystal structure of the Mg phase—that can affect dislocation motion, and hence strength and deformation flow response. They differ in elastic modulus, lattice parameter, layer size, slip modes, grain shape (aspect ratio of 1:2 versus 1:20), interface structure (coherent versus semicoherent), and texture.
To complement the effort toward understanding the deformation mechanisms in BCC Mg, we carry out CPFE simulations of the composite compression tests. CPFE is a 3D, spatially resolved full-field model. In this class of model, the inter- and intragranular, as well as the inter- and intralayer stress and strain fields, are calculated, and at each interior point in the grain, plastic deformation is based on the underlying activity of different crystallographic slip modes (or slip families).
For these CPFE calculations, it is necessary to specify a priori the slip and twin families on which slip is expected to occur. DFT is used as a way of determining the favored slip families in BCC Mg. However, DFT does not provide information on the slip strengths in BCC Mg. One of the valuable outputs of the CP calculations is the values for these CRSS values that reproduce the composite stress–strain curves from the micropillar tests. These two methods and their results, on the favored slip families (from DFT) and corresponding slip strengths (from CPFE), are discussed in turn below.
A. DFT calculations
While the preferred slip systems in HCP Mg and BCC Nb are known, they are not known in BCC Mg. The favored modes of crystallographic slip strongly depend on the particular electronic and atomic structure of the material and, hence, those for BCC Mg should be distinct from HCP Mg.
It may be possible to evaluate dislocation nucleation, propagation, and other elementary processes via atomic-scale MD simulations, provided that the interatomic potentials exist. This is the case for HCP Mg and BCC Nb existence.Reference Zhang, Wang, Beyerlein and Germann62,Reference Kumar, Morrow, McCabe and Beyerlein63 However, a reliable interatomic potential for BCC Mg is not presently available in the literature.
As a way of identifying the preferred slip modes in BCC Mg and propensity for interfacial sliding along the BCC-Nb‖BCC-Mg and BCC-Nb‖HCP-Mg interfaces, we consider calculations by DFT of the generalized stacking fault energy (GSFE) curve, associated with shearing along these specific crystallographic planes and directions. The GSFE surface is the excess energy per unit area for a given relative displacement vector u of one half of the crystal with respect to the other half when a perfect crystal is cut across the slip plane into two parts.Reference Lu, Kioussis, Bulatov and Kaxiras64 While this DFT calculation does not model explicitly dislocation glide, the GSFE provides a calculation of the variation in energy corresponding to the shearing action caused by the glide of a dislocation on specific crystallographic planes. Furthermore, from these calculations, estimates can be attained for the ideal shear stress (ISS) associated with shearing on a given slip system in BCC Mg.Reference Vítek65,Reference Frenkel66 The idea is that more likely slip modes on which dislocations would glide in the actual BCC Mg phase would tend to possess the lower values of ISS.
In the DFT calculations performed here, we used the generalized gradient approximation for the exchange correlation functional with the Perdew–Becke–Erzenhof parameterization.Reference Perdew, Burke and Ernzerhof67 The interaction between valence electrons and ionic cores is treated using PAW potentials. The number of valence electrons in Mg potential that we have taken is 2 and in the Nb potential is 13. We selected a plane wave energy cutoff of 400 eV and optimized the structure until the force on each atom is smaller than 0.01 eV/A. A 19 × 19 × 19 Gamma-centered Monkhorst Pack k-point mesh is used to integrate the Brillouin zone of the primitive HCP and BCC unit cells of Mg and Nb to calculate the structural parameters. Table II shows the calculated lattice constants and elastic constants from DFT for the following phases: BCC-Nb, HCP-Mg, and BCC-Mg. As a check of consistency, these values are in good agreement with previous DFT calculations and experimental measurements.Reference Sin’ko and Smirnov68–Reference Slutsky and Garland71
TABLE II. Calculated values for the lattice and elastic constants (in GPa) for the bulk BCC-Nb, HCP-Mg, and HCP-Nb obtained from DFT.
Model set up entails defining the supercell dimensions and these are chosen based on the minimum number of layers along the z direction for which convergence in system energy is attained. For the GSFE calculation for BCC Mg, the periodic model for the (110) slip plane contains 48 atoms and its dimensions are 3.57 Å along x, 5.06 Å along y, and 75.66 Å along the z direction. The periodic model for the (112) slip plane also contains 48 atoms and its dimensions are 5.06 Å along x, 3.10 Å along y, and 85.04 Å along the z direction. Both supercells contain a thick vacuum layer of 15 Å along the z direction. For HCP Mg, the periodic model for the basal slip plane contains 52 atoms and its dimensions are 3.19 Å along x, 5.53 Å along y, and 77.17 Å along the z direction. For the prismatic slip plane, the periodic model contains 48 atoms and its dimensions are 3.19 Å along x, 5.18 Å along y, and 81.33 Å along the z direction. For the pyramidal-I 〈c + a〉 slip plane, it contains 64 atoms and its dimensions are 3.19 Å along x, 11.75 Å along y, and 56.49 Å along the z direction. Last, for the pyramidal-II slip plane, it contains 60 atoms and its dimensions are 5.53 Å along x, 6.09 Å along y, and 51.49 Å along the z direction. All these supercells contain a thick vacuum layer of 15 Å along the z direction.
For all GSFE calculations, the relaxed method described in Ref. Reference Kumar, Kumar and Beyerlein72 was used. The upper half of the crystal is shifted with respect to the lower half of the crystal along the glide direction in small displacement steps, and at each displacement, the energy of the system is minimized by fixing all atomic positions along the glide direction and allowing positions in the z direction and along the direction lying normal to the glide direction to relax.
The calculated GSFE curves for the slip systems in BCC-Mg are shown in Fig. 5(a). The GSFE curves for shearing the  $\left\{ {1\bar{1}0} \right\}$ and $\left\{ {1\bar{1}2} \right\}$ planes in the 〈111〉, 〈110〉, and 〈001〉 directions in BCC Mg finds that the two systems with the lowest ISS are the $\left\{ {1\bar{1}0} \right\}$ and $\left\{ {1\bar{1}2} \right\}$ planes in the 〈111〉. The peak energies achieved as the planes shift from one stable state to another were very close, respectively at 161 mJ/m2 and 183 mJ/m2. Thus, as in conventional BCC metals, these two slip systems also are likely in BCC Mg.
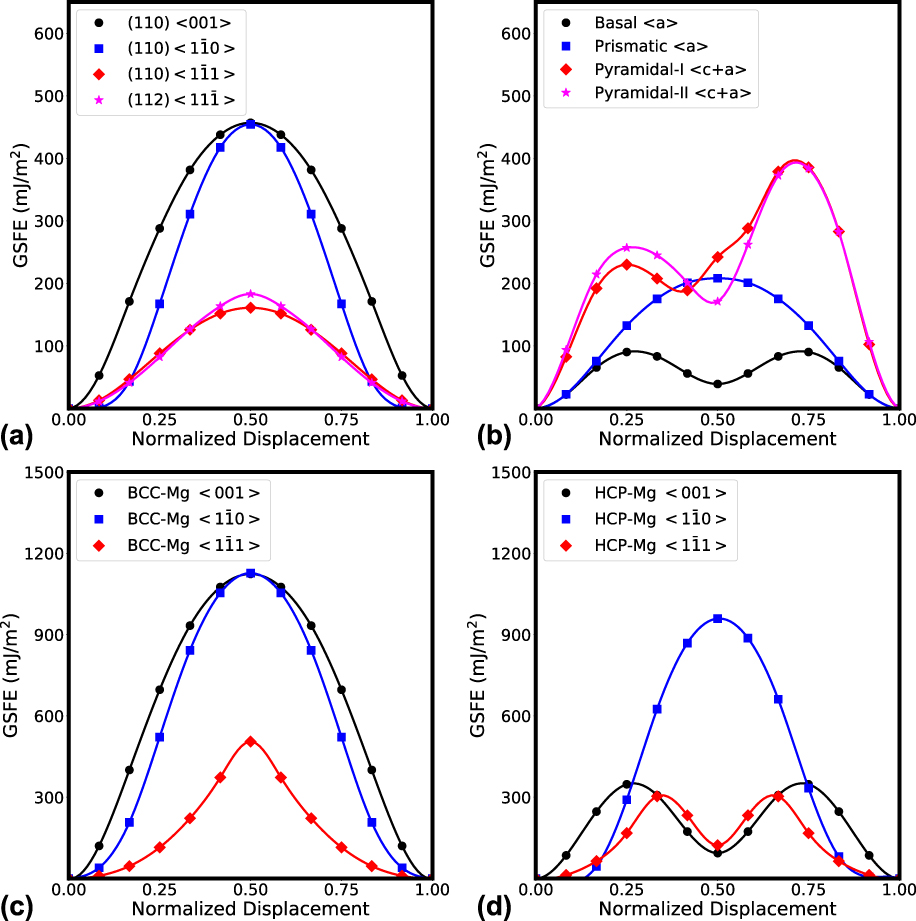
FIG. 5. Calculated GSFE curves from first-principles DFT method. (a) GSFE for slip systems within bulk BCC-Mg; (b) GSFE for slip systems within bulk HCP-Mg; (c) GSFE in the BCC-Nb‖BCC-Mg interface plane; (d) GSFE for slip in the BCC-Nb‖HCP-Mg interface plane. The glide directions for the interface plane in (c) and (d) are chosen with respect to crystallographic directions of BCC-Nb in the bilayer systems.
To gain some insight into the relative strengths of slip in BCC Mg compared to HCP Mg, the calculation is repeated for the common slip modes in HCP Mg. For HCP Mg, the preferred slip modes correspond to four slip planes: basal 〈a〉, prismatic 〈a〉, pyramidal-I 〈c + a〉, and pyramidal-II 〈c + a〉 slip. The calculated GSFE curves for these slip modes are shown in Fig. 5(b). It is found that the ISS for basal slip, the easiest slip mode basal slip in HCP Mg, is lower than the ISS for the easiest slip modes in BCC Mg, {110} and {112}. There is an even smaller difference between the ISS values for {110} and {112} slip in BCC Mg, with the former being slightly easier.
Finally, to understand how the BCC Mg ISS values compare to those for interfacial shearing, the same methodology is used to study the GSFE curves for slip at the Mg/Nb interfaces in DFT. The biphase supercells consisting of 48 atoms (24 Nb and 24 Mg) are shown in Figs. 6(a) and 6(b). These supercells are periodic along both the x and y directions. For the BCC-Nb‖BCC-Mg (cube-on-cube) interface, the crystallographic (110) plane of Nb is parallel to the (110) plane of Mg, and 〈001〉 direction in Nb is parallel to 〈001〉 direction in Mg [Fig. 6(a)]. For the BCC-Nb‖HCP-Mg interface, crystallographic (110) plane of Nb is parallel to the (0001) plane of Mg, and 〈001〉 direction in Nb is parallel to  $\left\langle {1\bar{2}10} \right\rangle$ direction in Mg [Fig. 6(b)]. To make these two BCC crystals coherent at their common plane, we applied equal and opposite strains in the x and y directions for both the Nb and Mg layers.
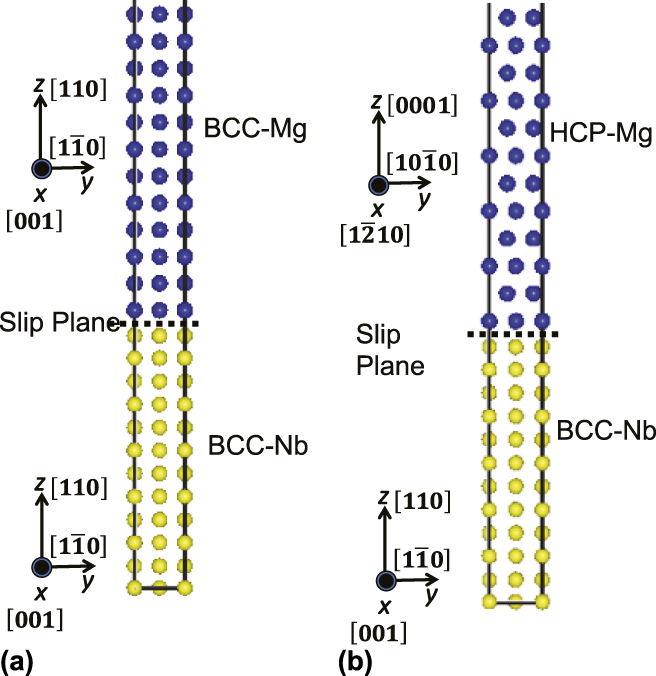
FIG. 6. The crystallographic orientation of the bilayer models to study the GSFE curve for slip systems at the (a) BCC-Nb‖BCC-Mg interface and (b) BCC-Nb‖HCP-Mg interface.
Figures 5(c) and 5(d) present the relaxed normalized GSFE curves for the slip modes in the BCC-Nb‖BCC-Mg interface and the BCC-Nb‖HCP-Mg interface. From these curves, the ISS can be calculated.Reference Kumar, Morrow, McCabe and Beyerlein63,Reference Ardeljan, Savage, Kumar, Beyerlein and Knezevic73,Reference Joós and Duesbery74 Table III shows the corresponding ISS values for each slip mode and for interface shearing in three in-plane directions of the BCC-Nb‖BCC-Mg interface and the BCC-Nb‖HCP-Mg interface. The values for ISS resisting interfacial shearing are much higher than those for slip, suggesting that slip would be the preferred mode of deformation of these nanolaminates.
TABLE III. Calculated lowest peak on the GSFE curve and corresponding ISS value for slip systems in the bulk bcc-Mg, hcp-Mg; and for the slip system at the interface plane for BCC-Nb‖BCC-Mg and BCC-Nb‖HCP-Mg bilayer systems.
B. CPFE modeling method
To help relate the particular plastic deformation mechanism to flow responses of nanocomposites containing either HCP Mg or BCC Mg, a model of the Mg/Nb nanolayered composites using a CPFE framework is built. The same CPFE models for the normal and parallel micropillar tests are applied.
The initial microstructure for the CPFE calculations was set as close as possible to that of the PVD samples. Figure 7 shows the representative volume, which is the meshed bilayer of Mg and Nb for the 50/50 nm sample and 5/5 nm sample. Both CPFE models are divided into two equal sections/volumes that represent a layer of the Mg bonded to a layer of Nb. Both layers are polycrystalline in plane and single crystalline through thickness; that is, one grain spans the layer thickness. Separate FE grain microstructure meshes were generated to reflect the different aspect ratios of the 50/50 nm and 5/5 nm samples. In the 50/50 nm model, the grains are nearly equiaxed with grain 50 nm thick and 100 nm wide. In the 5/5 nm model, however, while the thickness is reduced from 50 to 5 nm, the same grain size and shape in the plane of the layers is retained.
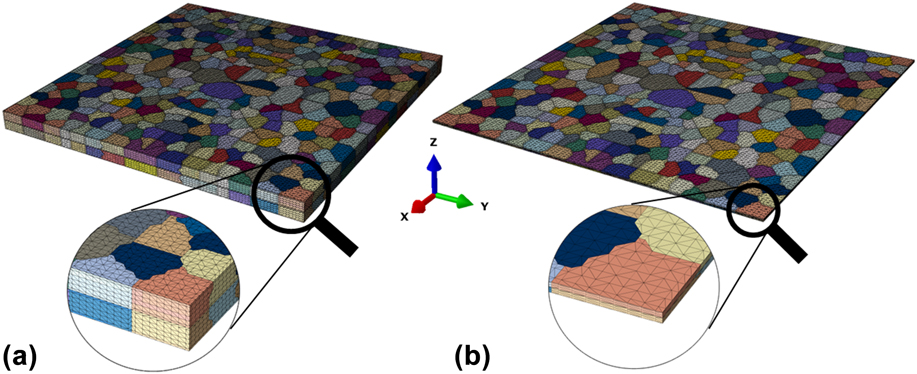
FIG. 7. The CPFE model meshes for the (a) 50–50 nm Mg/Nb composite and (b) 5–5 nm composite. Each model contains one layer each of Mg and Nb. Bottom images show zoomed-in view of the microstructures indicating different grain aspect ratios.
Grain orientations were randomly selected from the initial measured texture (Fig. 1). For the 50–50 nm model, grains in the Mg phase and the Nb phase were assigned orientations randomly selected from their corresponding measured textures taken from the as-fabricated 50–50 nm composite. For the 5–5 nm model, the Mg and Nb phases had the same texture. Mg and Nb grain pairs joined by their mutual interface plane (011) were given the same orientation, producing a cube-on-cube orientation relationship. For the 50–50 nm, Mg and Nb grain pairs shared a common {0001}‖{011} interface plane.
In both FE bilayer models, the grain microstructure is periodic. The FE meshes consist of roughly 1 million and 435,000 C3D4 (continuum three-dimensional four-nodal) elements, in the 50–50 nm and 5–5 nm cases, respectively. In both models, each layer consists of exactly 267 grains (total 534 grains in both layers).
With this model, simple compression deformation is simulated as an idealization of the stress state imposed on the micropillar compression tests. We use periodic boundary conditions, wherein the deformation of each pair of boundary faces (top/bottom, front/back, and left/right) is equal and as a result, the stress tensors on each pair are opposite in sign. The simple compression boundary conditions are prescribed by specifying the displacement along the loading direction [negative z-direction—normal case (loading axis is normal to the Mg/Nb interfaces), negative x-direction—parallel case (loading axis is parallel to the Mg/Nb interfaces)], while the lateral faces were kept free to expand.
The constitutive law used at every integration point in these two model microstructures accounts for both elastic anisotropy and plasticity by crystallographic slip. The CP-based formulation used in CPFE is given in many prior studies.Reference Ardeljan, Savage, Kumar, Beyerlein and Knezevic73,Reference Knezevic, Drach, Ardeljan and Beyerlein75–Reference Ardeljan, Beyerlein and Knezevic77 Below special treatment of elastic and plastic behavior is extended to reflect the BCC or HCP crystal structure of Mg and also to treat the interface-affected resistance to dislocation glide characteristic of motion within confined nanoscale layers.
1. Elasticity
For the Mg/Nb composites, the elastic constants for the Mg and Nb phases were assigned their bulk values. For HCP Mg, they are C 11 = 59.5 GPa, C 12 = 26.1 GPa, C 13 = 21.8 GPa, C 33 = 65.6 GPa, and C 44 = 16.3 GPaReference Slutsky and Garland71 and for BCC Nb, they are C 11 = 267 GPa, C 12 = 134 GPa, and C 44 = 28.7 GPa.Reference Bolef78 For the 5–5 nm, elastic modulus measurements of 5 nm Mg and 5 nm Nb in this composite do not exist to our knowledge.
Since our interest lies in the active deformation mechanisms during plastic deformation, we made a reasonable guess for the elastic response of this nanolayered composite. First, the BCC Nb phase is presumed to possess the same elastic properties as bulk Nb. Second, we assumed the BCC Mg phase exhibited cubic elastic anisotropy, which includes three independent elastic constants. Next, we fit the elastic portion of the composite response to microcompression tests made normal, parallel (Fig. 3), and 45° from the interface plane.Reference Knezevic, Drach, Ardeljan and Beyerlein75 Note that a detailed analysis of the experimental results from the compression tests with the loading axis inclined 45° to the Mg/Nb interfaces is not presented here; only the elastic segments of these tests are used in the calculation of the elastic constants.
A comparison of the pillar compression tests and model calculation are shown in Figs. 8(a) and 8(b) for the 50 nm composite and Figs. 8(c) and 8(d) for the 5 nm composite. The good agreement achieved by the model for the 50 nm composite serves as validation; no fitting constants were used in this case since the elastic moduli for HCP Mg and BCC Nb are known.
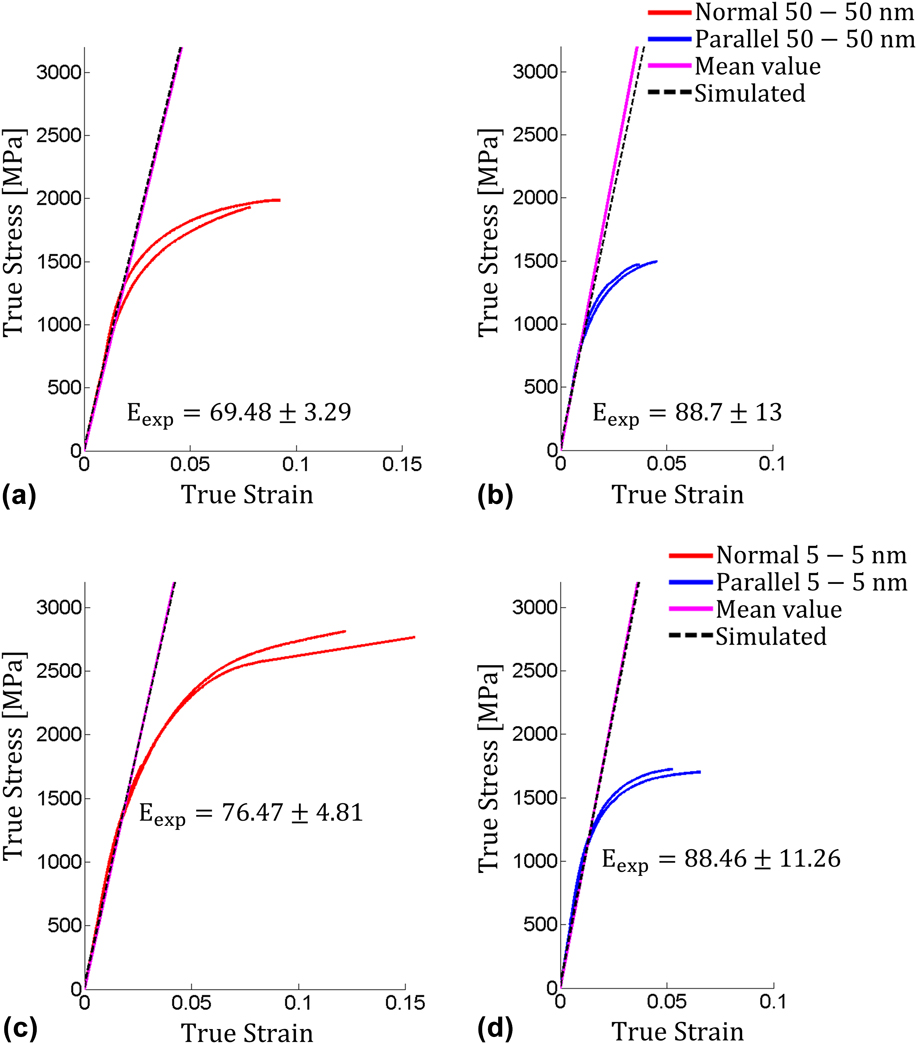
FIG. 8. Comparison between the measured true stress–true strain HCP Mg/BCC Nb micropillar compression responses and simulated elastic responses for 50/50 nm composites for (a) normal and (b) parallel cases. Comparison between the measured true stress–true strain BCC Mg/BCC Nb micropillar compression responses and simulated elastic responses for 5/5 nm composites for (c) normal and (d) parallel cases.
For the 5 nm case, the agreement is also good [Figs. 8(c) and 8(d)]. This approach produces an estimate for the elastic constants of BCC Mg to be C 11 = 65 GPa, C 12 = 35 GPa, and C 44 = 22.5 GPa. These values are based on the assumption that the Nb retained its bulk elastic properties. If the elastic properties of the nanolayer Nb phase have been altered, then the same modeling technique introduced here can still be used by would give different estimates for the elastic constants of BCC Mg.
2. Plasticity
The CPFE model introduces a constitutive law wherein the plastic part is governed by crystal plasticity. For the latter, two pieces of information must be specified: the slip and twin families on which slip is expected to occur and the slip strengths, or the CRSSs, to activate slip on these slip families.
The slip families made available to the CPFE model are different for HCP Mg, BCC Nb, and BCC Mg. HCP Mg generally deforms by slip and twinning.Reference Beyerlein, McCabe and Tomé32,Reference Proust, Tomé, Jain and Agnew33,Reference Christian and Mahajan79–Reference Yoshinaga, Obara and Morozumi82 As discussed earlier, the three main slip modes made available for HCP Mg are basal 〈a〉 slip, prismatic 〈a〉 slip, and pyramidal 〈c + a〉 {1122}〈1123〉 slip. In the present case, deformation twinning was not detected via post mortem TEM analysis and as mentioned, the stress–strain curves did not exhibit the usual signs of twinning. It is unlikely that twinning occurs frequently and even though discrete twin lamellae could be modeled explicitly,Reference Ardeljan, Beyerlein, McWilliams and Knezevic34,Reference Ardeljan, McCabe, Beyerlein and Knezevic83 the present calculations do not consider twinning. To model BCC Nb, the two slip modes made available are {110}〈111〉 slip and {112}〈111〉 slip. Based on the DFT results, these two slip modes would be preferred in BCC Mg.
As mentioned, the plasticity portion of the constitutive law used in CPFE requires either CRSS values or a model for the evolution of the CRSS values with strain to activate slip. These threshold values to activate glide on individual slip modes α have two primary contributions: a friction stress  $\tau _0^\alpha$, which is independent of the interactions with other dislocations and the interfaces, and another component, which is dependent on them $\tau _{{\rm{disl}}}^{\rm{\alpha }}\left( {{h^{\rm{\alpha }}}} \right)$, giving the following:
 $$\tau _{\rm{c}}^\alpha = \tau _0^\alpha + \tau _{{\rm{disl}}}^\alpha \left( {{h^\alpha }} \right)\quad .$$
 In conventional models, the resistance  $\tau _{{\rm{disl}}}^\alpha \left( {{h^\alpha }} \right)$ depends on how dislocations move and accumulate in the layers. It is common to represent dislocation accumulation as being uniform across a grain or layer. In the present case, however, the interfaces are spaced sufficiently close, <50 nm, which is only one order of magnitude from the dislocation core. At this scale, dislocations do not accumulate uniformly within the layers, making it less accurate to not consider how they glide or their proximity to the nearby interfaces. The interfaces confine the movement of the dislocations, forcing them to thread through the layers, depositing in the interfaces as they pass by.Reference Misra, Hirth and Hoagland84–Reference Embury and Hirth87 Thus, the movement of dislocations in the layers and their local interactions with the interface should, as close as possible, be treated individually and discretely in the model.
In this work, the picture of threading dislocation motion is adopted in the CLS model. A threading dislocation can experience a resistance to slip  $\tau _{{\rm{CLS}}}^\alpha$ that increases as the layer thickness h decreases.Reference Misra, Hirth and Hoagland84,Reference Misra, Verdier, Kung, Embury and Hirth85 The increasing difficulty to glide as size h reduces provides a direct size effect to slip resistance. Derivation of $\tau _{{\rm{CLS}}}^\alpha$ is based on continuum dislocation theory and applies at the nanoscale inside an individual layer, where a single dislocation moves. In the conventional application of the CLS law, the CLS size effect is usually directly translated to explain the size effect in the macroscopic strength or hardness of the nanolayered composite.Reference Misra, Hirth and Hoagland84–Reference Embury and Hirth87
In this work, however, the CLS model is applied to redefine the CRSS used for every slip system operating at an integration point in the CPFE model. The generalized form of the CLS model used here is given by
 $$\tau _{{\rm{disl}}}^\alpha \left( {{h^{\rm{s}}},\alpha ,s} \right) = \tau _{{\rm{CLS}}}^\alpha \left( {{{{h^{{\rm{s'}}}}} \over {{b^\alpha }}}} \right) = {A^\alpha }{{{\mu ^\alpha }{b^\alpha }} \over {{h^{{\rm{s'}}}}}}\ln \left( {{{c{h^{{\rm{s'}}}}} \over {{b^\alpha }}}} \right) + {{{f^\alpha }{b^\alpha }} \over {{h^{{\rm{s'}}}}}}\quad ,$$
where h s′ is the distance along the slip plane of slip system s from one interface to the next. Thus, h s′ depends on the orientation of the crystal with respect to the interface normal and the layer thickness h. Hereinafter, we drop the superscript α and s on variables h′, A, and f.
The original CLS model of Ref. Reference Misra, Hirth and Hoagland84 is still largely intact in Eq. (3) and minor modifications are made, such as the removal of the Taylor factor M and the logarithmic energy prefactor dependent on the screw/edge character. We also have made parameters  $\tau _0^\alpha$, A α, and f α dependent on slip family α, and the particular interface and dislocation that are interacting. The core cut-off parameter c ranges from unity to $\sqrt 2$ and is set to unity in the calculations below. To be consistent with previous studies that have applied the CLS model to multilayers, the expected order of magnitude for $\tau _0^\alpha$ is 10–100 MPa, for A α is 10−2 to 10−1, and for f αb is 1–3 J/m2.
The first term  $\tau _0^\alpha$ depends on the slip family and does not change as the microstructure evolves with strain. It represents the sum of a friction stress and resistance from other obstacles, which would not significantly altered by strain. The second term, which bears a ln(h)/h dependence, results from the resistance encountered by the dislocation as it propagates through the layer. The parameter A α is related to the self-energy of the dislocation deposited in the interface and would depend on the type of dislocation α and interface type (e.g., coherent or incoherent). It can evolve through its dependence on h′. The last term, i.e., f αb/h′, results from the deformation of the interface caused by the threading dislocation. It represents the change in energy of the interface caused by the interaction with the threading dislocation loop as it moves through the layer. The displacement shift D in the interface caused by the dislocation alters locally the interface energy σ = (dγ/dD). If we let γ be the interface energy in units of energy per unit area of the interface [mJ/m2] and normalize D with respect to the shear strain ε caused by the moving dislocation b/h′ then the final term is σ = dγ/dn (b/h′). Thus, σ can be re-expressed as the product of f α = dγ/dn, which depends on the interface and dislocation interacting and geometry, b/h′. This resistive interface stress, when positive, means the shear strain caused by the dislocation resists the motion of the dislocation. Like the second term, this last contribution can also evolve during the deformation simulation since both texture and layer thickness h can change with strain, causing h′ to change.
In the modeling,  $\tau _0^\alpha$, A α, and f α are used as fitting parameters, where the first one depends on the material and dislocation family, and the last two depend additionally on the interface. These values were determined to capture, as best as possible, the experimentally measured responses of the composites compressed in different loading directions. To further simplify the calibration, we made the following assumptions: (i) all slip systems belonging to a given slip mode α have the same CRSS. (ii) Since $\tau _0^\alpha$ is considered a material parameter, the same value was given to the Nb phase in all composites, in both the 5 and 50 nm. Hence, differences in $\tau _0^\alpha$, due to changes in the lattice parameter in Nb was neglected. (iii) The same value of $\tau _0^\alpha$ was assigned for the {110} and {112} slip modes in the BCC materials, but those for BCC Mg were different than those of BCC Nb. (iv) For HCP Mg, $\tau _0^\alpha$ varied between the basal, prismatic, and pyramidal 〈c + a〉 slip modes. It should be emphasized that the values for $\tau _0^\alpha$ were not taken from DFT.
3. CPFE–CLS results
a. Stress–strain response
The CPFE–CLS model is applied to simulate the elastic–plastic deformation of the 5 and 50 nm Mg/Nb composites from the beginning of loading to the peak stress. Figure 9 compares the calculated stress–strain curves using the parameter set in Table IV and the experimental measurements for the normal and parallel loading cases. As shown, in each test, the agreement is reasonable in yield stress and hardening rate. The plastic anisotropy in compression, in which the normal loading is higher than the parallel loading, is also captured well by the model. In particular, for the 50 nm Mg/Nb composite, the degree of anisotropy agrees well with the experiment. Last, as in the measurement, the model flow stresses for the BCC Mg composite in both loading directions, are higher than those of the HCP Mg composite.
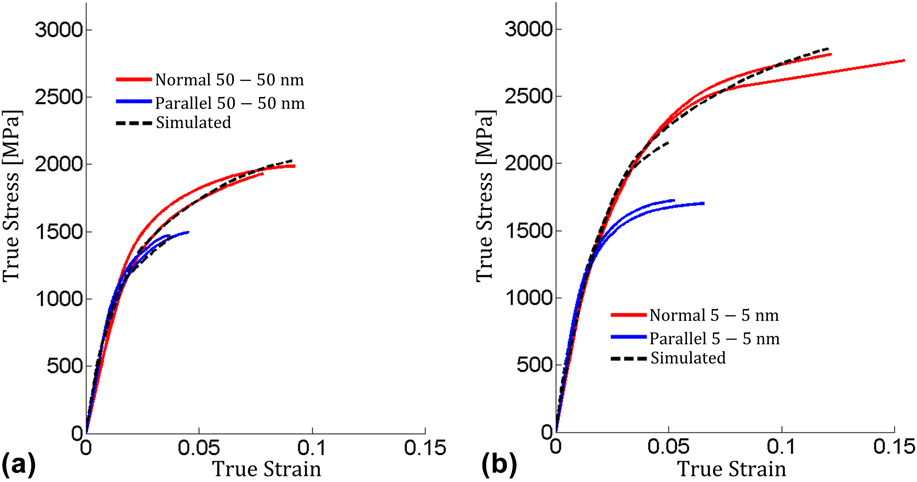
FIG. 9. Comparison of the predicted and measured stress–strain curves from micropillar compression for the (a) 50–50 nm Mg/Nb composites and (b) 5–5 nm BCC Mg/Nb composites.
The values of the parameters in Table IV can be considered part of the output of the model. Overall, these parameters lie in a physically permissible range and are consistent with those expected from prior CLS studies.Reference Misra, Hirth and Hoagland84–Reference Embury and Hirth87
b. Initial friction stress
The values for  $\tau _0^\alpha$ are material properties, independent of orientation. It is found that $\tau _0^\alpha$ for pyramidal 〈c + a〉 slip is higher than prismatic 〈a〉 slip, which is both higher than that for basal 〈a〉 slip. This ordering of slip mode resistances is consistent with the ISS values calculated from DFT, as well as many prior CP studies on bulk HCP Mg alloy studies.Reference Arul Kumar, Beyerlein and Tomé40,Reference Arul Kumar, Beyerlein, Lebensohn and Tomé41,Reference Lentz, Risse, Schaefer, Reimers and Beyerlein59
c. Interface effects on dislocation resistance
The two important interface parameters are A and f. The factor A pertains to the local change in the core of the dislocation when deposited in the interface and f to the response of the interface to the local deformation caused by the deposited dislocation. It is found from the analysis here that generally, A and f, for the HCP and BCC slip modes are lower for the coherent BCC/BCC interface than the HCP/BCC interface. This difference prevails for all values of A and f regardless of the type of dislocation. However, because the dislocations in the HCP Mg are not the same as those in the BCC Mg, analysis of interface effects on slip resistance is better evaluated by comparing the {112}〈111〉 and {110}〈111〉 dislocations in the Nb phase of the two composites. The smaller A would imply that the dislocation core has a lower self-energy in the coherent interface than in the semicoherent one. The smaller, and positive, value for f for the coherent interface implies that this interface resists the shift caused by the dislocation, less so than the semicoherent one.
d. Deformation mechanisms
The same model predicts the slip activities in each crystal at each strain level. Figures 10 and 11 present the bulk average contributions of the slip rate for each slip mode to the deformation of its phase, either Mg or Nb. In this way, the proportional of the strain accommodated by each phase and each mode in each phase can be assessed. In all simulations, the model presumes that slip is confined to the layers, and with this assumption, uncovers the type of slip activated during each test. For the normal loading cases, the applied strain for the first 2% is entirely accommodated by deformation of the Mg phase. In the 50 nm composite, basal slip dominates Mg phase deformation particularly, initially. As straining proceeds, basal slip activity decreases, while prismatic and pyramidal activity increases, such that all three operate in similar amounts at the strain at which the peak stress is reached. In the Nb phase in this composite, {112}〈111〉 slip is more active than {110}〈111〉 slip and remains so during deformation. The calculations for the 5 nm composite find that the Nb behaves similarly as it does in the 50 nm composite. In the 5 nm BCC Mg phase, both slip modes are active, but as in the Nb phase, the {112}〈111〉 slip mode dominates.
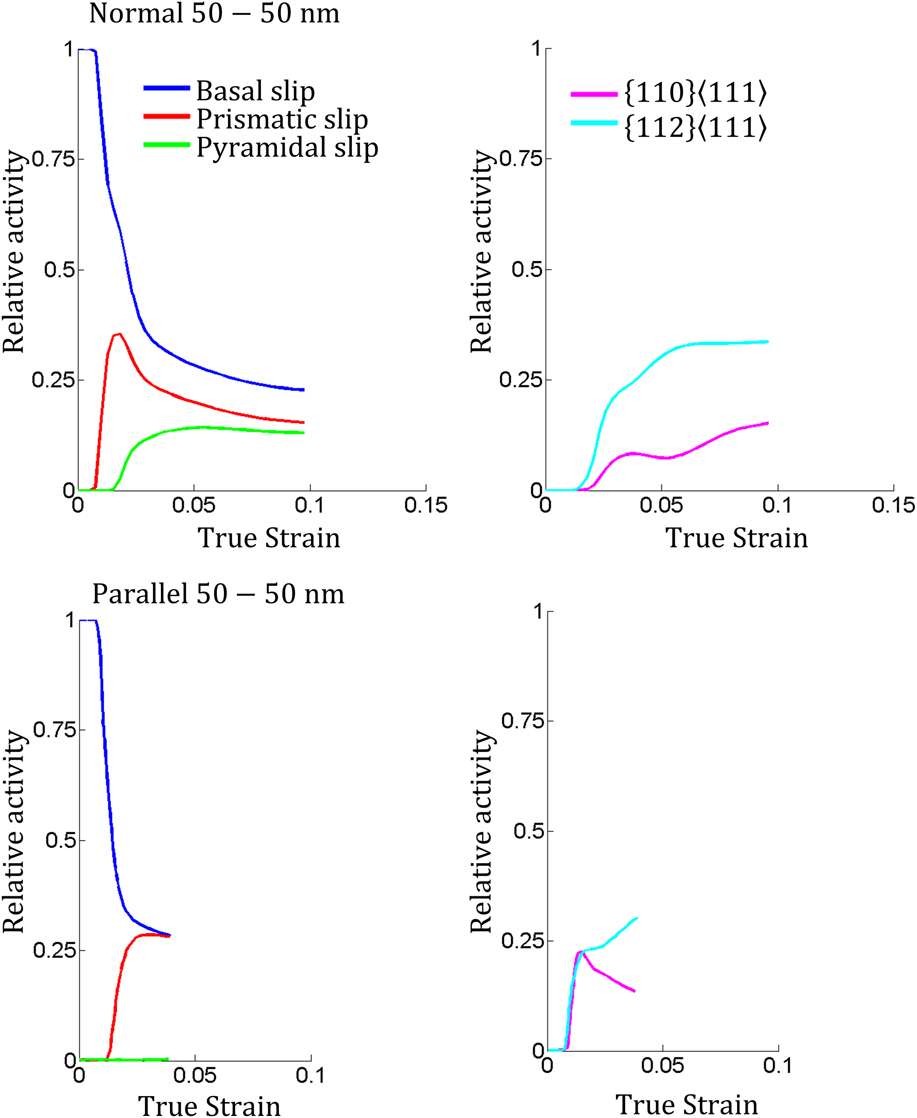
FIG. 10. Calculated slip activity for the 50–50 nm HCP Mg/BCC Nb composites.
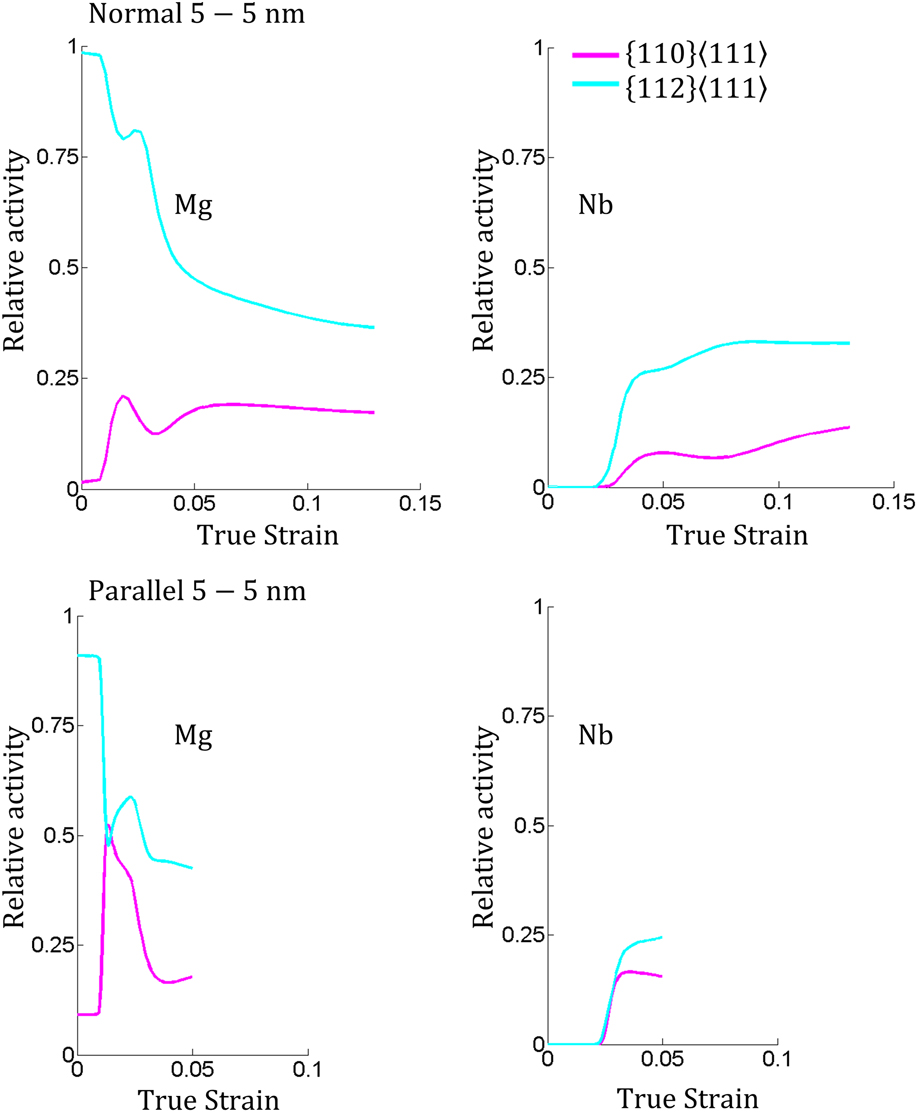
FIG. 11. Calculated slip activity for the 5–5 nm BCC Mg/Nb composites.
e. Origin of strain hardening
The model is used to determine the source of the macroscopic hardening rate. Typically in a bulk material, macroscopic hardening arises due to storage of dislocations. In the present case, however, the initial TEM analysis did not indicate dislocation storage to be significant and so dislocation storage was not taken into account in the model. The CRSS law used was not dependent on the instantaneous dislocation density stored, but instead depended on h and the orientation of the crystal via h′. The interpretation of the model is that the hardening shown in Fig. 9 is due to a combination of a reduction in h and change in texture. The hardening is thus higher in the normal case than parallel case since in the normal case, the reduction in h during deformation is more severe.
f. Plastic anisotropy
Next, the model is used to seek an explanation for the anisotropy seen between the normal and parallel test cases for the same h value. From Table IV, it is evident that Nb is the stronger material compared to Mg, whether Mg is HCP or BCC. From Figs. 10 and 11, in both composites, it is observed that Nb accommodates proportionally more applied strain in normal loading than parallel loading, which would alone cause normal loading to give rise to a higher flow stress. This would explain the anisotropy seen in both the h = 50 and 5 nm composites. For the h = 50 nm HCP Mg composite, the difference is additionally due to more 〈c + a〉 slip activity in the Mg phase in normal loading than parallel. According to Table IV, 〈c + a〉 slip had the highest value for  $\tau _0^\alpha$ than those for prismatic and basal slip. Thus, the activity of the hardest mode in normal loading but not in parallel would contribute to the higher yield and subsequent flow stress.
g. High strength of BCC Mg/Nb
Finally, using the model results, the origin of the higher strength of the BCC Mg composite for the HCP Mg composite is examined. This comparison is not straightforward since admittedly these two composites differ in a few highly influential aspects that can govern strength: size and interface type. For aid, the model parameters in Table IV are analyzed, first those independent of size, such as  $\tau _0^\alpha$, and second those dependent on size, such as h and indirectly, the interface type, A and f. In Nb, the $\tau _0^\alpha$ values for the two slip modes are the same for the two composites. The texture and slip activities between the two modes are similar as well. Thus, the deformation behavior of the Nb phase cannot explain the higher flow stress of the 5 nm composite. However, for Mg, $\tau _0^\alpha$ values are higher for the {110} and {112} slip systems in the BCC Mg than $\tau _0^\alpha$ for basal and prismatic slip, the two more active slip systems in HCP Mg in both normal and parallel loading. Thus, it is suggested that BCC Mg possesses a higher intrinsic glide resistance than HCP Mg, leading to strengthening. Second, the BCC Mg composite has a much finer layer thickness, h = 5 nm versus 50 nm, and this alone can provide substantial strengthening, an effect that has been directly incorporated into the size dependent CLS law in Eq. (3). Nonetheless, it is worth examining the effect of the interface type itself. As mentioned earlier, for all dislocation types, A and f are smaller for the coherent BCC/BCC interface than the semicoherent HCP/BCC interface, indicating that the coherent BCC/BCC provides less resistance to CLS than the semicoherent HCP/BCC. Hence, putting the value of h aside, the implication is that the interface resistance in a composite with the coherent interface is less than that in a composite with the semicoherent HCP/BCC. To summarize, analysis of the model predictions and associated parameters suggest that the higher strength from the BCC composite is due to two factors: the increase in resistance to threading primarily due to the finer layer thickness and increase in $\tau _0^\alpha$ of the BCC Mg slip modes compared to those of the two easiest HCP Mg slip modes.
V. DISCUSSION
The model calculations have assumed that both Mg and Nb phases of both composites deformed by slip and the interface remain intact during deformation. Furthermore, slip is confined to the layers and does not transmit across the layers via slip transmission. Therefore, the implicit assumption made here is that the stress to transmit slip across the layers, τtrans, is presumed higher than that to glide in the layers. Since the layer thicknesses h, representing the critical length-scale affecting dislocation motion, lie in the range of h = 5–50 nm, slip is considered to operate by threading through the layers and presumed to experience an h-dependent resistance to threading, according to the CLS model, Eq. (3). The resistance increases as ln(h)/h and thus it is possible that at the finer layer thickness studied here, i.e., h = 5 nm, threading through the layers could become difficult, too high that the stress for slip to transmit τtrans across interfaces is less and thus more favorable. The value for τtrans for the coherent BCC Mg/Nb has not been calculated. For reference, we mention calculations of τtrans for a single dislocation to transmit slip across a coherent Cu/Ni interface. The τtrans stress lies in the regime of 0.3–1 GPa according to MD calculations and mesoscale calculations.Reference Hoagland, Kurtz and Henager88–Reference Zeng, Hunter, Beyerlein and Koslowski91 For semicoherent Cu/Nb interfaces and Cu/Ag interfaces, it is calculated to be higher, >1–2 GPa.Reference Zeng, Hunter, Beyerlein and Koslowski91,Reference Wang, Hoagland, Hirth and Misra92 In MD simulations of Cu/Nb nanolaminates, involving nucleation and glide of multiple dislocations, it was found that initially dislocations emit from interfaces and grain boundaries and thread through the layers and only later in deformation does slip transmission occur.Reference Zhang, Wang, Beyerlein and Germann62,Reference Zhang, Germann, Liu, Wang and Beyerlein93,Reference Huang, Beyerlein and Zhou94 Lastly, hardness measurements of the BCC Mg/Nb composites show a consistent strengthening with reduction in h from 50 to 5 nm (see Fig. 2). One sign that slip transmission prevails would be a critical h below which hardness does not continue to increase and for the present composites, this value may be 5 nm or smaller. Thus, while no evidence exists to suggest that slip transmission dominates, it cannot be ruled out entirely, particularly in the case of the h = 5 nm BCC Mg/Nb composite and especially with increased straining. To our knowledge, this work is the first attempt to incorporate the CLS model into CPFE and to include both slip transmission and CLS would lie beyond the scope of this work. Only a few CP models to date, in fact, have attempted to incorporate slip transmission into their models.Reference Mayeur, Beyerlein, Bronkhorst and Mourad95
One of the useful predictions of the model is slip activity. In the HCP Mg phase, the slip activity shows that basal slip prevails, a result which is not surprising for pure Mg and is consistent with many reports of pure Mg in many coarse and ultrafine Mg-based systems.Reference Zhu, Liao and Wu58 The model indicates that {112} slip dominates the slip activity over {110} slip in the Nb phase in both composites and in the BCC Mg phase in both loading directions. Both the {112} and {110} slip modes had the same friction stress. Thus, the higher propensity for {112} slip is a consequence of geometry. Two factors affecting activation can be related to geometry. The first is texture, or the current orientation of the crystal with respect to the load, which affects the resolved shear stress (RSS), which is compared to the CRSS. The second is the projected layer thickness h′, which depends on both the current orientation of the crystal and current layer thickness. It affects the CRSS via Eq. (2).
To isolate the two geometry-based sources affecting slip activity, we removed the CLS hardening by setting  $\tau _{{\rm{disl}}}^\alpha$ = 0 in Eq. (2). The results find that {112} slip is still favored over {110} slip, indicating that the texture is likely responsible for the predominance of {112} slip. The distribution of orientations with respect to the loading states must result in higher local RSS values on the {112} slip systems than the {110} slip systems in the grains. To confirm this, we carried a few more simulations without CLS hardening. First, we changed both initial textures, considering a classical rolled BCC texture, and the applied loading state to plane strain compression, an ideal representation of the deformation during rolling. Changing the initial texture to a rolled texture, the {112} slip was more active than {110} slip during uniaxial simple compression. However, slip using the {110}〈111〉 slip mode was more active than the {112}〈111〉 slip mode when changing to plane strain compression loading while keeping the initial texture as measured. Thus, slip activity on the {112} slip systems is more active than {110} slip, which is primarily a consequence of the initial texture with respect to the simple compression loading both normal and parallel during micropillar compression.
It is interesting to find a few aspects of deformation that were not affected by layer size h. First one concerns the slip activity. As mentioned, the dominance of {112} slip is due to texture effects and for the Nb phase and BCC Mg phase, the texture did not change as the layer thickness reduced. The second aspect is the proportion of the load carried by Mg versus Nb. In both the h = 5 and 50 nm composites, the Mg phase initially in the first few percent of strain accommodated the applied deformation. Last one pertains to the deformation behavior of the Nb phase. The slip activity and proportion of load carried by the Nb phase changed only when the direction of loading changed and not as the layer thickness, interface type, and Mg phase changed between the two composites. Many of these similarities can be explained simply by considering that the main deformation mode remained slip in the layers as opposed to interfacial deformation, and that the Nb phase did not change and remained the stronger phase as the Mg changed phase from HCP to BCC. These findings need to be supported by repeating studies with different h but for the same composite type, whether HCP Mg/Nb or BCC Mg/Nb.
VI. CONCLUSIONS
In this work, a combination of experiment and computational techniques was used to gain insight into the deformation mechanisms underlying the room temperature deformation of the BCC Mg phase in nanolayered composites. Both multilayered 5/5 nm BCC Mg/BCC Nb (5 nm BCC Mg) and 50/50 nm HCP Mg/BCC Nb (50 nm HCP Mg) composites were fabricated via PVD and tested via micropillar compression. The 5 nm BCC Mg composite exhibited 50% higher strength and larger strains to failure when compressed normal and parallel to the layers than the 50 nm HCP Mg composites. Post-mortem TEM analysis of the deformed pillars suggests co-deformation and no twinning during compression normal to the interfaces. To interpret these results, we carry out DFT calculations of GSFE curves and crystal plasticity based calculations of pillar compression using a CPFE model. DFT indicates that in BCC Mg, glide {110}〈111〉 and {112}〈111〉 slip systems would be easier than the other glide systems and also shearing in the BCC Mg/BCC Nb interface. A CPFE model is built to simulate the compression deformation of the pillar. It adopted an experimental grain structure and texture and a constitutive law that took into account elastic deformation and inelastic deformation by crystal plasticity. The model newly introduces CLS for dislocation glide resistance at the slip system level in place of the conventional layer size-independent dislocation density hardening law. They also indicate that the stress–strain response of the 5 nm BCC Mg composite results from dislocation-mediated plasticity in both the BCC Mg phase and Nb phase on the {110}〈111〉 and {112}〈111〉 slip systems. The 5 nm BCC Mg is stronger than the 50 nm HCP Mg one due to the reduction in layer thickness and that glide on the {110}〈111〉 and {112}〈111〉 slip systems is relatively harder than basal slip in HCP Mg.
ACKNOWLEDGMENTS
M.A., M.K., M.J., and S.P., acknowledge funding from the National Science Foundation (NSF) - Civil, Mechanical and Manufacturing Innovation (CMMI) Early Concept Grants for Exploratory Research (EAGER) Grant No. 1541918. I.J.B. gratefully acknowledges support from a CMMI-MEP Grant No. 1727495. S.P. would also like to gratefully acknowledge support from the University of Nevada, Reno Research Enhancement Grant 2017 for this work. A.K. would like to acknowledge LANL LDRD Program No. 20170680ER for financial support. We acknowledge support from the Center for Scientific Computing from the CNSI, MRL: an NSF MRSEC (DMR-1121053). Part of the research was performed at the Center for Integrated Nanotechnologies, an Office of Science User Facility operated for the U.S. Department of Energy, Office of Science. Los Alamos National Laboratory is operated by Los Alamos National Security, LLC, for the National Nuclear Security Administration of the U.S. Department of Energy under Contract No. DE-AC52-06NA25396. The authors acknowledge M. Jahedi for XRD texture measurements.


