


Introduction
Vestibular schwannomas are benign tumours that arise from the vestibulocochlear nerve (VIIIth cranial nerve).Reference Kontorinis and Crowther1 The tumours tend to be sporadic with a unilateral characteristic, and are the most prevalent tumour that arises in the cerebellopontine angle.Reference Kontorinis and Crowther1 In the UK, the prevalence is 2 per 100 000, and the tumours usually occur between the fourth and sixth decades of life.Reference Lin, Hegarty and Fischbein2 Clinically, patients tend to present with, most commonly, unilateral or asymmetric sensorineural hearing loss, tinnitus, headache and balance disturbance, and, unusually, facial weakness and numbness.3 The decision to treat requires consideration of the patient's age and co-morbidities, with watchful waiting, stereotactic radiosurgery and microsurgery being widely used management modalities.Reference Kontorinis and Crowther1–Reference Daming, Yiwen, Bin, Yajun, Jia and Rui4
Vestibular schwannoma management can vary across the globe, and can be affected by additional factors other than the tumour size and growth pattern. Our understanding of the natural history of vestibular schwannoma has hugely contributed to the way we deal with such tumours. Nevertheless, vestibular schwannomas are well known for their unpredictability. The pattern and growth rate can vary widely, rendering decision making challenging.
Despite our improved understanding of the natural history of vestibular schwannoma, there is still no known repetitive factor that is predictive of growth.Reference Kontorinis and Crowther1–Reference Smouha, Yoo, Mohr and Davis9 Therefore, it is very difficult to predict when or if it will ever stop growing. This study aimed to better understand the features of a growing vestibular schwannoma, and to determine when and how many vestibular schwannomas with definite growth will stop growing without any intervention, using a large database.
Materials and methods
Basic settings and patient selection
We report a retrospective case series based on patients from tertiary referral university settings. The study was approved by the ethical committee as an audit, and Caldicott guardian approval was additionally obtained.
We included patients with a vestibular schwannoma identified through our regional vestibular schwannoma database (covering a population of 2.2 million) for whom there were complete data and a minimum follow-up period of three years. The dataset covers more than 23 years. Patients with neurofibromatosis type 2 were excluded because of their known genetic background.
Included factors
Patients were anonymised to ensure confidentiality. Demographic details such as age and gender were collected. We also collected vestibular schwannoma specific factors, including date of diagnosis, occurrence of growth (yes or no), arrest of growth (yes or no), size at diagnosis (millimetres), size before treatment (if any treatment were performed, such as stereotactic radiotherapy or surgical resection) and rate of growth (determined in millimetres per month, as per previous work by our group and others).Reference Ton, Sheldon, Tikka, Locke, Crowther and Kontorinis5,Reference Fayad, Semaan, Lin, Berliner and Brackmann6 For the purposes of the present study, we focused on the conservatively managed group (undergoing ‘watchful waiting’). We also included the total follow-up duration in years. Once the patients with growing vestibular schwannoma and spontaneous arrest were identified, we also identified the timing of tumour growth arrest (years taken following the diagnosis until the arrest occurred).
In terms of tumour size, radiological reports from the patient imaging archive system were used, and the maximum linear measurements on the axial or coronal plane on post-contrast T1-weighted magnetic resonance imaging (MRI) scans were documented. In order to enable accurate inclusion of intracanalicular and larger tumours, we measured the total length of the tumour including the internal acoustic meatus (IAM) component. For intracanalicular vestibular schwannomas, we only measured the length of the tumour within the IAM. Tumour growth was defined as at least 1.5 mm difference between serial scans on linear measurements, based on the limitations of the scanners and monitors used throughout the years.
The growth rate was calculated using measurements at two distinguished time points: at diagnosis (start of growth) and when the growth stopped. The difference between these measurements was divided by the number of months (mm/month).
For comparison purposes only, the patients with a growing vestibular schwannoma were divided into three groups, with one additional group comprising non-growing vestibular schwannoma patients, as follows. Group A patients showed tumour growth which then stopped without any treatment. Group B patients showed tumour growth which continued, but received no treatment at the time of the study (conservatively managed). Group C patients had a vestibular schwannoma that showed growth and received treatment. Group D, included for additional comparison, comprised patients with stable, non-growing vestibular schwannomas.
Information regarding patient age and gender, initial tumour size and growth rate for each group were documented for comparison. Follow-up duration was also included to ensure that growth arrest was not temporary.
Analysis
After data collection, there was a total of 735 patients. For the analysis, we focused on the 288 patients (39.2 per cent) who showed tumour growth. A separate list was made of patients with a growing vestibular schwannoma only, and the management modality was documented (e.g. ‘watchful waiting’, stereotactic radiosurgery, surgery). The patients of interest were those who initially had tumour growth which subsequently stopped without any treatment (group A).
An analysis of variance was conducted to statistically compare growth rates between the three growing vestibular schwannoma groups (groups A–C), as well as the group of randomly selected patients from our database who had stable, non-growing vestibular schwannomas (group D). Specifically, we compared the groups in terms of patient age, initial tumour size, tumour growth rate and follow-up duration. The level of significance was set at 0.05.
Results
Demographics and growing vestibular schwannomas
We compiled data from 735 patients with a vestibular schwannoma. Of these, 288 patients (39.2 per cent) showed vestibular schwannoma growth, while 320 patients (43.5 per cent) showed no growth at all. Of the patients, 127 (17.3 per cent) had incomplete medical notes or inadequate imaging data for accurate comparison, and had to be excluded.
Out of those 288 patients who showed tumour growth, 103 (35.8 per cent) did not receive any active treatment (only watchful waiting), 132 (45.8 per cent) received stereotactic radiotherapy, 38 (13.2 per cent) underwent surgery, and 8 (2.8 per cent) had both radiotherapy and surgery. There was no information regarding treatment for seven patients (2.4 per cent). These findings are illustrated as a pie chart in Figure 1.
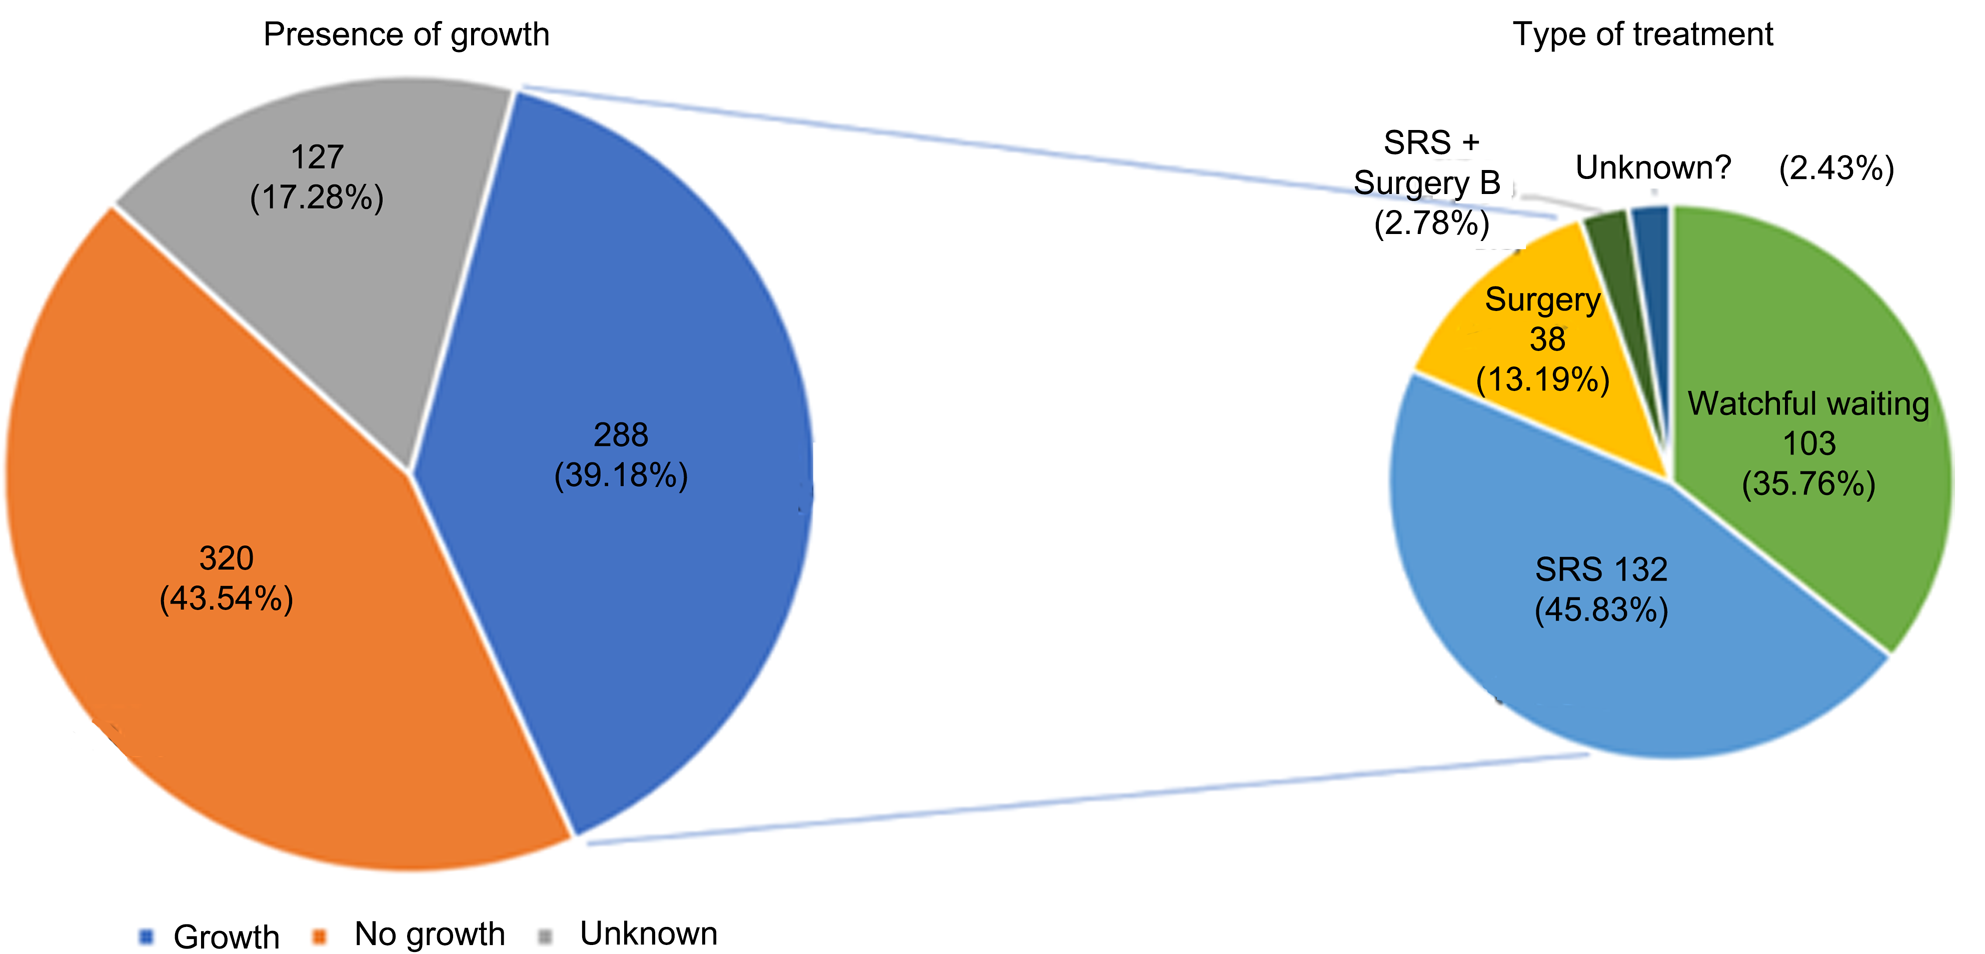
Fig. 1. The pie chart on the left illustrates how many patients had growing and how many had static vestibular schwannomas, while the smaller pie chart on the right demonstrates the treatment for the patients with growing vestibular schwannomas. SRS = stereotactic radiosurgery
The average period of tumour growth was 3.97 years. Of the 197 patients who had the necessary information to be included in the calculation of the average, only 3 showed tumour regrowth after the arrest of growth. Patients were followed up for a reasonable amount of time, ranging from 2 to 22 years.
Growing vestibular schwannoma without treatment
Of the 103 patients who had tumour growth but did not receive any treatment, 52 (50.5 per cent) demonstrated a spontaneous arrest of growth during follow up; the tumours in the remaining 51 patients (49.5 per cent) continued to grow. Of those 52 patients with a tumour that stopped growing, only 1 (1.9 per cent) showed subsequent tumour regrowth. The time from diagnosis of vestibular schwannoma to the arrest of tumour growth ranged from 1 to 11 years, with an average time of 4 years.
Regarding the timing of growth arrest, of those 52 patients who showed tumour growth with the subsequent spontaneous arrest of growth, in 4 patients this arrest of growth took 1 year from the time of diagnosis, in 9 patients it took 2 years, in 13 patients it took 3 years, in 6 patients it took 4 years, in 9 patients it took 5 years, in 2 patients it took 6 years, in 3 patients it took 7 years, in 1 patient it took 8 years, in 2 patients it took 10 years, and in 1 patient it took 11 years. Unfortunately, there was no information on the precise timing of tumour arrest for two patients. Interestingly, 82 per cent of the vestibular schwannomas stopped growing within the first five years. Figure 2 shows MRI scans of vestibular schwannomas that stopped growing.
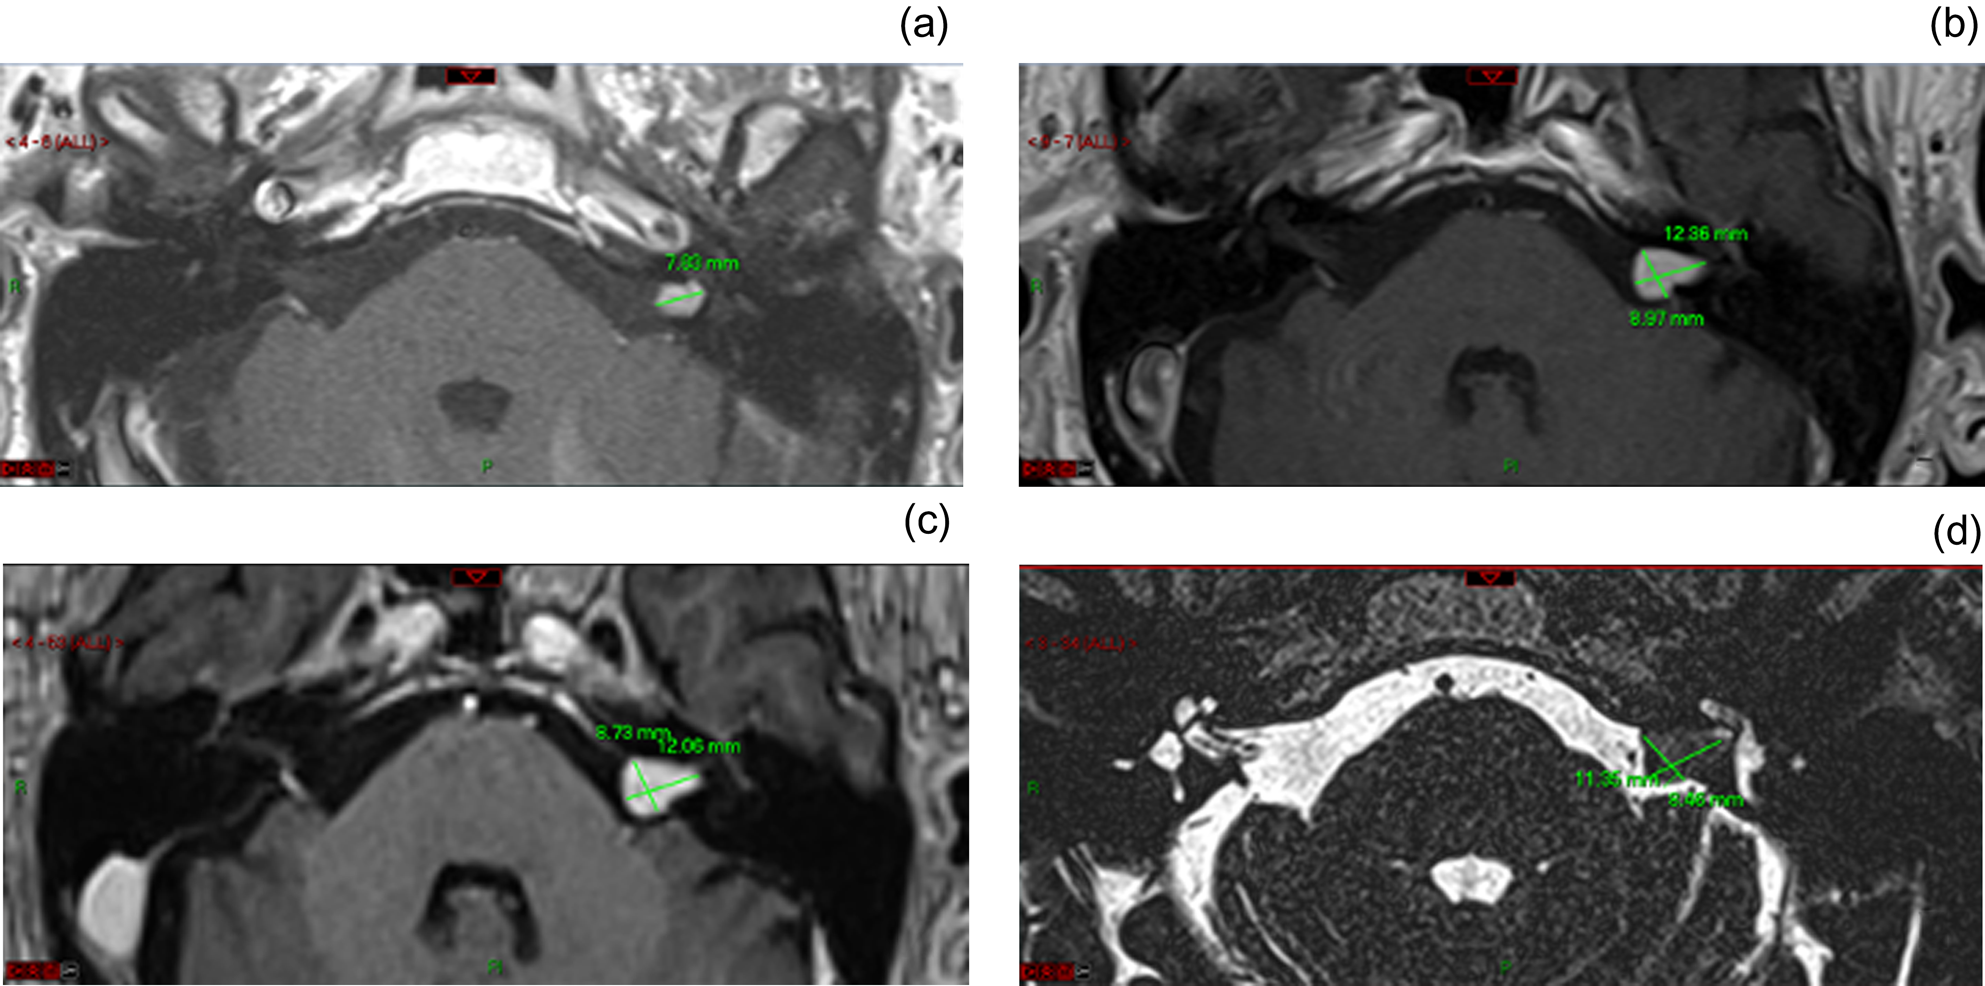
Fig. 2. Axial magnetic resonance imaging scans of the internal auditory meatus showing the initially intra-canalicular vestibular schwannomas (a), demonstrating growth over three years (b), which eventually stabilised (c), and stayed static; (d) shows post-growth arrest at three years (total follow-up period of seven years) (a–c, post-gadolinium T1-weighted; d, steady-state sequence). This figure also demonstrates the maximum linear measurements. R = right; P = posterior
Group details and comparison
Group A (tumour growth which stopped without treatment) comprised 52 patients. The mean age was 65.5 years, excluding three patients who passed away. The youngest patient was 30 years and the oldest was 88 years old. There were 24 female and 28 male patients. The average initial tumour size was 13.7 mm. The smallest tumour recorded was 5 mm, whereas the largest was 36 mm initially. There was no record of initial size for one patient, who was thus excluded. The average growth rate was 0.2 mm/month. The fastest growth rate recorded was 3 mm/month, whereas the slowest was 0.012 mm/month. The minimum follow-up period was 3 years and the maximum was 22 years, with an average 8.2 years. Figure 2 shows a typical example of a growing vestibular schwannoma that spontaneously stopped growing.
Group B (tumour growth which continued, conservatively managed) consisted of 51 patients. The mean age was 71.3 years, excluding five patients who passed away. The youngest patient was 47 years and the oldest was 91 years old. There was 33 female and 18 male patients. The average initial tumour size was 10.6 mm. The smallest tumour was 2 mm and the largest tumour recorded was 28 mm. The average growth rate was 0.16 mm/month (range, 0.03–0.46 mm/month). The average follow-up duration was 6.3 years, with the minimum follow-up period being 3 years and the maximum being 21 years.
Group C (tumour growth which continued, with treatment) comprised 52 patients. The average age was 66.1 years (range, 44–90 years). There were 26 female and 26 male patients. The average initial tumour size was 13.9 mm (range, 3–30 mm). The average growth rate was 0.21 mm/month (range, 0.03–0.7 mm/month). The mean follow-up period was 9.5 years (range, 3–19 years).
Group D (stable, non-growing tumours) consisted of 52 patients. The average age was 71.4 years (range, 50–98 years). There were 28 female and 24 male patients. The mean initial tumour size was 10.8 mm (range, 1–27 mm). The growth rate of all tumours was 0 mm as they were non-growing vestibular schwannomas. The follow-up period ranged from 3 to 22 years, with an average of 12.4 years.
The details of all groups are recorded in Table 1. Statistical comparison showed significant differences between the groups in terms of: age (p = 0.016), initial size of the vestibular schwannoma (p = 0.0008) and follow-up duration (p < 0.001). Interestingly, the difference in growth rate between groups A, B and C was not statistically significant (p = 0.65). (Group D was not included in this analysis as it only comprised non-growing vestibular schwannomas.)
Table 1. Data collected for each group for comparison
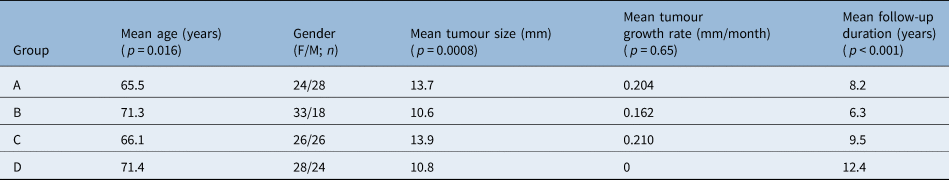
Each group was compared based on patient mean age and gender, tumour size at diagnosis, average tumour growth rate and total follow-up period. Group A = tumour growth which stopped without treatment; group B = tumour growth which continued, conservatively managed; group C = tumour growth which continued, with treatment; and group D = stable, non-growing tumours. The p-values refer to analysis of variance test results for all four groups. F = female; M = male
Discussion
Main findings
Despite the large number of published papers, a deep understanding of the behaviour of vestibular schwannoma is lacking. One of the main reasons for this is the absence of long-term follow up reports of conservatively managed vestibular schwannomas in the literature; indeed, many studies report on either short-term data or on limited numbers of patients with conservatively managed tumours. Herein, we present, to our best knowledge, one of the largest series of conservatively managed vestibular schwannomas with long-term data extending beyond a 20-year period.
Our study findings indicate that 20 per cent of all growing vestibular schwannomas spontaneously stop growing. However, if we only include the vestibular schwannomas that were purely conservatively managed, with no disruption of the tumours’ natural history, this percentage rises to just over 50 per cent. Additionally, we showed that 82 per cent of vestibular schwannomas stopped growing within the first five years of diagnosis; hence, tumours that continue to grow after this point are less likely to stop. Additionally, regrowth following spontaneous growth arrest is unlikely.
Based on our data, should a small vestibular schwannoma continue growing after a five-year period, treatment might be considered at that point, as the chances that it will spontaneously stop growing are low.
Clinical reasons for demographic findings
We identified a statistically significant difference in age among groups, which was to some degree expected. Indeed, comparatively older patients tend to choose conservative management as they are less keen on undergoing an intervention, possibly because of co-existing medical morbidities.Reference Kontorinis and Crowther1,3 In terms of initial tumour size, patients with larger tumours are more likely to receive treatment to either arrest the growth or remove the tumour. The follow-up periods were also significantly different, as patients who received treatment had their ‘pre-treatment’ follow up interrupted by intervention.
Interestingly, we found no difference in the growth rates among the groups with a growing vestibular schwannoma (groups A–C), indicating that the growth rate of a vestibular schwannoma does not give us adequate information about its future behaviour.
Of note, 1.5 mm of tumour growth might not be of clinical importance in a small tumour, while in a large vestibular schwannoma it might well indicate active treatment in the near future. Thus, the statistically significant difference in vestibular schwannoma size between the examined groups was to be expected.
Vestibular schwannoma growth unpredictability
The unpredictability of growth for this particular tumour is well observed from our data. Prior to our data collection, numerous reviews and articles focusing on similar objectives were reviewed for comparison purposes. Many of them concluded that there were no obvious prognostic factors that predicted tumour growth, and no associations were observed between growth rate and other demographic factors such as age and gender.Reference Paldor, Chen and Kaye7,Reference Hughes, Skilbeck, Saeed and Bradford8 Moreover, very commonly, there were changes in growth pattern over a long period.Reference Smouha, Yoo, Mohr and Davis9 Optimistically, of studies that investigated the effects of treatment such as stereotactic radiosurgery, positive outcomes were observed, such as tumour size regression or growth arrest, from a significant proportion of the samples.Reference Stapleton, Crowther, Locke and Kontorinis10–Reference van de Langenberg, Dohmen, de Bondt, Nelemans, Baumert and Stokroos12 A similar finding was reported among neurofibromatosis type 2 patients.Reference Shinya, Hasegawa, Shin, Sugiyama, Kawashima and Katano13 Nevertheless, one study claimed that radiosurgery does not affect tumour growth pattern or regression in the long-term.Reference Battaglia, Mastrodimos and Cueva14
Interestingly, unlike other tumours, vestibular schwannomas can spontaneously regress in some patients. Several researchers have attempted to predict the likelihood of spontaneous regression based on radiological images.Reference Lahlou, Rodallec, Nguyen, Sterkers and Kalamarides15 In addition, links between the degree of hearing loss and the presence of growth and size have been shown by few studies.Reference Kirchmann, Karnov, Hansen, Dethloff, Stangerup and Caye-Thomasen16,Reference Patel, Huang, Dowling, Lees, Tombers and Lohse17 Furthermore, one study showed relationships between tumour regression and tumour-related factors such as size and location.Reference Tikka, Yiannakis, Stapleton, Locke, Crowther and Taylor18 The same study also showed different patterns in regression, which intensifies the unpredictability of vestibular schwannomas.Reference Tikka, Yiannakis, Stapleton, Locke, Crowther and Taylor18 The present work highlights further the unpredictability of vestibular schwannomas, while at the same time providing robust answers concerning how many growing vestibular schwannomas are likely to stop growing and when.
Large case series have highlighted the unpredictability of vestibular schwannoma growth patterns; some have indicated that a significant number of vestibular schwannomas will not grow from the time of the diagnosis onwards.Reference Marinelli, Carlson, Hunter, Nassiri, Haynes and Link19,Reference Reznitsky, Petersen, West, Stangerup and Cayé-Thomasen20 However, all tumours have grown at some point until they reached their size at the time of diagnosis. Given that approximately 65 per cent of vestibular schwannomas do not grow following the diagnosis, in an ideal world with an uninterrupted natural history, 65 per cent of all vestibular schwannomas should spontaneously stop growing. However, because of clinical factors, a significant number of these tumours will receive active treatment. Thus, of all growing vestibular schwannomas for which we can afford to wait, our study indicates that 20 per cent will stop growing without any treatment; this number is important for the long-term management of patients with a vestibular schwannoma.
Of note, one previous study identified a neutrophil-to-lymphocyte ratio predictive value for future vestibular schwannoma growth.Reference Kontorinis, Crowther, Iliodromiti, Taylor and Locke21 While a high ratio was seen in predominantly growing vestibular schwannomas, a low ratio was reported in a mixed group of tumours; thus, the clinical applicability of this finding in predicting growth is limited. Such blood tests were not available for our cohort given the long time period covered by this study; hence, we did not include such a ratio among the examined factors.
Strengths and limitations
The main limitation of our study is the retrospective bias, as we had to rely on existing data. Predictably, there were missing data within the long-term study period. Unfortunately, a number of patients passed away during the follow-up period and their data had to be excluded from the analysis. Owing to the long follow-up period, it was not possible to include details on symptoms and hearing thresholds. This could be a limitation, as such details might have provided valuable information for prognosis. Furthermore, there is a possibility of future tumour regrowth for some of those patients with an arrest of vestibular schwannoma growth; however, given the long follow-up period covered by our study, this risk is low.
• The natural history of vestibular schwannomas remains unpredictable
• Most studies agree that two-thirds of vestibular schwannomas will not grow from the time of diagnosis
• This retrospective series of 735 sporadic vestibular schwannomas showed that 20 per cent of tumours spontaneously stop growing, usually within five years of diagnosis
• It is less likely that growing vestibular schwannomas will stop growing beyond five years
• This is one of the largest reported series of conservatively managed vestibular schwannomas
• As tumour growth is likely to stop without any active treatment, extended surveillance is justified, unless there are clinical or radiological contraindications
To our knowledge, this study represents one of the largest cohorts of patients among studies that have investigated the growth pattern of conservatively managed vestibular schwannomas. The study includes patients from a wide geographical area, thereby increasing the generalisability of the results. In addition, the average follow-up period was considerably longer compared to other similar articles we have reviewed. A few patients in our study were followed up for over 20 years. This ensures the validity of the results regarding tumour growth arrest and the possibility of regrowth. Moreover, our study is the first to provide evidence regarding tumour growth arrest in a large cohort. The study is further strengthened by the thorough data collection and meticulous analysis. Most importantly, given the vestibular schwannoma incidence of 2 per 100 000,Reference Lin, Hegarty and Fischbein2 our results are powered at a level of over 95 per cent.
Conclusion
We showed that approximately 20 per cent of growing vestibular schwannomas will spontaneously stop growing; should we only focus on growing tumours that receive long-term conservative management, this rate rises to 50 per cent. Over 80 per cent of these tumours will stop growing within the first five years of follow up, which makes the arrest of growth beyond this timepoint less likely. The presented data are of considerable value regarding the long-term management of patients with vestibular schwannoma.
Competing interests
None declared


 Open access