


1. Introduction
Many emerging economies such as Malaysia and Thailand, in addition to their more advanced peers (e.g. Singapore, Korea and Hong Kong), became increasingly competitive in the 1980s and 1990s, due to trade- and investment-related structural changes. Such changes continued boosting external competitiveness; however, not all countries benefit equally from those due to differences in their economic structure. Empirical evidence finds that trade openness alone is not enough in promoting external competitiveness and thus, there is a need to explore other factors that can explain why some countries are more price competitive compared to others (see a meta-analysis of this literature in Yang and Mallick, Reference Yang and Mallick2014).
Earlier literature found exports and export diversification, growth in foreign direct investment, trade balance (Hoffmann, Reference Hoffmann2007) and currency crisis as driving factors for changes in the real effective exchange rate (REER) (see Hall et al., Reference Hall, Harms and Kretschmann2009; Holtemöller and Mallick, Reference Holtemöller and Mallick2013; Rodrik, Reference Rodrik2008). When the real exchange rate deviates from its equilibrium for an extended period, such frequent fluctuations can be considered as exchange rate misalignment. A positive misalignment is when the local currency is overvalued, which refers to the lower external competitiveness of a country's currency, while a negative one is when it is undervalued, which implies a better external competitiveness. REER misalignment was conventionally regarded to be associated with the currency regime choice (see Dubas, Reference Dubas2009), as the choice of a regime can be reflected in the behaviour of REER. This could help uncover which type of regime is more likely to achieve better competitiveness as compared to others. However, it is not yet clear which regimes induce higher misalignment.
In the previous literature, it is generally argued that no single currency system is optimal for all countries. Conventionally, it has also been observed that both domestic and foreign shocks might influence a country's choice of exchange rate regime. Many economies have tried to fix their exchange rates under fixed regimes; however, for political economy reasons, it might be costly to adjust a fixed exchange rate. If the foreign exchange market works efficiently, the prices could change according to market pressure which can bring the REER back to its equilibrium level even if the nominal rate does not alter. It is also observed that under fixed and flexible regimes, the REER can display misalignment. This is the case for nominal price stickiness of fixed regimes. Incomplete information and a ‘herd instinct’ among investors could be the case for flexible regimes, raising volatility. Many empirical studies confirm that the REER can be misaligned irrespective of the nominal regime (Dagdeviren et al., Reference Dağdeviren, Binatli and Sohrabji2012). The literature also argues that currency misalignment can be observed more in developing countries, and that a free-floating regime leads to more misalignment (Dubas, Reference Dubas2009). In contrast, few studies have found that fixed regimes induce more misalignment per se (Coudert and Couharde, Reference Coudert and Couharde2009; Holtemöller and Mallick, Reference Holtemöller and Mallick2013).
The literature provides mixed evidence on the role of currency regimes in external competitiveness. Therefore, this paper aims to bring in broader institutional factors across countries namely trade agreements, inflation-targeting (IT)-based monetary policy, as well as the quality of institutions, to provide a synthesis on this issue. One strand of the literature suggests that many emerging economies had progressively received higher capital inflows because of trade and financial liberalisation. The intensity of international trade had significantly increased among the East Asian and Southeast Asian countries such as Indonesia, Malaysia, Thailand, China, Hong Kong, Singapore and Korea by 1988. In the 1990s, a substantial increase in bilateral trade between Singapore, Hong Kong and Korea with developed countries such as the USA, Japan and the EU consisted of intra-industry trade reflecting the growing sophistication of their manufacturing export structures. This early literature argues that trade liberalisation-related policies (Edwards and Lawrence, Reference Edwards and Lawrence2008; Santos-Paulino, Reference Santos-Paulino2005) are essential dynamics for economic diversification and export competitiveness; however, trade openness alone may not be enough in promoting external competitiveness.
The literature also focuses on the quality of the systems of governance across countries. Those factors typically referred to a full range of edifices such as contract enforcement, property rights, investor protection, the political system and impact outcomes of economic activities. Even though it has been established that emerging economies face a diverse array of challenges, including domestic disputes and structural changes, in the last two decades some of these economies have gained higher trade flows due to a higher level of external competitiveness. Institutional quality (see an early study of Hall and Jones, Reference Hall and Jones1999) is considered vital in driving the external competitiveness of a country, because poor infrastructure, high political instability and higher levels of corruption are detrimental to foreign capital inflows or trade relations (see also North, Reference North1990), and that weak institutions also lower the per capita income and lead to a higher wage gap. In addition, earlier studies have argued that developed economies had better institutions compared to those of developing economies (Acemoglu and Johnson, Reference Acemoglu and Johnson2005). The challenges faced by developing countries are much deeper than just macroeconomic variables and market access (see Rodrik et al., Reference Rodrik, Subramanian and Trebbi2004). However, the effect of currency misalignment on growth is small if the financial system is well developed. As such, a lower cost of misalignment can make an economy more tolerant to misalignment as opposed to countries with weak institutions (Aghion et al., Reference Aghion, Bacchetta, Ranciere and Rogoff2009; Elbadawi et al., Reference Elbadawi, Kaltani and Soto2012; and Rodrik, Reference Rodrik2008). The role of institutions in economic development has hence been proven, but its impact on export competitiveness has not yet been fully explored which we intend to uncover in this paper.
Recent literature argues that structural changes such as institutional arrangements play a crucial role in both growth (see Mullings, Reference Mullings2018) and attracting capital inflows (see e.g. Agoba et al., Reference Agoba, Agbloyor, Gyeke-Dako and Acquah2020, Bournakis et al., Reference Bournakis, Christopoulos and Mallick2018). Those inflows in the presence of better institutional quality contribute to the capital stock in those countries (see Nemlioglu and Mallick, Reference Nemlioglu and Mallick2020; Younas, Reference Younas2009) as well as their international reserves (see Aizenman et al., Reference Aizenman, Cheung and Ito2015), which in turn may contribute to controlling the misalignments in the REER. Therefore, this paper investigates to what extent the institutions within a country can help in gaining external competitiveness through capital inflows in various forms. Thus, we show that countries become more competitive externally if they are stronger in terms of institutional quality, as well as having liberal trade policies.
Starting from the late 1990s, IT regimes became one of the major macroeconomic policy tools used in maintaining stability in emerging market economies. Aizenman et al. (Reference Aizenman, Hutchison and Noy2011) examined the role of IT in emerging markets. They found that the response of real exchange rates is more constrained in IT regimes compared to that in non-IT regimes, but it is strongest in those countries following IT policies that are relatively more intensive in exporting basic commodities. Their results suggest that external factors are important even for IT policymakers. Central banks operating under IT regimes in emerging markets react to existing monetary conditions and current inflation as well as to changes in real exchange rates. However, this observation does not necessarily imply that IT policymakers have policy targets other than inflation, such as the setting of a specific real exchange rate. Sousa and Yetman (Reference Sousa and Yetman2016) show that central banks rely on an increasing number of measures of inflation expectations, especially in emerging markets and IT regimes. As a result, inflation expectations have become more strongly anchored over time. Institutional quality is also a crucial determinant of political (in)stability, the likelihood of structural reforms (Agnello et al., Reference Agnello, Castro, Jalles and Sousa2015) and fiscal performance (Agnello and Sousa, Reference Agnello and Sousa2013). However, the literature has not yet explored whether countries benefit differently from IT in the presence of better-quality institutions enabling greater central bank independence. Therefore, in our paper, we aim to add IT as a monetary policy intervention to our model and analyse its impact on the REER using a ‘natural-experiment’ setting.
Overall, using a panel dataset for 35 emerging countries during 1975–2014, this paper examines the effect of currency regimes on external competitiveness by bringing institutional arrangements such as trade agreements, IT policies and the quality of institutions into a broader framework. In this study, we first investigate the role of different exchange rate regimes and find that intermediate regimes tend to reduce currency misalignment both directly and indirectly through greater financial openness (FO). In fixed regimes, capital account openness does not help in reducing misalignment; instead, it can create a positive misalignment. Second, we extend our analysis by addressing whether regional integration in trade has a role in gaining better competitiveness and find that countries operating under non-reciprocal preferential trade agreements (NRPTAs) can reduce misalignment under fixed and flexible regimes. Also, countries with free trade agreements (FTAs) can reduce misalignment if they have a higher degree of FO.
Furthermore, when we examine the role of institutions in reducing misalignment, we find that better institutional quality is beneficial in reducing misalignments. Besides, we also find that although openness alone does not help to reduce currency misalignments, it can indirectly reduce misalignment in countries with better institutional quality. We also investigate the impact of a monetary policy-induced switch to an IT in emerging markets, starting in the 1990s, and find that countries following the IT policy benefit from greater competitiveness through better institutional quality, across different currency regimes. Next, we explore whether and under which regimes the misalignment is persistent and how it can get corrected. In the flexible and intermediate regimes, the misalignment can get corrected if countries are more financially open.
Finally, we conduct robustness checks by using capital inflows as an alternative to FO and discover that the inflows such as debt, FDI and official development assistance (ODA) do contribute to reducing misalignments, and our results remain robust even when we replace our dependent variable with REER volatility, which has been estimated using three alternative methods.
The rest of the paper is organised as follows. The second section reviews the related literature; the third section presents the data and the empirical strategy; the fourth section outlines the empirical estimation and robustness checks, and the fifth section concludes the paper.
2. Literature review and hypotheses development
The role of exchange rate regimes in currency misalignment
Guzman et al. (Reference Guzman, Ocampo and Stiglitz2018) argue that exchange rate policies play two leading roles. The first is facilitating or hindering economic growth, including through promoting diversification; and the second is helping manage the terms of trade fluctuations, especially in commodity-exporting countries. Both issues highlight the potential importance of exchange rate policies in open economies, alongside monetary and fiscal policies. More specifically, an ‘undervalued’ REER means more competitive prices in trade.
Additionally, Guzman et al. (Reference Guzman, Ocampo and Stiglitz2018) reviewed the exchange rate interventions that became a major rule in many developing countries, particularly after the East Asia financial crisis in 1997. In contrast to the mainstream view that prevailed in the 1990s, according to which only polar regimes were stable – hard pegs or freely floating exchange rates, the dominant exchange rate regime in emerging and developing countries have become intermediate regimes, in particular, managed exchange rate flexibility (see Ilzetzki et al., Reference Ilzetzki, Reinhart and Rogoff2017). Research by the IMF shows that managed floats are significantly less prone to crises (Ghosh et al., Reference Ghosh, Ostry and Qureshi2014). This indicates that interventions in the foreign exchange market among countries may differ. In addition, Atolia et al. (Reference Atolia, Loungani, Marquis and Papageorgiou2020) present an extensive review of the fundamental changes that occurred in some developing countries following their structural transformation and point out the experience of the ‘Asian Tigers’ which typifies what is achievable by leveraging openness to accelerate industrialisation and structural transformation and, hence, economic growth.
The differences in the REER highlight that countries with a similar level of development might have different levels of external competitiveness, which can be reflected in terms of REER misalignments. Trade and FO can improve the extent of competitiveness in emerging markets. However, further investigation is needed as to what underlying factors can impact the extent of misalignment. In theory, exchange rate regimes are considered as a fundamental factor in determining the extent of misalignment (Freund and Pierola, Reference Freund and Pierola2012; Reference Freund and Pierola2020; Rodrik, Reference Rodrik2008). Recent studies such as those by Kaplan (Reference Kaplan2006), Guzman et al. (Reference Guzman, Ocampo and Stiglitz2018) and Atolia et al. (Reference Atolia, Loungani, Marquis and Papageorgiou2020) have mainly discussed the exchange rate regimes and interventions along with structural changes in developing countries in the last three decades, followed by more stable exchange rates and greater levels of industrialisation. In recent years, the role of regimes has been highlighted and considered as a major factor in predicting the probability of a currency crisis (Höltemöller and Mallick, Reference Holtemöller and Mallick2013).
Additionally, Mallick and Marques (Reference Mallick and Marques2008) examine the degree of exchange rate pass-through to export prices after the policy change in the exchange rate and trade regimes in India in the early 1990s and found evidence of incomplete pass-through in line with high-income countries in the literature, rather than zero pass-through, as one would expect in emerging market economies such as India. Therefore, by considering the arguments in the literature, it can be suggested that the choice of a currency regime for developing countries is crucial in determining the under or over valuation of exchange rates, and thus their external competitiveness. In addition, further investigation is needed on how the exchange rate regime can impact the extent of misalignment. Considering the above arguments, the hypothesis is structured as follows:
Hypothesis 1: Choice of exchange rate regime has a direct positive role in reducing REER misalignment.
Trade agreements
Trade agreements aim to regulate the flow of trade between two or more countries and are considered as vital elements in infusing capital inflows into an economy. The existence of a trade agreement also reflects upon trade-related policies and the extent to which a country is open for trade. With trade liberalisation in the 1980s and 1990s, many emerging markets received higher capital flows as a group as well as becoming more trade interdependent. Earlier literature on trade argues that trade liberalisation-related policies and export competitiveness are important dynamics for economic diversification (Frankel and Romer, Reference Frankel and Romer1999). Meanwhile, the literature on trade agreements has long been dominated by gravity equation models, showing the partial effects of trade agreements on bilateral trade flows or aggregate trade flows (Anderson and Van Wincoop, Reference Anderson and van Wincoop2003; Baier and Bergstrand, Reference Baier and Bergstrand2009). There is also an emphasis on the importance of regional trade agreements (see Liu, Reference Liu2016). However, in this paper, we explore the role of trade agreements in explaining the difference in external competitiveness among countries following different exchange rate regimes. Decreasing trade barriers and restrictions allow economies to access new markets and boost their import and export shares (see Hayakawa et al., Reference Hayakawa, Laksanapanyakul, Mukunoki and Urata2019). Thus, it is possible to argue that different trade agreements play a positive role in improving export competitiveness by limiting REER misalignment.
Hypothesis 2: Trade agreements have a favourable impact on reducing REER misalignment.
Role of institutions
Different countries have different regulatory mechanisms, which represent the set of rules and constraints shaping economic behaviour and incentives that can act as key determinants of economic development (see Challe et al., Reference Challe, Lopez and Mengus2019). More recently, it has been shown that better institutional quality tends to enhance a country's willingness to repay its debts and thus reduce the likelihood of default (see Chen and Chen, Reference Chen and Chen2018). In the specific context of open economies, the importance of having appropriate economic institutions domestically is often seen as a precondition for capital inflows, leading to balanced economic activities and stable long-run growth. Gillanders and Whelan (Reference Gillanders and Whelan2014) find that greater openness for business in a country is a key determinant of cross-country growth. Similarly, Bournakis et al. (Reference Bournakis, Christopoulos and Mallick2018) note that in countries with better institutional quality and less barriers for doing business experience greater capital inflows and higher country-level productivity.
Another aspect of governance is related to democracy. Tang and Tang (Reference Tang and Tang2018) discovered that countries with greater levels of democracy are more likely to innovate and achieve growth. Conversely, in countries with lower levels of democracy, the degree of innovation is limited. Cooray et al. (Reference Cooray, Dutta and Mallick2017) noted that political institutions such as democracy, political rights and civil liberties can play a role in enhancing the benefit from trade openness, especially in poor countries (for a contrasting view see Saha and Sen, Reference Saha and Sen2021). Aizenman et al. (Reference Aizenman, Jinjarak, Estrada and Tian2018) compare the role of institutions and fundamentals in the adjustment of growth and volatility to shocks in pre- and post-crisis periods, and find that, countries can cope with shocks better in the short to medium terms by appropriately using flexible policy tools and having good long-term fundamentals. In contrast, weak institutions hamper the adjustment to shocks. Thus, rather than resorting to short-term measures to respond to shocks, countries should develop institutions which enable them to withstand shocks to the economy, should they occur.
There is also evidence from the literature that weak institutions are associated with slower growth (Knack and Keefer, Reference Knack and Keefer1995), lower total factor productivity (Hall and Jones, Reference Hall and Jones1999) and lower per capita income. The quality of institutions has been found to influence total investment, public investment and foreign direct investment. These results underline the relationship between institutions and capital accumulation. A high-quality governance system is crucial for economies to receive the full benefit from trade openness. It has been observed that bad public policy and ineffective legal systems can reduce the volume of trade. There is thus a positive relationship between trade openness and the rule of law (Dollar and Kraay, Reference Dollar and Kraay2003), which can influence export competitiveness through lowering REER misalignment.
Hypothesis 3: The quality of institutions has a favourable impact on reducing REER misalignment.
3. Empirical strategy
Data description
In this paper, we use a panel of 35 countries over the period 1975–2014 to estimate the relationship between REER misalignment and currency regimes along with institutional arrangements. A complete list of countries is provided in Table 1. Using the REER data, we calculated the misalignment of the REER with a first-stage equation discussed in the next section. We transformed the residual variable obtained in the first stage to the exponential form and used it as the dependent variable (i.e. REER misalignment) in the second stage.
Table 1. List of countries in the study

We use various dependent variables throughout the paper to ensure the credibility of our results. The REER is followed by REER misalignment measure, and then REER volatility is used as a robustness check. Using the standard deviation of REER as a measure of exchange rate uncertainty is common in the previous literature (see Caglayan and Demir, Reference Caglayan and Demir2014; Demir, Reference Demir2010). Regarding the volatility measurement, there is no consensus in the literature over the differences between uncertainty and sample variation (i.e. volatility). Therefore, similar to Caglayan and Demir (Reference Caglayan and Demir2014) and Demir (Reference Demir2010), we calculated the currency volatility as the standard deviation of Ln REER as well as generating it through GARCH (1,1) and EGARCH (1,1) processes.
In recent years, the literature has highlighted the role of regimes and considered them as major factors in currency crises. The choice of a currency regime for developing countries is crucial in shaping the under- or overvaluation of their exchange rates. We thus use currency regimes as one of the main explanatory variables. The data on currency regimes are obtained from the IMF coarse classification of exchange rate regimes. Using dummy variables, the countries are categorised broadly under three types of regimes, namely: flexible regime, intermediate regime and fixed regime. Each country declares its type of currency regime to the IMF. The prevailing and de jure regimes are sometimes different, which gives rise to de facto currency regimes (Levy-Yeyati and Sturzenegger, Reference Levy-Yeyati and Sturzenegger2005; Reinhart and Rogoff, Reference Reinhart and Rogoff2004). In this paper, we focus on the de jure regime concept that is announced by the IMF for each country. All the other data on the main indicators are obtained from World Development Indicators. The data sources and definitions are provided in Table 2.
Table 2. List of variables and data sources

Furthermore, we also investigate the impact of FO on this relationship using data from the Chinn-Ito index.Footnote 1 For trade arrangements, we use data from the Economic Integration Agreement (EIA) (Baier and Bergstrand, Reference Baier and Bergstrand2009). The EIA database refers broadly to preferential trade agreements (PTAs), FTAs, customs unions, common markets and economic unions. For the scope of this study, we only use data on NRPTAs, PTAs and FTAs.
Moreover, for the currency regimes some studies use three-regimes, which we use in this study (IMF classification): floating regime, intermediate regime and fixed regime, which gives a better identification than two (fixed and flexible). More details on exchange rate regime classifications are available upon request.
We introduce institutional quality dimensions based on the six Worldwide Governance Indicators (WGIs) (Kaufmann et al., Reference Kaufmann, Kraay and Mastruzzi2010, Reference Kaufmann, Kraay and Mastruzzi2011): voice and accountability, political stability and absence of violence/terrorism, government effectiveness, regulatory quality, rule of law and control of corruption. The indicators are based on over 30 underlying data sources that report the perceptions of governance of a large number of survey respondents and expert assessments worldwide. The values vary between −2.5 and 2.5. ‘−2.5’ is the minimum and ‘ + 2.5’ is the maximum values of all six indicators. Descriptive statistics for the institutional variables are shown in Table 3.
Table 3. Descriptive statistics

Notes: This table shows the summary statistics for the macroeconomic variables and institutional quality indicators used in Chapter 4 regression estimations. Dependent variable in this study is EREER (residuals) transformed form. Macroeconomic variables are compiled from the World Development Indicators (WDI-2010). All the institutional-quality variables are extracted from WGI-2010 and they are available from 1996 to 2009. Trade agreements data are derived from the EIA dataset, whereas the full sample contains 1,400 observations over the period 1975–2014
Methodology
Unit root tests for stationarity
This section discusses the methodology used in the analysis of export competitiveness through REER misalignment. The panel data cover emerging countries across different regions. Hence, we found that not all the panels are stationary; REER has unit root in some regions. Therefore, the variables that have unit roots are likely to be cointegrated in the long term and could move together. The starting point of this analysis is to establish a long-term relationship between the REER and its determinants. The sample under consideration is unbalanced and thus requires the use of the latest Im–Pesaran–Shin (IPS) test. The Fisher stationarity test using the Augmented Dickey Fuller (ADF) approach also validates the findings. Finally, the results are summarised in Table 4.
Table 4. Stationarity tests IPS test for stationarity

Notes: (1) Im, Pesaran and Shin's and augmented Dickey–Fuller unit-root tests have been applied. (2) H 0: all panels contain unit roots while H 1: at least one panel is stationary. (3) p-values are reported in parentheses. (4) ***, **, * indicate the significance at 1, 5 and 10% significance levels. (4) Results show that our first-stage variables contain unit root when analysed region-wise. However, the residual variable (EREER), which is the dependent variable for the second-stage equation, found to be stationary by both tests.
The IPS test has the null hypothesis that all panels have a unit root (H 0: ρi = 0 for all i). This test has been performed separately on each region for different variables; including a linear time-trend, and that the number of lags is determined by the Akaike Information Criterion. Table 4 illustrates the outcome of the IPS-unit root test in columns 2–5 and 7 for Ln(REER), Trade openness, Ln(TOT), Ln(GDPPC) and Ln(GCE). The first row shows the unit root test result for all panels; the second row shows the result for the African region, the third row for Central Eastern European Countries (CEEC), the fourth for Latin America (LA), the fifth for Middle East and North Africa (MENA) and the sixth for South-East Asia (SEA). The results verify that these series have no unit root in the panel context, whereas they confirm that the series contain a unit root at the regional level. For instance, the variables for Africa mostly contain a unit root, and the same is observed in other regions for these determinants. The Fisher test for a unit root in Table 4 also reveals the same results. The results from both tables show that there is not enough evidence to reject the null hypothesis; so, the regional panels are found to contain the unit root. Hence, quite reasonably, the unit root test shows non-stationarity in various regions.
Estimation of REER equilibrium and misalignment
In this study, we formulate a model, including the key non-policy and policy-induced exogenous variables. This approach enables us to differentiate two foundations of REER misalignment (deviation from equilibrium, and variability of REER). First, we include those macroeconomic fundamentals which account for deviations from the REER equilibrium. These consist of exogenous and non-policy variables (namely level of development, trade openness or international terms of trade). Second, inappropriate domestic policies may also lead to REER deviations from equilibrium (e.g. government consumption expenditure). For the empirical analysis, we test those variables for the presence of unit root and use variables containing unit root only for the first stage of the analysis; subsequently, the choice of currency regime, degree of FO and institutional quality related variables (general governance, trade agreement and monetary framework) are used in the second stage of the analysis. The variables used in the first stage are considered to have long-run cointegration.
First-stage estimation: In the first stage, only non-stationary variables are included in the regression as per the stationarity tests above. The following REER equation is estimated, and the residuals are saved from the first-stage equation:

Residuals from the above equation are then transformed into an exponential form and those residuals are tested for unit root and verified that they contain no unit root as reported in Table 4. Indices t and i refer to years and countries in the dataset, whereas the definition and expected signs of other control variables are presented in the last column of Table 2. The variables used in the above equation (first stage), i.e. Ln TOT, Open, Ln GDPPC and Ln GCE are cointegrated with REER, and likely to move together in the same direction, as shown by the results in Table 4. The residual (EREER) is the error from the REER equation, which is the misalignment of REER from its equilibrium. In the first stage, we found evidence of a threshold effect for the countries at the top end, that is, the most advanced countries with the highest GDP per capita may be competitive up to an optimal level of REER after which they tend to get less competitive, as reflected in the squared GDPPC term in the following long-run equation. Long-run estimates from the first-stage equation (equation (1)) are as follows:

N = 893, R 2 = 0.114, adj R 2. = 0.109.
Notes: Standard errors are reported in parentheses. ***, **, * indicate the significance at 1, 5 and 10% levels, respectively.
Second-stage misalignment estimation: In the second stage of the analysis, we aim to investigate whether the misalignment of REER could be explained by two important aspects: first, the choice of exchange rate regimes and the degree of FO are investigated in the benchmark models; and second, the roles of institutional arrangements, namely governance indicators, trade agreements and IT-based monetary framework are investigated after the benchmark analysis, in the subsequent subsections.
The benchmark model is defined as follows:
Benchmark model:

where the variables are defined as follows: |ɛ it| is the misalignment–residuals saved from equation (1), (transformed to exponential misalignment variable); $\sum\nolimits_{j = 1}^{j = 3} {Regimes_{ijt}}$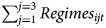 is the exchange rate regimes as per the following classification used in different sets of regressions; Regime1 is the freely floating exchange rate regimes; Regime2 is the intermediate exchange rate regimes; Regime3 is the fixed exchange rate regimes; FO it is the financial openness measured by capital account openness (Chinn-Ito index); and ɛit is the disturbance term, i stands for each cross-section, j stands for the country, t stands for time.
4. Empirical results
Before discussing the results of our analysis, we present an overview of the currency regimes over time in various countries in Figure 1. The plots reveal that the countries in intermediate regimes show misalignment getting corrected somewhat by appearing closer to the zero lines. Also in many countries, we observe a fixed regime with price stability. Mostly, a currency gets devalued in the presence of high inflation.

Figure 1. Graphical representation of residuals with type of regimes for Argentinian economy. Notes: (1) Figure 1 shows graphical illustration of Residuals covering the period 1975–2009 for Argentina, Brazil, Colombia, Mexico, Peru, Pakistan, Philippines, Romania and Venezuela, respectively. (2) The IMF regime classifications of exchange rate have been used. The Residuals are the misalignment variable obtained from REER equation and transformed to exponential form. (3) For robustness purpose, graphs for nominal effective exchange rates and bilateral exchange rates are also plotted for each country and can be provided upon request.
Benchmark estimations: exchange rate regimes, FO and misalignment
Table 5 summarises the results of the baseline model. The starting point for the benchmark is that the residuals (RES) saved from the first-stage REER equation have been regressed on exchange rate regimes and capital account openness (FO). For this empirical exercise, three different types of currency regimes have been used, i.e. Regime1 (freely floating regime), Regime2 (intermediate regime) and Regime3 (fixed regime). Theoretically and empirically, it is known that FO alone does not improve competitiveness. Therefore, in this study, FO is explored further to show whether it can be sufficient under certain circumstances. One of the findings uncovered by this estimation in Table 5 is that freely floating regimes have no direct impact on reducing misalignment (columns 1–4). However, the coefficient is negative but not statistically significant for our model. Additionally, Regime1 does not limit misalignment by introducing FO in emerging economies. The intermediate regime in Table 5 (columns 5–8) proposes that Regime2 also does not have a direct impact on limiting misalignment. Nonetheless, FO can limit misalignment, which is more evident in column 3, in that long-run misalignment can be explained by Regime2 in the presence of FO. Accordingly, we conclude that intermediate regimes can reduce misalignment of REER. Table 5 also shows that fixed regimes (9–12) cannot limit the volatility of REER, while column 3 suggests that FO contributes to positive misalignment. Greater FO is insufficient for controlling REER misalignment under the fixed exchange rate regime, but it can reduce misalignment only under intermediate regimes as depicted in Table 5. These results for the fixed and intermediate regimes remain aligned with a recent study which found that a higher level of flexibility of a currency regime corresponds to lower misalignment (see Holtemöller and Mallick, Reference Holtemöller and Mallick2013). However, the relationship is more pronounced in the case of a more flexible regime, and the exchange rate misalignment is higher in countries with relatively fixed regimes.
Table 5. Impact of exchange rate regimes and FO on exchange rate misalignments

Notes: The dependent variable is the Residuals (EREER) saved from REER equation (transformed to exponential form). Standard errors are reported in parentheses. ***, **, * indicate the significance at 1, 5 and 10% levels. The course classification of IMF currency regime has been used in this estimation. IMF classifications are obtained from Reinhart's website.
Regional trade agreements and misalignment
The role of trade agreements in limiting the degree of misalignment is explored in Table 6. As discussed above, trade agreements can play important roles in explaining why some countries are more competitive compared to others. A fixed regime shows less currency risk for investors, whereas freely floating regimes could involve more risk as a currency fluctuates more frequently. Besides, it also depends on what type of trade relations a country has in terms of the type of trade agreement (TA); accordingly, whether the fixed or floating regime is beneficial, given their corresponding trade agreements. The results of these estimations are shown in Table 6, and the model is estimated as follows:

where the variables are defined as follows.
Table 6. Trade agreements (NRPTA–PTA–FTA) with exchange rate regimes

Notes: The dependent variable is the Residuals (EREER) saved from the REER equation. Standard errors are reported in parentheses. ***, **, * indicate the significance at 1, 5 and 10% levels. Columns 1–7 provide analysis for NRPTAs for which, data are obtained from the Economic Integration Agreement Database (EIA) (Jeffrey Bergstrand and Scott Baier). Columns 8–14 provide analysis for PTA. Columns 15–21 provide analysis for FTAs.
The findings in Table 6 (columns 1–7) illustrate that NRPTAs are highly beneficial in limiting the degree of misalignment under the exchange rate regime classification used in this paper. The direct impact of NRPTA for misalignment is that those economies that are part of NRPTAs can reduce their misalignment, which could be beneficial to improve export competitiveness. However, this is explored further by interacting with the FO and currency regime. It is observed that the direct impact of NRPTA on misalignment remains the same and that FO × NRPTA has no impact under any of the currency regimes. It is also evident in Table 12 that (NRPTA × Regimes1) and (NRPTA × Regimes2) have negative signs but are not statistically significant, whereas (NRPTA × Regimes3) could increase the positive misalignment.
The results in Table 6 (columns 8–14) show that PTA has no direct significant impact. We extend our analysis by adding an interaction term, i.e. FO × PTA, to determine whether PTA can promote competitiveness with FO, which again turns out insignificant. Later, PTA × Regimes is added to examine whether the regimes can explain this relation further; however, no impact is shown. In Table 12, columns 15–21, we repeat the above exercise for FTA to determine how FTA might impact REER misalignment. The results show that FTAs have no direct impact. In contrast, economies that are part of the FTA and have greater FO can reduce misalignment as shown by the statistically significant FO × FTA term at the 1% level in columns 19–21. Furthermore, from Regimes × FTA added in columns 5–7, we observe that Regime1 (floating) with greater FO and being part of the FTAs tends to reduce positive misalignment (or overvaluation). However, the direct effect of regimes is marginally significant at the 10% level. Economies of intermediate regimes and with greater FO along with FTA-type trade relations can also help to reduce the extent of misalignment. In contrast, fixed regime countries with FO can improve competitiveness. The analysis in Table 14 concludes that economies that are participants in trade agreements can reduce their misalignment and achieve better competitiveness by having a more open capital account operating under both regimes, i.e. Regime1 (floating) and Regime2 relative to countries under Regime3. Overall, economies that are part of the NRPTA tend to reduce misalignment. In contrast, countries that are part of PTA trade blocs do not tend to have any impact on lowering misalignment, or do they benefit in the presence of better FO with alternative regimes. However, FTA results seem to be more favourable, and we can ascertain that FTA may not have any direct impact on misalignment. However, with greater FO, it tends to reduce misalignment under both floating regimes and intermediate regimes. Interestingly, we also find that countries that are part of FTAs also tend to have a limited degree of misalignment even under fixed regimes.
Institutions and misalignment
Construction of an institutional quality index: a principal component analysis
The quality of institutions plays a vital role in raising cross-country capital stocks in developing countries, as found in Nemlioglu and Mallick (Reference Nemlioglu and Mallick2020). Here, we examine whether institutional quality has any role in reducing exchange rate misalignments in those economies. Therefore, we first investigate the direct role of each of the six dimensions of institutional quality by introducing them in a step-by-step manner. Institutions are first added one at a time in Table 8 from columns 1 to 6 (also see the correlation matrix in Appendix A-1b). Interestingly, we found that economies operating under a fixed currency regime can limit the degree of misalignment in countries with improved institutions.
Recently, there has been a lot of attention on the role of institutional quality and its impact on economic development. Different authors used different proxies for the quality of institutions. For instance, Chen and Chen (Reference Chen and Chen2018) used Kaufmann et al.'s (Reference Kaufmann, Kraay and Mastruzzi2010) WGI by taking the average of the six indicators listed earlier, whereas Challe et al. (Reference Challe, Lopez and Mengus2019) only used three of them. However, the indicators used in the construction of the quality index are highly correlated with one another. Therefore, to sufficiently capture the common variation among these as a single measure, we develop an index that represents the overall quality of institutions using principal components analysis (henceforth PCA). The first principal component can be seen as the single linear combination of the quality indicators that explain most of the variations among them. Table 7 presents the institutional quality index (IQI). Eigenvalues of the six components suggest that the first component with an eigenvalue being greater than 1 is relevant and explains 77% of the sample variance. Considering the first component, we create an index of institutional quality using weights assigned to the first principal component. Based on the first principal component, we construct the institutional quality variable as follows:

where w ij is the component's loadings or weights on each of the indicators, and Xi refers to the original IQI variables. Subscript j denotes the country whereas i refers to the IQI indicators:

Table 7. PCA for the IQI

Notes: The table presents the results of the PCA. PC1 to PC6 indicate principal components from 1 to 6. As the eigen value of PC1 is 4.64759 being greater than 1, we only take this component. We take corresponding weights of the PC1 for six variables to form the IQ index.
Table 8. Institutions with exchange rate regimes

Notes: The dependent variable is the Residuals (EREER) saved from the REER equation (transformed to exponential form). Standard errors are reported in parentheses. ***, **, * indicate the significance at 1, 5 and 10% levels, respectively. The models are estimated using OLS and including time and country-fixed effects.
Therefore, after generating a single measure for the institutional quality variables, we then used this combined variable in Table 8 (columns 7, 8 and 9), to investigate the role of the institutional quality with Regimes3, 2 and 1, respectively. We found (in column 7) that institutional quality plays a significant role in reducing misalignment in all three regimes, meaning that better institutional quality contributes to the aligning of exchange rates regardless of the exchange rate regime.
The estimable equation with institutional quality is formulated as follows:

The institutional quality can reduce misalignment directly regardless of the exchange rate regime choice as per the results of Table 8. However, we also investigate the indirect role of institutional quality in reducing the misalignment across different currency regimes. In Table 9, the impact of institutions with a fixed regime is significant at the 1% level. This indicates that economies can have a fixed regime, but with improved institutional quality, misalignment could be reduced, and that these countries can also benefit from enhanced competitiveness. We can, therefore, conclude that across all currency regimes (flexible, fixed and intermediate regimes), countries with better quality of institutions can achieve improved competitiveness by reducing misalignment.
Table 9. Impact of FO and institutions with three regimes

Notes: The dependent variable is the Residuals (EREER) saved from the REER equation (transformed to exponential form). Standard errors are reported in parentheses. ***, **, * indicate the significance at 1, 5 and 10% levels, respectively. The models are estimated using OLS and including time and country fixed effects.
Exploring the channels: does IT matters in the nexus between institutional quality and exchange rate misalignment?
In recent decades, IT has emerged as a key monetary policy framework in maintaining price stability. Here, we investigate whether IT plays any role in reducing exchange rate misalignment in emerging markets. Different countries have implemented this policy at different points in recent decades. It is natural to expect countries adopting such IT-type monetary policy to have greater currency stability. When a new programme or policy change is implemented, the impact of this could be measured by looking at the differences between pre- and post-policy changes by using a ‘natural experiment’ type difference-in-differences (DD) approach (see Bertrand and Mullainathan, Reference Bertrand and Mullainathan2003). Although institutional quality makes a positive impact on reducing misalignment across countries, the extent of the change following the introduction of an IT policy is worth investigating. The DD approach allows us to capture the mean difference in the outcome variable between high institutional quality (IQ) and low IQ countries following IT, by removing biases due to omitted time-invariant factors and incorporating covariates into the model by adding nonparametric and kernel-based propensity score matching estimators. The estimations in Table 10 suggest that countries with better institutional quality benefit from lower REER misalignment following an IT policy intervention. The same result is also visualised in Figure 2, which clearly shows a distinction between control and treatment groups, namely IT and non-IT countries. Therefore, it is possible to see that countries adopting this policy intervention benefit from lower REER misalignment.
Figure 2. REER misalignment following IT policy.
Table 10. The impact of institutional quality following the IT policy in emerging countries

***p < 0.01, **p < 0.05, *p < 0.1.
Besides testing whether the differences in the quality of institutions matter in explaining cross-country variations in misalignments, we also challenge the relationship between institutional quality and exchange rate misalignment by testing the potential impact of the implementation of IT policies across countries. We test whether countries with stronger institutional quality tend to benefit from lower misalignment. The empirical analysis could be conducted in two ways. The first method is to employ a DD approach and the second is to add interaction terms to observe the joint impact. In Table 10, we used the first method, namely, DD estimations, and in Table 11, we estimate this by introducing interaction terms. The results suggest that following the IT policies, countries benefit from better FO, and higher institutional quality. We observe that IT policies can lower misalignments in fixed and flexible regimes whereas the reduction is indirect in intermediate regimes.
Table 11. Impact of IT Policy on institutional quality- exchange rate misalignment relationship

Notes: The dependent variable is the Residuals (EREER) saved from the REER equation (transformed to exponential form). Standard errors are reported in parentheses. ***, **, * indicate significance at 1, 5 and 10% levels. The models are estimated using OLS and including time and country dummies. Columns 1–3 show results for all time periods for all Regimes3, 2 and 1. Columns 4–6 and 8 show IT policies implemented for Regimes3, 1 and 2, respectively, whereas columns 5–7 and 9 show non-IT policies.
Persistence of misalignment
As indicated by Dubas (Reference Dubas2009) among others, in some economies, misalignment can persist over time depending on the past level of misalignment. Therefore, in Table 12, by using Lag(EREER) as a measure of misalignment in each regime, we investigate under which type of regimes misalignment persists. The model is defined as follows:

where the variables are defined as follows: |εit−1| is the lagged misalignment denoting the persistence of misalignment and ɛit is the disturbance term, i stands for the cross-section/country, j stands for regimes, t stands for time.
Table 12. Persistence of misalignment with exchange rate regimes

Notes: The dependent variable is the Residuals (EREER) saved from the REER equation (transformed to exponential form). Standard errors are reported in parentheses. ***, **, * indicate significance at 1, 5 and 10% levels. The models are estimated using OLS and including time and country dummies. The variable L(EREER) (one lag of Residuals) is used for persistence of misalignment.
Table 12 outlines that misalignment is persistent in all three regimes, thus reducing competitiveness. In column 1, we can see that the Regime1 coefficient is positive and significant. At the same time, the lag of misalignment shows the persistence of misalignment. In this sample, we find that some of the countries within a flexible regime may experience persistence of misalignment due to higher volatility. However, it could be corrected under this regime with better FO. We check the same argument for Regime2 and the results in column 2 illustrate that countries under intermediate regimes are less misaligned and more competitive. It is observed that misalignment is persistent, similar to the floating regime. The results also show that there is some degree of persistence; however, it can be corrected under an intermediate regime combined with greater FO. Furthermore, we also see that misalignment persists under Regime3 even with greater FO in an economy, where the misalignment does not get corrected as the regimes follow fixed arrangements. The same scenario has also been observed in country-wise graphs with regime-dummies. Therefore, from the above results, it is concluded that misalignment is persistent for this set of emerging countries in all three regimes. However, countries only within the intermediate and flexible regimes tend to show improvement in their competitiveness by having greater FO.
Robustness checks
Naceur et al. (Reference Naceur, Bakardzhieva and Kamar2012), among others, argue that attracting capital and foreign exchange flows is crucial for developing countries. Yet, these flows could lead to real exchange rate appreciation and may thus have detrimental effects on competitiveness, thus jeopardising exports and growth. They investigate this dilemma by comparing the impact of six types of flows on real exchange rate behaviour in a sample of developing countries. Three flows appear in the financial accounts of the balance of payments, namely foreign direct investment (FDI), portfolio investments (PORT) and other investments (DEBT). Three foreign exchange flows appear in the current account – remittances (REMIT), aid (AID) and income (INCOME).
In theory, one can argue that the impact of any of these flows on the REER depends on the types of expenditure each flow is tied to. Although an a priori assumption could be that capital flows, of any kind, can lead to REER appreciation, this might not be the case if the flows are tied to particular spending in certain countries that could have the opposite or no impact on the REER. The literature review reveals several cases in which the impact of different types of capital flows on REER is contradictory. Empirically, their results reveal that portfolio investments, foreign borrowing, aid and income lead to real exchange rate appreciation, while remittances have disparate effects across regions. Similar to Naceur et al. (Reference Naceur, Bakardzhieva and Kamar2012), we use five different types of inflows as follows: FDI, Official Development Assistance (ODA), debt, remittances and portfolio investments. To assess the empirical validity of our results, as a first robustness check, in Table 13, we replace the financial openness variable, i.e. FO, with actual capital inflows. A detailed description of these flows and data sources is provided in Table 5. Also, correlations are shown in Appendix 1a. The specification for Regime3 (fixed regimes) is presented in Table 14, as the second robustness check.
Table 13. Capital inflows with flexible and intermediate exchange rate regimes

Notes: (1) The dependent variable is the Residuals (EREER). (2) Standard errors are reported in parentheses. ***, **, * indicate significance at 1, 5 and 10% levels, respectively. (3) The models are estimated using OLS and by including time and country fixed effects. (4) Capital Inflows are used to replace FO in each column as per labelling for Regimes1 and 2.
Table 14. Capital inflows with fixed exchange rate regime

Notes: The dependent variable is the Residuals (EREER) saved from the REER equation (transformed to exponential form). Standard errors are reported in parentheses. ***, **, * indicate significance at 1, 5 and 10% levels, respectively. The models are estimated using OLS by including time and country fixed effects. Capital inflows replaced FO in each column as per labelling for Regime3.
To assess whether these flows behave in a similar way in the presence of greater FO, we introduce interaction terms of each inflow with subsequent regimes in Table 13. For instance: (FO × Regime1), (FDI × Regime1), etc. The results in this table reflect that debt and remittances have the same impact as FO in the baseline model. Debt and remittance receipts may reduce misalignment, thus improving competitiveness. At the same time, FDI, ODA and PORT have no impact on lowering positive misalignment because these flows reflect external improvement. The same analysis has been extended for Regime2 (intermediate regime) and Regime3 (fixed regime) in Table 14. In Regime2, we find that in columns 4 and 5, the direct impact of Debt and Portfolio is significant. The reason behind this could be that debt flows and portfolio investment increase the money supply, but the impact can be seen over the long-term depending on whether these inflows are invested in the tradable sector or non-tradable sector. In contrast, other inflows play no role in reducing misalignment. In Table 14, where we used Regime3 (fixed), ODA, Debt and Remit to directly reduce misalignment, the indirect impact of the regimes on the inflows–misalignment relation is found to be insignificant in Regime3.
Finally, as the third robustness check, we have replaced our dependent variable with the exchange rate volatility variable. We calculated the REER volatility between the years 1975 and 2014 with three alternative methods: namely, the currency volatility as the standard deviation of Ln REER as well as generating it through GARCH (1,1) and EGARCH (1,1) processes. The first one is obtained by using a moving standard deviation series. This way, we observe whether the impact of FO, currency regimes and institutional quality remain the same with an alternative specification of external competitiveness, namely REER volatility. The results from exchange rate volatility regression in Table 15 suggest that better institutional quality can directly reduce the exchange rate volatility in Regimes1 and 3, and indirectly in Regime2. Table 15 shows that currency volatility is lower in intermediate regimes if they have better quality of institutions.
Table 15. Alternative specification: impact of currency regimes and institutions on REER volatility

Notes: The dependent variable in the first three columns is the moving standard deviation of REER, indicating REER volatility. Standard errors are reported in parentheses. ***, **, * indicate significance at 1, 5 and 10% levels, respectively. The models are estimated using OLS and by including time and country fixed effects. From columns 4–6, we used Ln REER volatility measure obtained by GARCH (1,1) process whereas columns 7–9 used the Ln REER volatility obtained by EGARCH (1,1) process.
We include exchange rate volatility as an alternative to the currency misalignment measure as a dependent variable. Similar to Mallick and Marques (Reference Mallick and Marques2010), the volatility (conditional variances (cv)) of the exchange rates has been derived by employing the Generalised Autoregressive Conditional Heteroskedasticity (GARCH) modelling strategy, specifying the following GARCH (1,1) model:


After having estimated the conditional variances using this strategy, we used the resulting series as the dependent variable in Table 15 column 3 onwards. In addition to the GARCH (1,1) process, we also estimated the volatility by using E-GARCH (1,1) with the following specification:

where $\bar{\omega }_{t-1} = \varepsilon _{t-1}\sigma _{t-1}^{{-}1}$ .
.
All three alternative specifications have shown us that the currency volatility as a measure of misalignment is higher in fixed regimes alone and even in the presence of better institutional quality. Thus, our results remain robust to an alternative specification of REER volatility.
5 Conclusions
This paper attempted to uncover why some emerging economies are more competitive relative to others. We examined the role of different exchange rate regimes in currency misalignment while considering the institutional arrangements across countries. We used three types of institutional arrangements, namely trade agreements, IT-type monetary policy and general quality of governance. Estimating exchange rate misalignments from 35 emerging economies during 1975–2014 and using fixed effect regressions (including time and country fixed effects) and the DD estimation strategy, we make the following contributions to the literature.
First, we investigated the role of different exchange rate regimes in explaining currency misalignment. The results suggest that intermediate regimes reduce the REER misalignment in the presence of greater FO. REER misalignments in the economies under a fixed regime do not get reduced even with greater FO. Furthermore, when we explored the role of trade agreements in reducing misalignment, we found that countries under NRPTA can minimise misalignment under both fixed and flexible regimes, whereas countries that are part of FTAs can reduce misalignment if they have greater FO with flexible exchange rate regimes. Additionally, we examined the role of six governance indicators, each individually and also together, in reducing misalignment and found that better institutional quality can lower misalignments even under a fixed regime in addition to flexible ones. When we looked at the indirect influence of those indicators along with currency regimes, we found that the reduction in misalignment is possible under intermediate regimes. Moreover, we found that although FO alone does not help in reducing misalignments, it can indirectly contribute to countries with better institutional quality.
Furthermore, when we explored the impact of an ‘IT’ type monetary policy on REER misalignment, we found that countries with better institutional quality benefit from this policy intervention and that their external competitiveness improves. Next, we explored the persistence of misalignment and found that in countries under a flexible or intermediate regime, currency misalignment gets lowered if those economies are more financially open. On the contrary, misalignment is not lowered under fixed regimes. For a robustness check, we replaced FO with capital inflows for each currency regime and found that the inflows in the form of debt are important in reducing misalignment under all regimes. In addition, the impact of official flows shows strong evidence in reducing misalignment. Also, our results still hold even when we replace currency misalignment with alternative REER volatility measures, suggesting that better institutional quality reduces REER volatility in all regimes as in using REER misalignment.
Overall, this study provides new evidence on the role of exchange rate regimes in competitiveness and explores the role of institutional arrangements in this relationship. The main results of this paper are as follows. First, intermediate exchange rate regimes can ensure greater external competitiveness. Second, countries should focus on participation in trade agreements (NRPTA and FTA) to maintain a desired level of external competitiveness. Third, countries with better quality of institutions tend to benefit from a lower currency misalignment and become more competitive following an IT type of monetary policy framework. Finally, better institutional arrangements (whether monetary, trade or development-related) lower the volatility or misalignment of REER regardless of the exchange rate mechanism used.
Acknowledgements
The authors would like to thank the editor and four anonymous reviewers of this journal for their very constructive comments and suggestions on an earlier version of this paper.
Conflict of interest
The authors state that there is no conflict of interest.
Appendix A
Table A1. Correlation matrices


 Open access