


1 Introduction
Greenland ice-sheet's mass balance was close to zero for about two decades before the 1990s (1972–1990, Mouginot and others, Reference Mouginot2019), and possibly longer (1961–1990, van den Broeke and others, Reference van den Broeke2016). The mass balance has since shifted to strong negative values, e.g. −247 ± 15 Gt a−1 during 2012–2016 (Bamber and others, Reference Bamber, Westaway, Marzeion and Wouters2018) and −320 Gt a−1 in 2019 (Tedesco and Fettweis, Reference Tedesco and Fettweis2020). Since the 2000s, increased surface melt and runoff caused the surface mass balance to be the largest contributor to the total mass loss (55 ± 5% between 1998 and 2018, Mouginot and others, Reference Mouginot2019; 68% between 2009 and 2012, Enderlin and others, Reference Enderlin2014). Most of this meltwater forms in the ablation zone where it runs off in channels on and under the ice sheet (van den Broeke and others, Reference van den Broeke2016). The remaining meltwater is generated in the percolation zone (Steger and others, Reference Steger2017), i.e. the lower part of the accumulation zone between the ablation and dry snow zones (Benson, Reference Benson1962; Cogley and others, Reference Cogley2011). Here, some meltwater may run off. However, most of it infiltrates into the subsurface snow and firn layers and ultimately refreezes (van den Broeke and others, Reference van den Broeke2016) at varying depths depending on the amount, snow/firn layer thickness and temperature. Percolation zone meltwater may also remain unfrozen in firn aquifers (Forster and others, Reference Forster2014), but this process is predominantly occurring in limited geographic regions in northwest and southeast Greenland (Brangers and others, Reference Brangers2020; Miller and others, Reference Miller2020). Firn can extend vertically down tens of meters before it compresses into ice (e.g. 80 m on Summit, the highest point of the Greenland ice sheet, Alley and Koci, Reference Alley and Koci1988). Regional climate models suggest that ice-sheet wide, 41–46% of the liquid water input (meltwater and liquid precipitation) refreezes within the firn (Steger and others, Reference Steger2017). Concurrent with the increase in surface melt, an increase in refreezing starting in the mid-1990s is seen in both regional climate models (e.g. Noël and others, Reference Noël2017), and in situ observations in shallow (10–20 m) firn cores (Machguth and others, Reference Machguth2016; Graeter and others, Reference Graeter2018; Vandecrux and others, Reference Vandecrux2019).
The question whether increasing firn ice content facilitates runoff and thus accelerates ice-sheet mass loss was brought forward in the early 1990s (Pfeffer and others, Reference Pfeffer, Meier and Illangasekare1991; Braithwaite and others, Reference Braithwaite, Laternser and Pfeffer1994). Field observations indicate that during extreme melt events, water can infiltrate the firn several meters before refreezing and well below the winter snowpack (Humphrey and others, Reference Humphrey, Harper and Pfeffer2012; Charalampidis and others, Reference Charalampidis2016; Heilig and others, Reference Heilig, Eisen, MacFerrin, Tedesco and Fettweis2018). Thus, firn's capacity to absorb meltwater (refrozen or also in firn aquifers, Forster and others, Reference Forster2014) could temporarily buffer against amplified ice-sheet runoff for decades (Pfeffer and others, Reference Pfeffer, Meier and Illangasekare1991; Harper and others, Reference Harper, Humphrey, Pfeffer, Brown and Fettweis2012; van Angelen and others, Reference van Angelen, Lenaerts, van den Broeke, Fettweis and van Meijgaard2013). However, the formation of thick near-surface ice layers (i.e. ice slabs, MacFerrin and others, Reference MacFerrin2019) may prevent infiltration of meltwater into the underlying firn for some regions of the percolation zone (Benson, Reference Benson1962; Pfeffer and others, Reference Pfeffer, Meier and Illangasekare1991; Harper and others, Reference Harper, Humphrey, Pfeffer, Brown and Fettweis2012). Several studies documented ice layers of various thicknesses in firn cores, with the earliest studies conducted in the 1950s, before melting increased in the mid-1990s (Benson, Reference Benson1962; Braithwaite and others, Reference Braithwaite, Laternser and Pfeffer1994; Harper and others, Reference Harper, Humphrey, Pfeffer, Brown and Fettweis2012). Thick impermeable ice layers (up to 5.5 m) were discovered in the lower percolation zone in spring 2013 (Machguth and others, Reference Machguth2016). Following the extreme melt season of 2012 (Nghiem and others, Reference Nghiem2012), these meter thick ice layers prevented meltwater percolation and refreezing into deeper firn layers, thereby increasing runoff (Machguth and others, Reference Machguth2016; MacFerrin and others, Reference MacFerrin2019).
Shallow firn core observations, including data from 1953 to 2017, reveal increased firn density and firn ice content in the Greenland ice-sheet percolation zone (de la Peña and others, Reference de la Peña2015; Machguth and others, Reference Machguth2016; Vandecrux and others, Reference Vandecrux2019) concurrent with decreased surface mass balance and rapidly increasing surface melting since the early 1990s (e.g. Sasgen and others, Reference Sasgen2020; Tedesco and Fettweis, Reference Tedesco and Fettweis2020). However, in the 2003–2018 period, low surface melting and high accumulation in the last 2 years (2017–18) resulted in the most positive mass-balance anomaly (+137 ± 25 Gt a−1) relative to the 2003–13 mean (−235 ± 29 Gt a−1) (Sasgen and others, Reference Sasgen2020). It is unknown how the less negative mass-balance years of 2017 and 2018 influenced Greenland firn density and ice content.
Here, we present 19 shallow firn cores drilled in the percolation zone in southwest Greenland between 2017 and 2019, thus extending the period covered by previously published cores (Kameda and others, Reference Kameda, Narita, Shoji, Fujii and Watanabe1995; Machguth and others, Reference Machguth2016; Graeter and others, Reference Graeter2018). We compare these new cores to 27 previously published cores, drilled between 1989 and 2017 in the study area. This unique comprehensive dataset of 46 firn cores, from 15 individual sites up to 128 km apart, is used to investigate the spatial and temporal variations in firn density and ice layer thickness over the elevation range of 1850–2360 m a.s.l. and time period between 1989 and 2019. Additionally, to examine if the depth–age relationship in the study area has changed over time, we glaciochemically analyze one core and compare with previously established relationships in four cores collected between 1989 and 2016.
2 Data and methods
2.1 Firn cores
All cores used in this study are listed in Table 1, and locations are shown in Figure 1 (detailed location information is listed in Supplementary Table S1). Cores were labeled with site name, collection year and a sequential number if more than one core was drilled in any year (e.g. KAN_U-09-1). Existing site names were used when available in the literature to identify core sites with previously published cores (KAN_U, Site J, Core 3, Core 4, Core 7, Core 8, Dye-2 and EKT), and new locations were named with letters from A to G, from lower to higher elevation. At Sites A–G only one core was retrieved at each site, while the remaining sites had between 2 and 13 cores collected over multiple years (Table 1). Almost all studied cores (41 out of 46) are ≥10 m long, 32 cores are >15 m long (Table 1). Existing cores shorter than 10 m were not considered with the exception of five cores at the KAN_U site used to investigate recent firn evolution above the thick ice layers that formed in response to intensified melting, particularly in 2012. We use the entire length of the firn cores down to 27 m to examine all cores' firn stratigraphy visually, however, since the cores vary in length, only the top 15 m were used for statistics. All cores were drilled between 2012 and 2019 with the exception of two cores drilled in 1989 and 1998 as well as two cores drilled in 2009.

Fig. 1. Study area and location of firn cores considered in this study including previously published and newly drilled cores in 2017–19. Elevation contours in m a.s.l. are estimates based on the ArcticDEM 1 km v.3.0 product by Polar Geospatial Center (Porter and others, Reference Porter2018) adjusted with the EGM2008 geoid offset (Pavlis and others, Reference Pavlis, Holmes, Kenyon and Factor2012). The elevation contours are spaced 10 m in the inset map with Sites A to F.
Table 1. Characteristics of firn cores used in this study including core retrieval date and elevation from the ArcticDEM 1 km v.3.0 product by Polar Geospatial Center (Porter and others, Reference Porter2018) adjusted with the EGM2008 geoid offset (Pavlis and others, Reference Pavlis, Holmes, Kenyon and Factor2012)

Firn core length is the length of each core below the surface (including the winter snow layer). Segment length refers to the mean length for which an average density was determined (±std dev.).
Source refers to (1) this study, (2) Machguth and others (Reference Machguth2016), (3) MacFerrin and others (Reference MacFerrin2019), (4) Vandecrux and others (Reference Vandecrux2019), (5) Kameda and others (Reference Kameda, Narita, Shoji, Fujii and Watanabe1995), (6) Mosley-Thompson and others (Reference Mosley-Thompson2001) and (7) Graeter and others (Reference Graeter2018).
2.1.1 New cores drilled in 2017–19
During 4 weeks in April–May 2017, 2018 and 2019, 19 shallow firn cores were retrieved at 15 sites (Fig. 1; Table 1). Two cores drilled at KAN_U extended to 2.9 and 4.9 m depth, with the remaining 17 cores extending to 10–27 m depths (Table 1), which is well above the pore close-off depth where firn transitions into ice in the study area (~60-m at Site J in 1989, Kameda and others, Reference Kameda, Narita, Shoji, Fujii and Watanabe1995).
Core sections of different lengths (0.81 ± 0.11 m, mean ± std dev.) were retrieved sequentially with a mechanical ice-coring drill provided by the U.S. Ice Drilling Program. The drill set-up included a 2-m barrel (0.079 m diameter) connected to a Sidewinder (power hand drill and winch system, Kyne and McConnell, Reference Kyne and McConnell2007). The borehole depth was measured after each section was retrieved. Ice core sections were photographed, and their total length was measured. Sections either broke naturally or were cut into shorter segments with a mean length (±std dev.) of 0.13 ± 0.03 m (Table 1). Each core segment's weight, diameter and length were measured, its intactness estimated (i.e. the segment's volume relative to the volume of a complete cylinder for that segment's length) and the type of material logged (i.e. snow, firn or ice). The ice layer stratigraphy of each segment was recorded at a vertical resolution of 0.005 m, including position and layer thickness. Thinner ice layers were also recorded and assigned a length of 0.0025 m. Core segment density was calculated using length, weight, diameter and volumetric intactness data. The density and stratigraphy of the winter snow layer were determined in snow pits. Further details on core drilling, snow pit analyses and error assessment are given in Supplementary Text 1. The mean length-weighted ice density (±uncertainty) of all sections that were exclusively ice in the 19 new cores was calculated to be 862 ± 38 kg m−3 (using ice layer >0.05 m and omitting unreasonable observations here defined by measured densities of <750 kg m−3 or >917 kg m−3). This ice density value is within the range of previous estimates (843 ± 36 kg m−3 by Harper and others, Reference Harper, Humphrey, Pfeffer, Brown and Fettweis2012, and 873 ± 25 kg m−3 by Machguth and others, Reference Machguth2016). A density lower than 917 kg m−3 is expected because ice-only core segments typically contain air bubbles lowering density compared to pure ice.
2.1.2 Data from previously published cores
For comparison, we incorporate data from a set of 27 previously published cores drilled between 1989 and 2017 in the study area (Table 1). All core records include data on density and ice layer stratigraphy. Of those cores, 14 cores were drilled in 2009, 2012 and 2013 (Machguth and others, Reference Machguth2016), four cores were drilled in 2015–17 at KAN_U (MacFerrin and others, Reference MacFerrin2019), six cores were drilled in 2015–17 at Dye-2 and EKT (Montgomery and others, Reference Montgomery, Koenig and Alexander2018; Vandecrux and others, Reference Vandecrux2019) and one core was drilled in 2016 at Core 7 (hereafter Core 7-16; Graeter and others, Reference Graeter2018; Lewis and others, Reference Lewis2019).
To investigate decadal-term changes in firn stratigraphy we include data from two older cores (hereafter referred to as ‘legacy cores’): (1) a 206.6 m core record drilled at Site J in 1989 (Kameda and others, Reference Kameda, Narita, Shoji, Fujii and Watanabe1995; Kameda, Reference Kameda2015) and (2) a 20.5 m core drilled at Dye-2 in 1998 (Mosley-Thompson and others, Reference Mosley-Thompson2001; data are available at the National Snow and Ice Data Centers data repository, https://nsidc.org/data/NSIDC-0624/versions/1). These legacy cores are hereafter referred to individually as Site J-89 and Dye-2-98, and collectively as legacy cores. At Site J, the density is a composite of two cores located 10 m apart (0–2.42 m is from a 7 m long core, and density from 2.42 m and below is from a 206.6 m long core). At Dye-2 in 1998, a second 120.9 m core drilled in 1 m away from the 20.5 m core, but was not used in this study since the top sections of this longer core were of poor quality.
2.2 Depth–age relationship
One of the new cores, Core 8-18, was glaciochemically analyzed to determine its depth–age relationship. The core was sampled at ~0.05 m resolution using a continuous ice core melter system with discrete sampling in the Dartmouth College Ice Core Laboratory (Osterberg and others, Reference Osterberg, Handley, Sneed, Mayewski and Kreutz2006). An Abakus (Klotz) laser particle detector continuously measured microparticle concentrations directly from the ice core meltwater stream. We measured major ion (Na+, NH4+, K+, Mg2+, Ca2+, Cl−, NO3− and SO42−) and methanesulfonic acid concentrations using a Dionex Model ICS5000 capillary ion chromatograph. Oxygen isotope ratios (δ18O, δD) were measured using a Picarro L1102-I and a Los Gatos Research Liquid Water Isotope Analyzer. We then determined the depth–age relationship by identifying annual layers based on robust seasonal oscillations in δ18O and the concentrations of major ions, methanesulfonic acid and dust, consistent with previous ice core studies from west Greenland (Mosley-Thompson and others, Reference Mosley-Thompson2001; Osterberg and others, Reference Osterberg2015; Graeter and others, Reference Graeter2018).
To examine potential trends in the depth–age relationship in the study area, we used the depth–age relationships established for four other cores in the study area, including the two legacy cores also used for comparing firn stratigraphy (Site J-89 and Dye-2-98), the 30.7 m Core 7-16 (Graeter and others, Reference Graeter2018; Lewis and others, Reference Lewis2019) and a 300 m long core (ACT11-D) drilled 1 km from the Dye-2 site in 2011 (hereafter Dye-2-11; McConnell and others, Reference McConnell2019). The vertical resolution of the density and age measurements were 1.0 ± 0.0 m for Site J-89, 0.67 ± 0.26 m for Dye-2-98, 0.43 ± 0.12 m for Dye-2-11, 0.60 ± 0.15 m for Core-7-16 and 0.08 ± 0.02 m for Core-8-18.
These five dated cores retrieved at four sites (Site J, Dye-2, Core 7 and Core 8) between 1998 and 2019 allowed us to examine uncertainties of the depth–age relationship related to the different methods, and temporal changes due to differing net snow accumulation rates. Additionally, depth–age uncertainties may stem from meltwater that percolates and refreezes below the annual snow accumulation layer (Humphrey and others, Reference Humphrey, Harper and Pfeffer2012; Heilig and others, Reference Heilig, Eisen, MacFerrin, Tedesco and Fettweis2018), which means that some of the ice layers in the bottom part may include ice created from meltwater that originated in the upper part of the core.
2.3 The Herron–Langway model
The empirically derived Herron–Langway model (Herron and Langway, Reference Herron and Langway1980) of firn densification was applied to calculate the hypothetical density profile in the absence of meltwater infiltration and refreezing, which the model ignores. In this study, we use the analytical version described in Lundin and others (Reference Lundin2017), which requires inputs of average snow accumulation rate (i.e. the mass gained from snowfall each mass-balance year), near-surface air temperature and snow density. Snow density was obtained from the average density of each core's winter snowpack layer (extending from the surface down to between 0.40 and 1.10 m depending on the core location). Average snow accumulation rate and 2 m near-surface air temperature for the 30 years before each site's coring year (roughly the time it takes in our study area for 20 m of firn to accumulate, and the length of climatological standards as defined by the World Meteorological Organization; WMO, 2017) were obtained from the Modèle Atmosphérique Régional (MAR) regional climate model (Fettweis and others, Reference Fettweis2017, and references therein). For the legacy cores (Site J-89 and Dye-2-98), MAR snow accumulation rate and 2 m near-surface temperature were calculated using data between 1980 and 2010, and the top layer in each core was assumed to represent snow and used to parameterize snow depth and density. We use MAR version 3.11 run at a horizontal spatial resolution of 7.5 km using the ERA5 reanalysis dataset as forcing at the boundaries (Fettweis and others, Reference Fettweis2020, Reference Fettweis2021).
3 Results
3.1 Depth–age relationship
The depth–age relationships of the five dated cores reveal that the firn is on average 14.2 years and 21.4 years older than the surface layer at 10 and 15 m depth, respectively (Fig. 2). Despite being separated by up to 78.5 km in distance and 310 m in elevation, and drilled up to 21 years apart, the five cores' depth–age relationships are similar. The average slopes of the depth–age relationship in the top 20 m of each core (16 m in Core 8) range from 1.4 to 1.7 a m−1, with std dev.s ranging from 0.4 to 0.8 a m−1 (Supplementary Fig. S1). Thus, each of the five cores’ average slopes are within one std dev. of the other four cores in the top 20 m. Cores that extend beyond 20 m (Site J-89 and Dye-2-11) reveal an increasing slope of the depth–age relationship below 20 m (i.e. due to increasing compaction of firn with depth; Supplementary Fig. S1). However, depth–age relationship slopes do not have any strong trend in the top 20 m, except for a small increase below 15 m in the Dye-2-98 and Dye-2-11 cores. Depth–age relationship slopes are independent of the cores' age and elevations. The oldest (Site J-89) and the most recent core (Core 8-18) have the lowest average slope of the depth–age relationships (1.5 ± 0.7 and 1.4 ± 0.4 a m−1, respectively). Coincidentally, those two cores are also the cores located at the lowest and highest elevation (Site J at 2040 m a.s.l. and Core 8 at 2250 m a.s.l.).

Fig. 2. Depth–age relationship in firn cores drilled at Site J in 1989, Dye-2 in 1998 and 2011, Core 7 in 2016, and Core 8 in 2018, and mean and std dev.
3.2 Spatial variability of 2017–19 cores
Firn density and ice layer stratigraphy in the 17 cores extending ≥10 m depth drilled between 2017 and 2019 (Table 1; Figs 1, 3) vary substantially between the 14 sites (Fig. 3; Table 2), indicating strong elevation dependence. The thickness of all ice layers of the core's upper 10 m ranges from 86% (Site A) to 14% (Core 8), decreasing with a linear trend of 15% per 100 m of elevation (R 2 = 0.84, p < 0.01) (Fig. 1; Table 2).
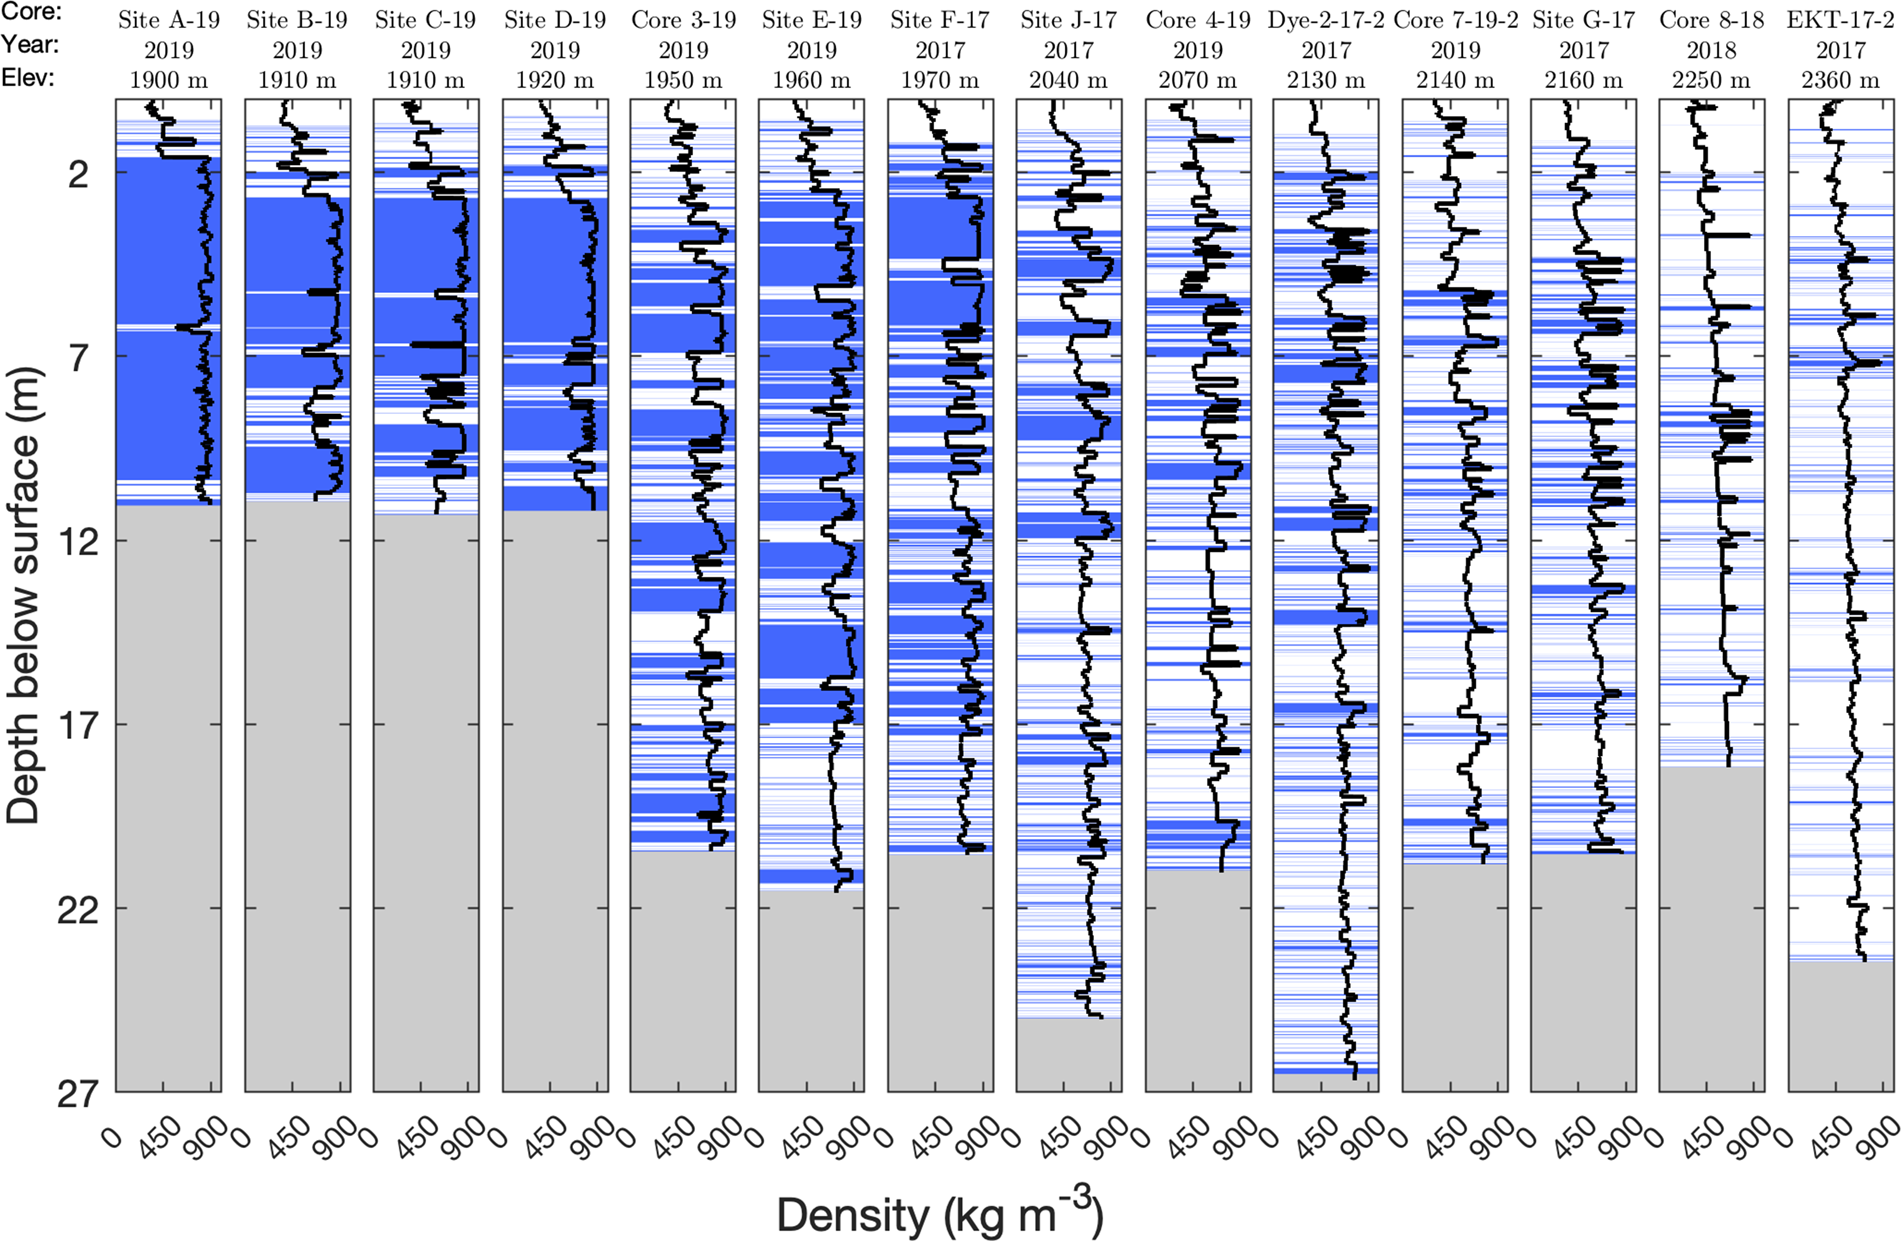
Fig. 3. Firn density and stratigraphy for 14 of the previously unpublished cores longer than 10 m drilled in 2017, 2018 and 2019. When multiple cores were available (three cores at Dye-2 and two at Core 7), the longest core is visualized here. Cores are ordered from low to high elevation (left to right). Elevation is from the ArcticDEM in m a.s.l. and collection years are listed below each site name. Mean density for each measured segment is shown in black lines, ice layers are shown in blue and gray-shaded regions indicate no data.
Table 2. Selected statistics of the top 10 m of the new 2017–19 firn cores including mean density, ice layer fraction (i.e. the thickness of all ice layers divided by the total thickness of the firn column), mean ice layer thickness, h max, and depth below the surface of the top of the thickest ice layer, D max

Sites are listed from lowest (Site A) to highest elevation (EKT).
Length-weighted mean density of all core segments of the top 10 m ranges from 786 kg m−3 (Site A) to 499 kg m−3 (Core 8) (Table 2). Density in the top 10 m decreases by 63 kg m−3 per 100 m of elevation (R 2 = 0.88, p < 0.01). At all sites, core density generally increases with depth, but local positive density anomalies typically occur where ice layers are found (Fig. 3). Maximum and mean ice layer thickness increase exponentially (R 2 = 0.87 and 0.71, respectively) with decreasing elevation. Maximum ice layer thickness ranges from 0.2 m (EKT) to 4.5 m (Site A), while mean ice layer thickness ranges from 0.02 ± 0.02 m (EKT) to 0.40 ± 1.30 m (Site A) (Fig. 3). The thickest ice layers at lower elevation sites (≤1970 m a.s.l., i.e. Site F and lower) are close to the surface (ice layer top between 1.6 and 4.0 m), while at higher elevations (>1970 m a.s.l.) they are considerably deeper (ice layer top between 5.7 and 8.8 m). Core 3-19 at 1950 m a.s.l. is an anomaly among the low-elevation sites by having its thickest ice layer at 5.8 m depth.
3.3 Temporal changes in core stratigraphy 1989–2019
In this section, we compare firn cores from different years drilled at the same sites (8 out of 15 sites). Site J and Dye-2 provide the longest time perspective with 28 years (1989–2017 at Site J) and 21 years (1998–2019 at Dye-2) between the oldest and last available core (Dye-2 cores drilled between 2013 and 2019 are analyzed separately below). At both sites, firn density and ice layer fraction in the top 15 m increased considerably between 1989 and 2017 (Site J) and 1998 and 2019 (Dye-2) (Fig. 4 and Supplementary Fig. S2). Mean density increased by 18% at Site J (from 536 to 631 kg m−3) and by 15% at Dye-2 (from 515 to 591 kg m−3), and ice layer fraction almost doubled at Site J and more than tripled at Dye-2.

Fig. 4. Comparison of ≥10 m long cores at sites with multiple cores, arranged left to right and top to bottom in elevation order. For KAN_U, Dye-2, Core 7 and EKT where multiple cores were drilled in some years, only the longest core from any year is presented here. See Figure S2 in Supplementary material for all cores drilled at these sites. Elevations are from the ArcticDEM.
Next, we consider all sites with one core from 2013 and a second core from 2017, 2018 or 2019 (seven sites). We first explore density depth profiles at these sites (Fig. 5a) and then examine density changes since 2013 (Fig. 5b). We exclude ice layer thickness from this analysis because ice layers were recorded with different resolutions (i.e. specifically ice layers <0.01 m were recorded differently, Section 2.1), and appear to be underreported in the 2013 cores. This ice layer underreporting is most evident below 7 m depth at Core 7, Core 8 and EKT. By using the average slope of 0.6 m a−1 from the depth–age relationships (Fig. 2) the 7 to 15 m layer should be at 8.2 to 16.2 m depth in 2015, and at 10.6 to 18.6 m depth in 2019. Visual analysis of ice layer stratigraphy reveals considerably less ice in the 2013 cores between 7 and 15 m depth than at the expected time-equivalent depths in cores drilled between 2015 and 2019 (Fig. 4).

Fig. 5. (a) Average density for the 2013 cores, and (b) change in density of each site's most recent core (2017, 2018 or 2019, observation year is shown in the x-axis label for each site) in percent relative to 2013 at different depths. Averages were used for sites with multiple cores in the same year.
At the seven sites with at least one core from 2013 and from a later year, all but one of the sites show a general increase of density with depth (Fig. 5a). The two 2013 cores at KAN_U are notable exceptions, lacking a trend with depth. These cores have consistent high density throughout the top 15 m with density averaged over 3.75 m depth intervals ranging between 732 and 816 kg m−3. Density changes over time depend on depth. At all sites but KAN_U, density decreased (−18 to −7%) in the near-surface layer (<3.75 m) between 2013 and the last observation (i.e. 2017, 2018 or 2019). In contrast, the bottom layer (>11.25 m) density changes are small or negligible, while both density increases and decreases are found in the two middle depth layers (3.75–11.25 m). At four of the seven sites, more than one core was available either in 2013 or the most recent collection year (KAN_U, Dye-2, Core 7 and EKT). However, density differences were small in cores drilled in the same year at the same site compared to changes over time (using individual cores instead of averages in Fig. 5b only changed the results by −4 to 3%). At the same four sites, cores were drilled in multiple years after 2013, and we found that the density decrease pattern seen in Figure 5b applies to all years following 2013 (Supplementary Fig. S3).
At KAN_U, a total of 13 cores were drilled between 2009 and 2019, and provide more details on the evolution of the near-surface firn (longest core is shown in Fig. 6a; others in Supplementary Fig. S2). In sharp contrast to the 2009 core, the three 2012 cores have thick ice layers (defined here as >0.5 m) ranging between 0.6 and 1.5 m in the top 5 m (Fig. 6a and Supplementary Fig. S2). In 2013, the top of thick, near-surface ice layers (1.1 and 1.5 m long), was at 0.8 and 1.0 m depths (Fig. 6a and Supplementary Fig. S2). Following 2013, the length of the near-surface ice layers varied between 1.1 and at least 4.6 m (the bottom extent of these layers was not captured in 2018 and 2019). The depth of the top of this thick ice layer varied between 1.0 and 1.7 m depth between 2013 and 2019 (Fig. 6a and Supplementary Fig. S2). Although the top of the thick ice layer at KAN_U remains near the surface between 2012 and 2019, an ice-layer-rich section between 1.5 and 2.5 m at EKT in 2013 appears to have moved below 3 m depth in subsequent years. At EKT, the newly formed near-surface firn contains fewer ice lenses than those in 2013. This downward shift of ~1.5 m since 2013 is consistent with the average slope of the depth–age relationship (Fig. 2), indicating that a near-surface layer in 2013 should be 1.2–2.4 m lower 2–4 years later. A similar downward migration of near-surface ice layers, characteristic of the 2013 cores, is observed elsewhere (e.g. Core 3, Core 4, Core 7 and Core 8; cf. Fig. 4).

Fig. 6. Comparison of firn stratigraphy and density for each core's top 5 m at (a) KAN_U and (b) EKT. In years with multiple cores, the longest core is shown. Winter snow depths refer to averages of up to three observations made during within a few days of core retrieval (Table 1). The red line indicates the top of the ice layer closest to the surface with at least 0.5 m in length.
3.4 Elevation dependence of firn properties
Here, we examine the elevation dependence for density and ice thickness in the top 15 m of each core and in four 3.75 m depth layers individually extending from the surface to 15 m. Similar to the elevation dependence of the top 10 m of the new 2017–19 cores (Section 3.2), density and the thickness of all ice layers of the core's upper 15 m of all cores show strong inverse linear relations with elevation (R 2 = 0.82, p < 0.01 for density, and R 2 = 0.83, p < 0.01 for ice layer thickness), as well as in the four 3.75 m depth layers (R 2 = 0.75–0.79, p < 0.01 for both variables) (Fig. 7, confirming visual analysis of Figs 3, 4). The rate of change of ice layer fraction with elevation is similar in the top 15 m and all four 3.75 m depth layers (−0.09 ± 0.02 to −0.16 ± 0.03% m−1, uncertainty is the 95% confidence interval, c i). In contrast, the rate of change of density with elevation is −0.48 ± 0.09 kg m−4 (uncertainty is c i) in the top 15 m, and statistically significantly (α = 0.05) greater in the two top layers (−0.55 ± 0.09 and −0.64 kg ± 0.11 kg m−4) compared to the two bottom layers (−0.41 ± 0.08 and −0.41 ± 0.08 kg m−4).

Fig. 7. (a) Mean density and (b) ice layer fraction vs elevation for the top 15 m of each core. Observations (filled circles) are shown including a linear fit (red). The black dots in (a) shows density modeled with the Herron–Langway (HL) model at each site using specific average snowfall and temperature calculated for the 30 years prior to coring using MAR simulations. The black line is the best fit between modeled density and elevation.
Mean densities of the upper 15 m estimated with the Herron–Langway model have no statistical significant variation with elevation and vary from 450 to 534 kg m−3 (Fig. 7a). At the lowest elevations there is a large difference between observed densities and those modeled with the Herron–Langway model. The deviation of observations and Herron–Langway densities decrease with increasing elevation, and are almost eliminated at the highest elevations for both the top 15 m (Fig. 7b) and the four 3.75 m depth layers (data not shown).
The two legacy cores (i.e. Site J-89 and Dye-2-98) are poorly captured by the linear elevational relationships of density and ice layer fraction (Fig. 7). In fact, using the linear elevation relationships with density and ice layer fraction, determined with all cores, predicts that the Site J-89 and Dye-2-98 sites should be at 141 and 200 m higher elevation, respectively. Furthermore, the legacy cores' densities are very similar to those modeled with the Herron–Langway model (Fig. 7a), which suggest relatively little meltwater infiltration and refreezing taking place at these sites prior to 1989 and 1998.
3.5 Change over time in firn properties detrended for elevation
To examine temporal changes within the entire set of 30 >15 m firn cores collected after 2012, we remove the elevation-dependent trend in density and ice layer fraction using linear fits derived for four 3.75 m depth layers of the uppermost 15 m (similar to Section 3.4 but only using data after 2012). The elevation-detrended density and ice layer fraction anomalies are averaged over all cores available in each year (Figs 8b, c). To minimize the issues with different ice layer precision for <0.01 m ice layers among cores, and the suspected ice layer underreporting in some 2013 cores (Section 3.4) we only used ice layers 0.01 m and thicker. Average snow depth measured at our study sites in 2012–13 and 2015–19 and positive degree-day (PDD) sum derived from weather station data at Dye-2 are shown for context (Fig. 8a). Although PDD sums simplify the complexities of surface melting, it generally is a good melt proxy due to the typically high correlations between PDD sums and melt (e.g. Hock, Reference Hock2005). Modeling studies show that liquid precipitation is only a minor fraction of the total surface meltwater production over the ice sheet (e.g. ~5% between 1991 and 2015; van den Broeke and others, Reference van den Broeke2016). Thus, almost all liquid meltwater input at our sites is most likely from surface melting.
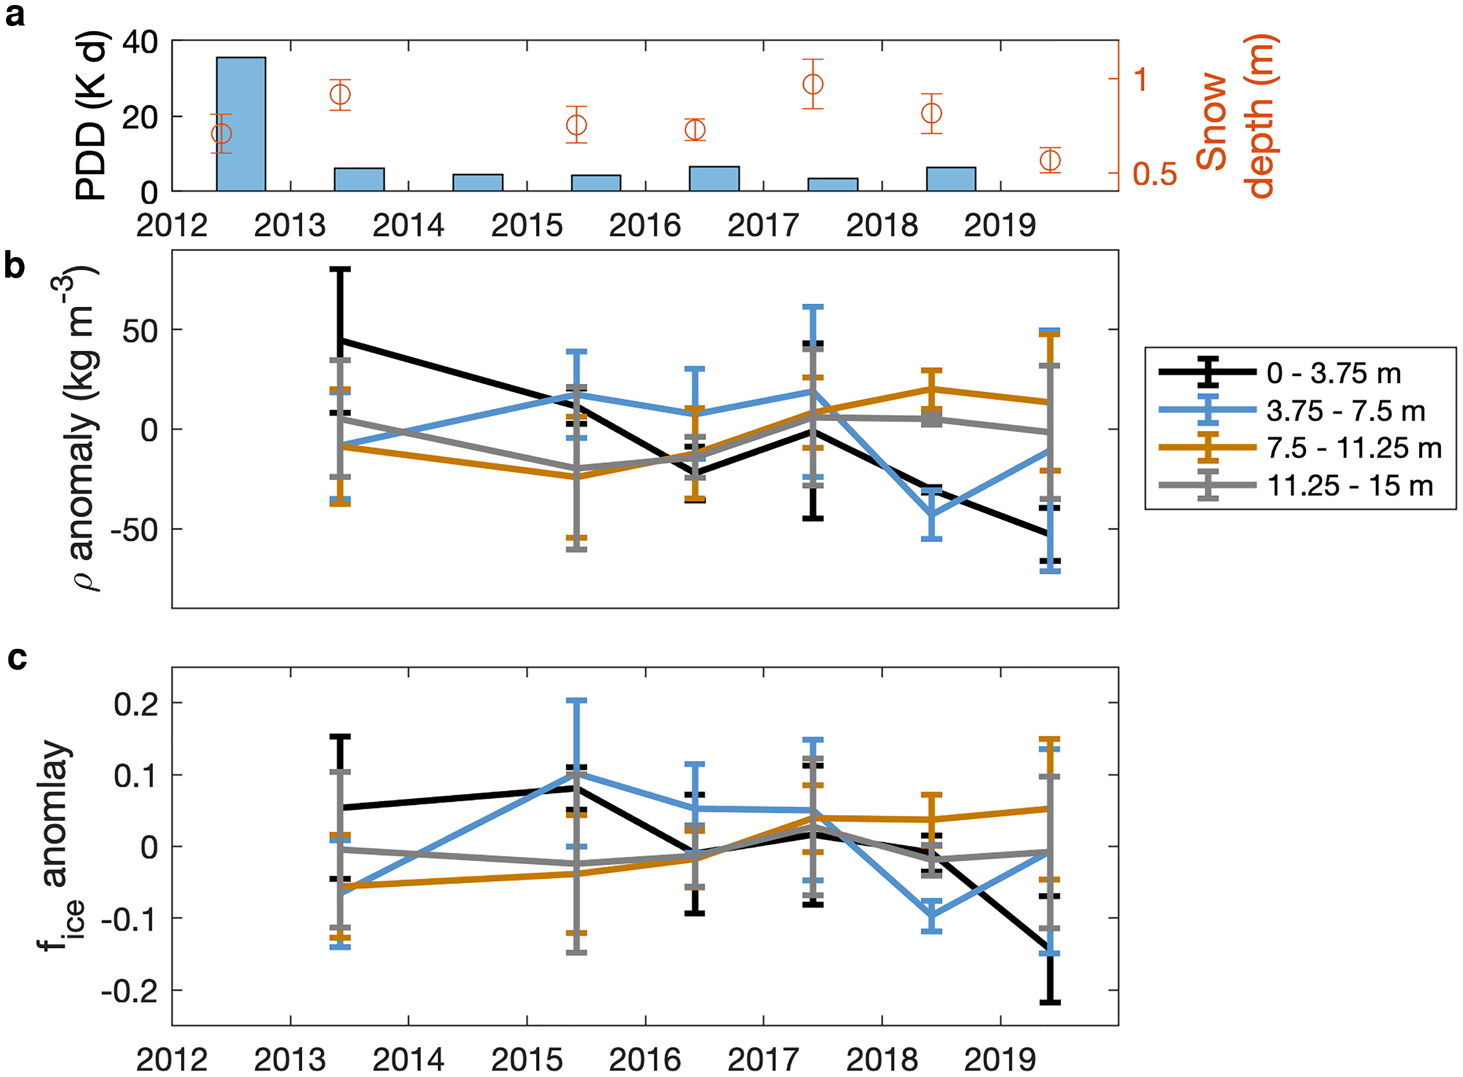
Fig. 8. (a) Positive degree-day sum (PDD) measured at Dye-2 in May–September (bars), and average snow depth (error bars show std dev.) in the study area measured in April/May, (b) density (ρ) and (c) ice layer fraction (f ice) anomalies (only using ice layers ≥0.01 m) detrended for elevation using linear fits for each of the four 3.75 m depth layers. The year labels refer to January 1 in each year. PDD sums data are from the 2 m Type E thermocouple from the Dye-2 GC-net station (Steffen and others, Reference Steffen, Box and Abdalati1996). Snow depths refer to averages of three to ten observations taken between the end of April and the end of May. Only cores extending to 15 m depth were used. Note that all cores presented in this paper were drilled during spring, and therefore are affected by summer melt of the previous year, i.e. they have 1 year ‘delay’ relative to summer melt.
Average elevation-detrended density in the near-surface layer (0–3.75 m) peaked in 2013. The 2013 near-surface density was influenced by the extreme melt year of 2012 when the PDD sum was 35.5 K d, and thus four std dev.s above the 1998–2019 average (8.3 ± 6.8 K d) (Fig. 8a). The May–September PDD sums (based on hourly data records) between 2013 and 2018 were much lower than those in 2012 and ranged between 3.5 and 6.5 K d. Snow depths measured in April/May in the same period were less variable than PDD sums and ranged from 0.6 to 1 m (Fig. 8a).
Elevation-detrended density decreased linearly with 15 kg m−3 a−1 (R 2 = 0.52, p < 0.01) from 2013 to 2019 in the near-surface layer (<3.75 m) (Fig. 8b). This general decline was interrupted by a small density increase in 2017, which followed the melting season with the highest PDD sum (6.5 K d) between 2013 and 2018. The third layer from the surface (7.5–11.25 m) increased with 4.4 kg m−3 a−1 with a small, but statistically significant linear relationship (R 2 = 0.13, p < 0.05). No statistically significant trends (p > 0.87) over time were observed in density in the two other layers. Similar to density, elevation-detrended ice layer fraction in the near-surface layer exhibited a statistically significant negative trend (p < 0.01) in the near-surface layer, a significant positive trend (p < 0.01) in the third layer (7.5–11.25 m) and no significant trends in the other two layers.
The sharp increase in ice layer fraction from 2013 to 2015 in the 3.75–7.5 m depth layer could be influenced by the presumed underreporting of ice layers in 2013 (Section 3.3), but also reflect the downward movement of the ice-rich layer created during the extreme 2012 melt season. The ice layer fraction anomaly at 3.75–7.5 m remains relatively constant until 2017, decreases in 2018 and increases again in 2019. In the third layer (7.5–11.25 m) ice layer fraction increases slightly each year from 2013 to 2017 and remains roughly constant in 2018 and 2019. Inverting the depth–age relationship from Section 3.1 (0.6 ± 0.6 m a−1, mean ± std dev.) indicates that the bottom of the firn layer deposited in 2012 was at 2.4 + 1.2 m in 2015 (estimated mean depth + std dev.) and 4.2 + 1.6 m in 2018. Thus, ice layers formed in 2012 could have reached depths below 3.75 m in 2014, and depths below 7.5 m in 2018 if melt percolated just below the 2012 layer. The ice layer fraction increase at 3.75–7.5 m increase in 2019 may reflect downward movement of ice layers formed in 2016 (second highest Dye-2 PDD sums 2012–18), which would be at 2.4 + 1.2 m in 2019.
4 Discussion
4.1 Spatial and temporal trends in firn density and ice layer fraction
We analyzed density and ice layer thickness of the upper 15 m of 46 firn cores drilled at 15 sites between 1989 and 2019. Nineteen of the 46 cores are presented for the first time. At two of the 15 sites, legacy cores revealed substantial increase in density (15–18%) and in the top 15 m from 1989 and 2017, and 1998 to 2019, respectively. However, after the extreme melt summer of 2012, a period of equal or less than average melt rates between 2013 and 2018 resulted in multiple cores from eight sites showing declining density (by 7–18% relative to 2013) in the top 3.75 m. This decline in the top 3.75 m was confirmed by analyzing the density for cores detrended for elevation's strong influence (−15 kg m−3 a−1 between 2013 and 2019).
Our findings of decreased firn density from 2013 to 2019, mirrored by ice layer fraction decreases, have not been documented yet in previous studies, since most previous studies only analyzed a small number of cores from this period, if any (e.g. Braithwaite and others, Reference Braithwaite, Laternser and Pfeffer1994; Harper and others, Reference Harper, Humphrey, Pfeffer, Brown and Fettweis2012; Machguth and others, Reference Machguth2016; Trusel and others, Reference Trusel2018; MacFerrin and others, Reference MacFerrin2019). However, our finding of denser and more ice-rich shallow firn (>15 m) from 1989 to 2017, and 1998 to 2019 is consistent with firn core studies in Greenland (Braithwaite and others, Reference Braithwaite, Laternser and Pfeffer1994; Harper and others, Reference Harper, Humphrey, Pfeffer, Brown and Fettweis2012; Machguth and others, Reference Machguth2016; Trusel and others, Reference Trusel2018; MacFerrin and others, Reference MacFerrin2019). Machguth and others (Reference Machguth2016) analyzed cores from sites within our study area and found that density increased and ice layers thickened substantially in five cores from 2013 relative to three nearby cores from 1997/98. Additionally, Machguth and others (Reference Machguth2016) sampled cores at site KAN_U (Fig. 1) before and after the high melt year in 2012 (2009, 2012 and 2013), to reveal density and ice layer thickness increases in the top ~3 m. At a transect located ~320 km north of our study area, Harper and others (Reference Harper, Humphrey, Pfeffer, Brown and Fettweis2012) found denser firn and ice layers thickening at lower elevations (from 0.01 m to multi-meter thick ice layers as the elevation dropped from 2000 to 1689 m a.s.l.). Similar to our study, Kameda and others (Reference Kameda, Narita, Shoji, Fujii and Watanabe1995) found increasing density and ice layer thickness over time by comparing the top and bottom sections of their firn cores at Site J. Although our study is limited to the upper 15 m of firn that extends back ~22 years (i.e. 1958 for Site J-89 core), Kameda and others (Reference Kameda, Narita, Shoji, Fujii and Watanabe1995) used deeper sections and documented an increase in ice layers thickness relative to 1945. Our cores revealed no evidence of the presence of firn aquifers, which is consistent with remote-sensing mapping largely confining firn aquifers to northwest and southeast Greenland (Brangers and others, Reference Brangers2020; Miller and others, Reference Miller2020).
When examining changing firn density and ice layer fraction at different depth intervals, we ignored the influence of lateral advection. Since the ice is continuously moving, the deeper ice will carry characteristics from higher elevations advected down over time. For example, Leone and others (Reference Leone, Harper, Meierbachtol and Humphrey2020) showed that within a single ice core at Crawford Point (69.9° N, 47.0° W), upstream slope changes 5 km away from the core site are manifested as sharp decreases in the core's ice layer features at 50 m depth. However, the influence of advection on firn density and ice layer is most pronounced at low elevations of the percolation zone, with significant variability in slope and ice velocity (Leone and others, Reference Leone, Harper, Meierbachtol and Humphrey2020). In SW Greenland, the influence of advection is most marked ~1700 m a.s.l. (Leone and others, Reference Leone, Harper, Meierbachtol and Humphrey2020), which is below our study area (1850–2360 m a.s.l.).
Additionally, local topography variations at the kilometer scale and small-scale heterogeneity in the percolation process can cause substantial variability in ice layer properties (Marchenko and others, Reference Marchenko2017). In our study area, small-scale variability manifests as different density and ice layer distributions in cores collected in close proximity in the same year (Supplementary Fig. S2). However, this small-scale variability is much smaller than changes over space and time. Thus, we find statistically significant relationships with firn density and ice layer thickness with increasing elevation (Section 3.4) and time (Section 3.5).
The changes in density and ice layer fraction for the lowest elevation site, KAN_U, differed from the other sites by not exhibiting a decreasing trend following 2012. Instead, a thick (>0.5 m) ice layer is observed near the surface (the top of the layer <2.6 m) starting in 2012. In each following year, the net mass balance, primarily governed by summer melt and winter snow accumulation, maintains the thick ice layer near the surface and suppress development of porous firn. Near-surface ice layer buildup over multiple years at KAN_U was already documented by Machguth and others (Reference Machguth2016) and MacFerrin and others (Reference MacFerrin2019). Consistent with MacFerrin and others (Reference MacFerrin2019) we assume that some of the ice formed at the top of the thick ice layers is superimposed ice (i.e. ice formed at the summer surface in a melt year), particularly the KAN_U cores collected in 2013 and 2017 reveal an extremely thin firn layer below the winter snow (<0.2 m, Fig. 6a and Supplementary Fig. S2). Here, we show that this process of maintaining thick near-surface ice layers has continued despite decreases in density and ice layer thickness at higher elevations.
Previous research shows that meltwater infiltration can reach far below the winter snowpack, as deep as 10 m, before it refreezes (Humphrey and others, Reference Humphrey, Harper and Pfeffer2012; Charalampidis and others, Reference Charalampidis2016). At one of our study sites (Dye-2), another study used an upward-looking radar to observe that 40% of meltwater went below the annual snow depth in 2016 (Heilig and others, Reference Heilig, Eisen, MacFerrin, Tedesco and Fettweis2018). Thus, the increase in density and ice layer fraction observed from 2013 to 2015 in the 3.75–7.5 m depth layer, and from 2016 to 2018 in the 7.5–11.25 m layer may be 2012 surface meltwater refrozen at the lower limit or below the 2012 firn layer. Additionally, meltwater percolation depends on firn permeability, which is smaller in areas with wet firn compared to areas with dry firn (Sommers and others, Reference Sommers2017). Thus, once a thick ice layer was established at our lowest elevation site, lowered permeability might have favored refreezing above existing ice layers, and thereby facilitating the formation of thick ice layers over multiple years. We hypothesize that firn below the thick, low-permeability, ice layers will be largely cut-off from meltwater refreezing and only experience compaction over time. However, short time series and lack of data below the thick ice layers prevent us from testing this hypothesis.
4.2 Implications for a changing Greenland ice sheet
Our observations of increased density and ice layer fraction from 1989 - 2017 and 1998 - 2019, respectively, and decreases from 2013 to 2019, are consistent with Dye-2 PDD sum anomalies (Fig. 9). Between 1998 and 2012, five out of 16 years were one std dev. or more above the median PDD sum. However, following 2012, PDD sums remained at or below their median until the 2019 summer. These PDD sums trends closely follow the general, large scale Greenland melt trends (van den Broeke and others, Reference van den Broeke2016). A string of high melt years took place between 2007 and 2012 (van den Broeke and others, Reference van den Broeke2016), followed by less melt in subsequent years. In 2019, the second largest melt summer in the 1979–2019 period was observed (with the highest melt in 2012) (Tedesco and Fettweis, Reference Tedesco and Fettweis2020). Since the most recent core in this study was drilled in spring 2019, we have no in situ evidence of how the substantial melt event in summer of 2019 affected Greenland firn. In addition to surface melting, snow accumulation, rainfall and sublimation may influence firn density. For the Greenland ice sheet as a whole, rainfall and sublimation are comparatively small, and snow accumulation exhibits no significant trend 1958–2015 or 1995–2015 (van den Broeke and others, Reference van den Broeke2016). At our sites, annual snow depth varies between 0.6 and 1 m (2009–19) with 2019 being the year with the shallowest snow layer (Fig. 9). If 2019 snow depth had been at the 2012–18 average at our sites, density reductions in the top 3.75 m would have been even larger.

Fig. 9. Average snow depth measured at study sites (error bars show std dev.), and positive degree-day sum (PDD) anomaly May–September using 2 m hourly air temperature measured at Dye-2. The data are the same as shown in Figure 8, but using the Dye-2 temperature starting in 1998, and average snow depth and std dev. in 2009 was calculated using two observations collected on July 1 that year. The Dye-2 record starts in 1996, but the first 2 years are excluded due to data gaps in those years. For the years 2001 and 2009, the GC-net data were replaced with gap filled data from Vandecrux and others (Reference Vandecrux2020) accessed from the Arctic Data Center (Vandecrux, Reference Vandecrux2020).
Our study shows that a thick layer remains close to the ice-sheet surface in the lowest part of the percolation zone in SW Greenland (i.e. at the KAN_U site). Thus, it is possible that a single large melt year could once again trigger surface runoff in the lower percolation zone. Thick, near-surface ice layers capable of preventing meltwater infiltration and promoting runoff (i.e. a form of infiltration excess runoff) was observed at the KAN_U site in the summer of 2012 (Machguth and others, Reference Machguth2016; MacFerrin and others, Reference MacFerrin2019). Additionally, runoff can occur at the base of isothermal, ice-free, firn (e.g. Colbeck, Reference Colbeck1972), but is unlikely at KAN_U where thick ice layer exists and the firn is not isothermal although observations at this site have shown that some meltwater may reach deeper firn layers through slow and inefficient transfer processes due to inhomogenous firn stratigraphy (e.g. Charalampidis and others, Reference Charalampidis2016). Surface runoff can also be generated when snow is saturated from below regardless of the presence of thick ice layers (Meyer and Hewitt, Reference Meyer and Hewitt2017), but this process will be most effective in ice-rich low-permeability firn. It remains unresolved how widespread and regularly occurring runoff over firn with thick ice layers is on the Greenland ice sheet. In 2012 in Southwest Greenland, unprecedented runoff increased the total ice-sheet runoff by 11 ± 4% (Machguth and others, Reference Machguth2016).
MacFerrin and others (Reference MacFerrin2019) predict that thick low-permeability ice layers can form in higher elevations in future with enhanced ice-sheet melt. If such existing thick ice layers do indeed block percolation and inhibit refreezing, it has increased the ice-sheet's runoff area by 26 ± 3% since 2001 and may contribute 7–74 mm to the global sea level by 2100 depending on the scenario (MacFerrin and others, Reference MacFerrin2019). Between 1998 and 2017 in the western Greenland's percolation zone, near-surface firn density increased resulting in reduced firn air content or firn capacity, i.e. the maximum amount of meltwater that can be retained in liquid or frozen form in the firn pore space (Harper and others, Reference Harper, Humphrey, Pfeffer, Brown and Fettweis2012; Vandecrux and other, Reference Vandecrux2019). In contrast, our observed near-surface density decrease indicates increased firn air content and resulting meltwater infiltration capacity since 2013. Expansion of ice slabs and reduction in meltwater infiltration capacity is likely to continue given projected increase in mass loss until the 2100s (Briner and others, Reference Briner2020). However, this study shows that a series of years with average and below average melt can slow the expansion of ice slabs and, at least temporarily, increase firn meltwater infiltration capacity.
5 Conclusions
Nineteen new firn cores and 27 previously published cores from SW Greenland drilled between 1989 and 2019 reveal that increases in near-surface firn density and ice layer fraction from 1989 and 1998 to the 2010s were interrupted in 2013–19. Instead, density and ice layer fraction in the top 3.75 m of firn decreased in concert with 6 years of average or below average melt, following the extreme melt year of 2012.
The time evolution of the firn pack at the lowest elevation site differs from the evolution of our other sites. Here, density and ice layer fraction are approximately constant in the upper 3.75 m following the 2012 extreme melt. A thick (>0.5 m) ice layer remains sufficiently close to the surface (<2.6 m) to be maintained by meltwater infiltration and refreezing by a succession of 6 years with below or at median melt.
Although the long-term trend and future projections show a strong increase in Greenland ice-sheet melt, this study shows the impact of a series of average/below average melt years. This temporary hiatus in degradation of meltwater retention capacity could temporarily increase the ice-sheets’ capacity to buffer against ice-sheet fresh water export and sea level rise.
Supplementary material
The supplementary material for this article can be found at https://doi.org/10.1017/jog.2021.102.
Data
The data from the new cores drilled in 2017–19 are archived at the Arctic Data Center (Rennermalm and others 2021a; Rennermalm and others 2021b at https://arcticdata.io/).
Acknowledgements
Funding for this project was provided by the US National Science Foundations (NSF) (Grants OPP-1604058, 1603815 and 1603331). SL was funded by NSF GRFP. JK was funded by NSF OPP-1743310. HM acknowledges funding under the European Research Council award 818994 – CASSANDRA. MM acknowledges funding from NASA awards NNX10AR76G and NNX15AC62G for this study. The authors are grateful for the generous logistic support from Polar Field Services, UNAVCO, and they thank the U.S. Ice Drilling Program for support activities through NSF Cooperative Agreement 1836328. Steven Munsell, Kierin Rogers, Iva Radivojevic and Patrick Smith assisted with the fieldwork. Maps and geographical information science analyses were made with open source QGIS software. The MARv3.11 outputs were provided by Xavier Fettweis. Geospatial support for this study was provided by the Polar Geospatial Center under NSF-OPP awards 1043681, 1559691 and 1542736.
Author contributions
AR performed the calculations, and developed the analyses and scope of the paper with significant input from RH and FC. GC and JX synthesized and corrected the core data and performed initial analyses with input from RH, FC and AR. AR, FC, RH, SL, JK, JX and CM conducted the fieldwork and collected the data in 2017–19. TK provided the Site J-89 data and JM the Dye-2-11 data. EO provided the Core-7-16 data and dated Core-8-18. AR wrote the paper with substantial contributions from RH and FC. All authors commented on the manuscript, and improved the writing.


 Open access