


1. Introduction
Modern warming has created unsustainable conditions for high mountain glaciers, causing increased melt and degradation of ice core climate archives, only projected to worsen over the next century. Central Andes (10°S and 35°S) high altitude glaciers including Nevado Illimani and the Quelccaya ice cap are influenced by maritime air masses from the tropical Atlantic Ocean modified by transit across the Amazon Basin. These include intermittent polar air mass incursions, interannual El Nino Southern Oscillation (ENSO) fluctuations, tropical and extratropical Hadley Cell circulations, and the South American Low-level Jet (SALLJ), and South Atlantic/Pacific Anticyclones (Garreaud, Reference Garreaud2009). The glaciers reflect steep precipitation and vertical temperature gradients and are, therefore, sensitive to climate variations.
Ice cores from the Quelccaya ice cap (5670 m), located in the Cordillera Vilcanota of Peru, are the longest annually resolvable ice core records in the tropics. They cover at least 1–2 millennia and are commonly used to analyze tropical paleoclimatic proxies (e.g. Thompson and others, Reference Thompson, Mosley-Thompson, Bolzan and Koci1985, Reference Thompson, Mosley-Thompson, Dansgaard and Grootes1986, Reference Thompson2006, Reference Thompson2013). Illimani Glacier (6438 m), located on the eastern margin of the Bolivian Altiplano, ~450 km SE from Quelccaya, also exhibits well-preserved environmental signals within ice strata for the mid to late Holocene period (e.g. Correia and others, Reference Correia2003; Hoffmann and others, Reference Hoffmann2003; Knüsel and others, Reference Knüsel2003, Reference Knüsel, Brütsch, Henderson, Palmer and Schwikowski2005; Kellerhals and others, Reference Kellerhals2010; Eichler and others, Reference Eichler, Gramlich, Kellerhals, Tobler and Schwikowski2015, Reference Eichler2017; Osmont and others, Reference Osmont, Sigl, Eichler, Jenk and Schwikowski2019; Lindau and others, Reference Lindau2021).
The Quelccaya ice cap areal extent has been retreating at a rate of 0.6 ± 0.1 km2 a−1 from 1980 to 2010 (Hanshaw and Bookhagen, Reference Hanshaw and Bookhagen2014), and based on CMIP5 climate model simulations, is projected to completely disappear by 2050 (Yarleque and others, Reference Yarleque2018). Feedback mechanisms caused by enhanced warming will further instigate the loss of Quelccaya's accumulation zone (Rabatel and others, Reference Rabatel2013; Yarleque and others, Reference Yarleque2018; Potocki and others, Reference Potocki2022b). Recently recovered ice cores from Quelccaya have exhibited loss of seasonal variations in stable isotopes due to melting and percolation through the firn; however, particle-based records still demonstrate preserved seasonality (Thompson and others, Reference Thompson, Mosley-Thompson, Davis and Porter2017). Only one ice core-trace element record from the Quelccaya ice cap has been retrieved, and it covers the period 793–1989 CE at a resolution of 2–8 cm for 1383–1989 CE (Uglietti and others, Reference Uglietti, Gabrielli, Cooke, Vallelonga and Thompson2015). Recent studies have shown that while surface melt can affect the upper portion of the record, beneath the firn-ice transition where ice is still below freezing, affords well-preserved records (Campbell and others, Reference Campbell2012; Neff and others, Reference Neff2012; Moser and others, Reference Moser2021).
Andean ice cores exhibit strong seasonal variations of isotopic and chemical compositions that reflect the alternation of wet and dry seasons, allowing for annual layer detection. Previous studies have demonstrated that the concurrence of isotope records in the Andes is important for strengthening interpretations of ice core records on long-term multi-decadal to inter-decadal scales and the potential to link the past climate of the moist eastern and arid western cordilleras (Hoffmann and others, Reference Hoffmann2003; Perry and others, Reference Perry, Seimon and Kelly2014; Guy and others, Reference Guy2019). In the high Andes the wet season is dominated by depleted δ 18O (due to wetter conditions, long-distance transport over land or water vapor cycling) associated with transport over the Amazon basin with high crustal enrichment factor (EFc) values (due to low aerosol content), and low elemental concentrations. The dry season is dominated by dry deposition of dust, enriched δ 18O values, low crustal EFc and high elemental concentrations (Correia and others, Reference Correia2003; Knüsel and others, Reference Knüsel, Brütsch, Henderson, Palmer and Schwikowski2005; Osmont and others, Reference Osmont, Sigl, Eichler, Jenk and Schwikowski2019). Air masses from the Amazon basin can also be traced using biomass emission tracers such as NH4+, K+, P and K, while the Pacific moisture sources can be associated with methanesulfonate (MSA) and Cl− (Ginot and others, Reference Ginot2002; Kellerhals and others, Reference Kellerhals2010).
Andean ice cores also provide evidence of the human impact on regional atmospheric chemistry. Black carbon from biomass burning in the Amazon basin is more likely to be deposited on Central Andean glaciers in winter (higher concentration), while anthropogenically sourced metals (e.g. Cu, As and Cd) have elevated deposition during the austral summer months (Correia and others, Reference Correia2003; Osmont and others, Reference Osmont, Sigl, Eichler, Jenk and Schwikowski2019). Central Andes ice cores may therefore be ideal indicators of long-term pollution including Pb and Cu from a 2000-year-old Illimani ice core (Eichler and others, Reference Eichler, Gramlich, Kellerhals, Tobler and Schwikowski2015, Reference Eichler2017) and enriched As, Bi, Mo, Pb and Sb going back 800 years in a Quelccaya ice core (Uglietti and others, Reference Uglietti, Gabrielli, Cooke, Vallelonga and Thompson2015). In the past, the standard methodology for dating ice cores using δ 18O (Seimon, Reference Seimon2003), incomplete knowledge of precipitation processes (Perry and others, Reference Perry, Seimon and Kelly2014) and uncertainties regarding the climatological interpretations of stable oxygen isotope ratio in Andean ice cores (Vimeux and others, Reference Vimeux2009) have sparked strong debate related to paleoclimatic interpretations.
The motivation of this study is to preface the value and viability of future surface-to-bedrock cores by expanding upon previous studies with comparisons of trace element records from a melt-impacted (Quelccaya) and a non-melt-impacted (Illimani) firn core, in addition to reviewing Central Andean environmental proxies and introducing exploratory ultra-high-resolution annual layer detection. To address some of the preceding debates, we present chemical analysis from two Central Andean shallow firn core records and a near-basal ice core to (1) develop a timescale based on multi-parameter glaciochemical annual layer detection; (2) define annual layer thickness (ALT) using ultra-high-resolution glaciochemical sampling; (3) assess sources of chemical impurities and proxies for atmospheric circulation and compare them with existing glaciochemical records collected in the Central Andes; and (4) preface future directions for high- and ultra-high-resolution ice core records collected to bedrock.
While drilling high Andean ice cores is not without complications, previous studies demonstrate paleoclimate archives can still be preserved when the melt is present, and completely ignoring these sites considering their demonstrated environmental proxy value means the loss of irreplaceable archives. To preface future surface-to-bedrock Central Andean ice core records, we first initiate the discussion of how to reassess the characteristics of ‘melt-impacted’ ice core glaciochemical records and their potential value, which is largely understudied. Second, we define informative environmental proxies that are evident in the new glaciochemical records from this study and from previous studies to discover knowledge gaps that could be informed by a surface-to-bedrock ice core record. Lastly, we investigate the potential for identifying previously undetectable annual layers in the basal layers (compressed portion at the bottom) of the glacier, which could aid in creating a more accurate ice core chronology.
2. Methods
2.1. Study site characteristics
For this study, firn/ice cores were drilled from two different high mountain glaciated locations in the Central Andes. The first is from the Quelccaya Ice Cap located in the Cordillera Vilcanota of Peru. Quelccaya ice cap has a mean annual net accumulation of 1.2 m w.e. near the summit (Thompson and others, Reference Thompson, Mosley-Thompson, Grootes, Pourchet and Hastenrath1984, Reference Thompson, Mosley-Thompson, Bolzan and Koci1985, Reference Thompson2006) with a mean annual air temperature of −4.0°C measured for the period 2005–2016 (Yarleque and others, Reference Yarleque2018). The second location is Nevado Illimani glacier located on the eastern margin of the Bolivian Altiplano, ~450 km SE from Quelccaya. At the Nevado Illimani glacier, the mean annual net accumulation is 0.6 m w.e., with a mean annual air temperature of −8.0°C (Hoffmann and others, Reference Hoffmann2003; Knüsel and others, Reference Knüsel2003; Ramirez and others, Reference Ramirez2003).
Annual fluctuations of the South American Summer Monsoon control the moisture transported to the Central Andes region with the wet season from November to March. The wet season is dominated by moisture-rich Amazon air masses coming from north-northwest back trajectories, with some trajectories coming directly from the east (Perry and others, Reference Perry, Seimon and Kelly2014). These humid and unstable air masses are influenced by the easterlies, originating over the Atlantic Ocean, that undergo recycling through precipitation/evapotranspiration before reaching the Andes. In contrast, westerly winds prevail during the dry season from April to October, blocking most moisture transport coming from the east. Moisture transport is also impacted by the interannual variability of the ENSO. Varying frequency and magnitude of warmer El Niño (cooler La Niña) events are reflected by elevated (decreased) aerosol deposition as detected in ice cores, likely influenced by the drought-like (wetter) conditions in the Central Andes and reduced (increased) net accumulation (Thompson, Reference Thompson1993).
2.2 Shallow firn/ice core drilling procedures
In 2018, we drilled a 23 m ice core from the summit (QU-18, −13.933333S, −70.833333W; 5470 m a.s.l.) and a 7 m near basal ice core from the edge of the Quelccaya ice cap (QNB-18, −13.939975S, −70.856443W, ~5245 m a.s.l., ~3 km from QU-18) (Fig. 1). To determine the optimal drilling site, we used a ground-penetrating radar (GPR) profile over the summit of the ice cap. The GPR profile collected over the summit determined the location of drilling by revealing optimal depth and layering between surface to bedrock that did not show any potential obstructions for the drilling procedure. The GPR profile information, supplied from INAIGEM in Cusco, Peru, is a total of 13.4 km in length. The maximum GPR-derived ice thickness is ~ 220 m (−13.919535S, −70.811485W). The ice core was recovered using a 7.62 cm diameter StampfliTM aluminum electromechanical drill, operated in the field by Mike Waszkiewicz with the support of researchers from the Climate Change Institute (CCI) at the University of Maine and Universidad Federal do Rio Grande do Sul.
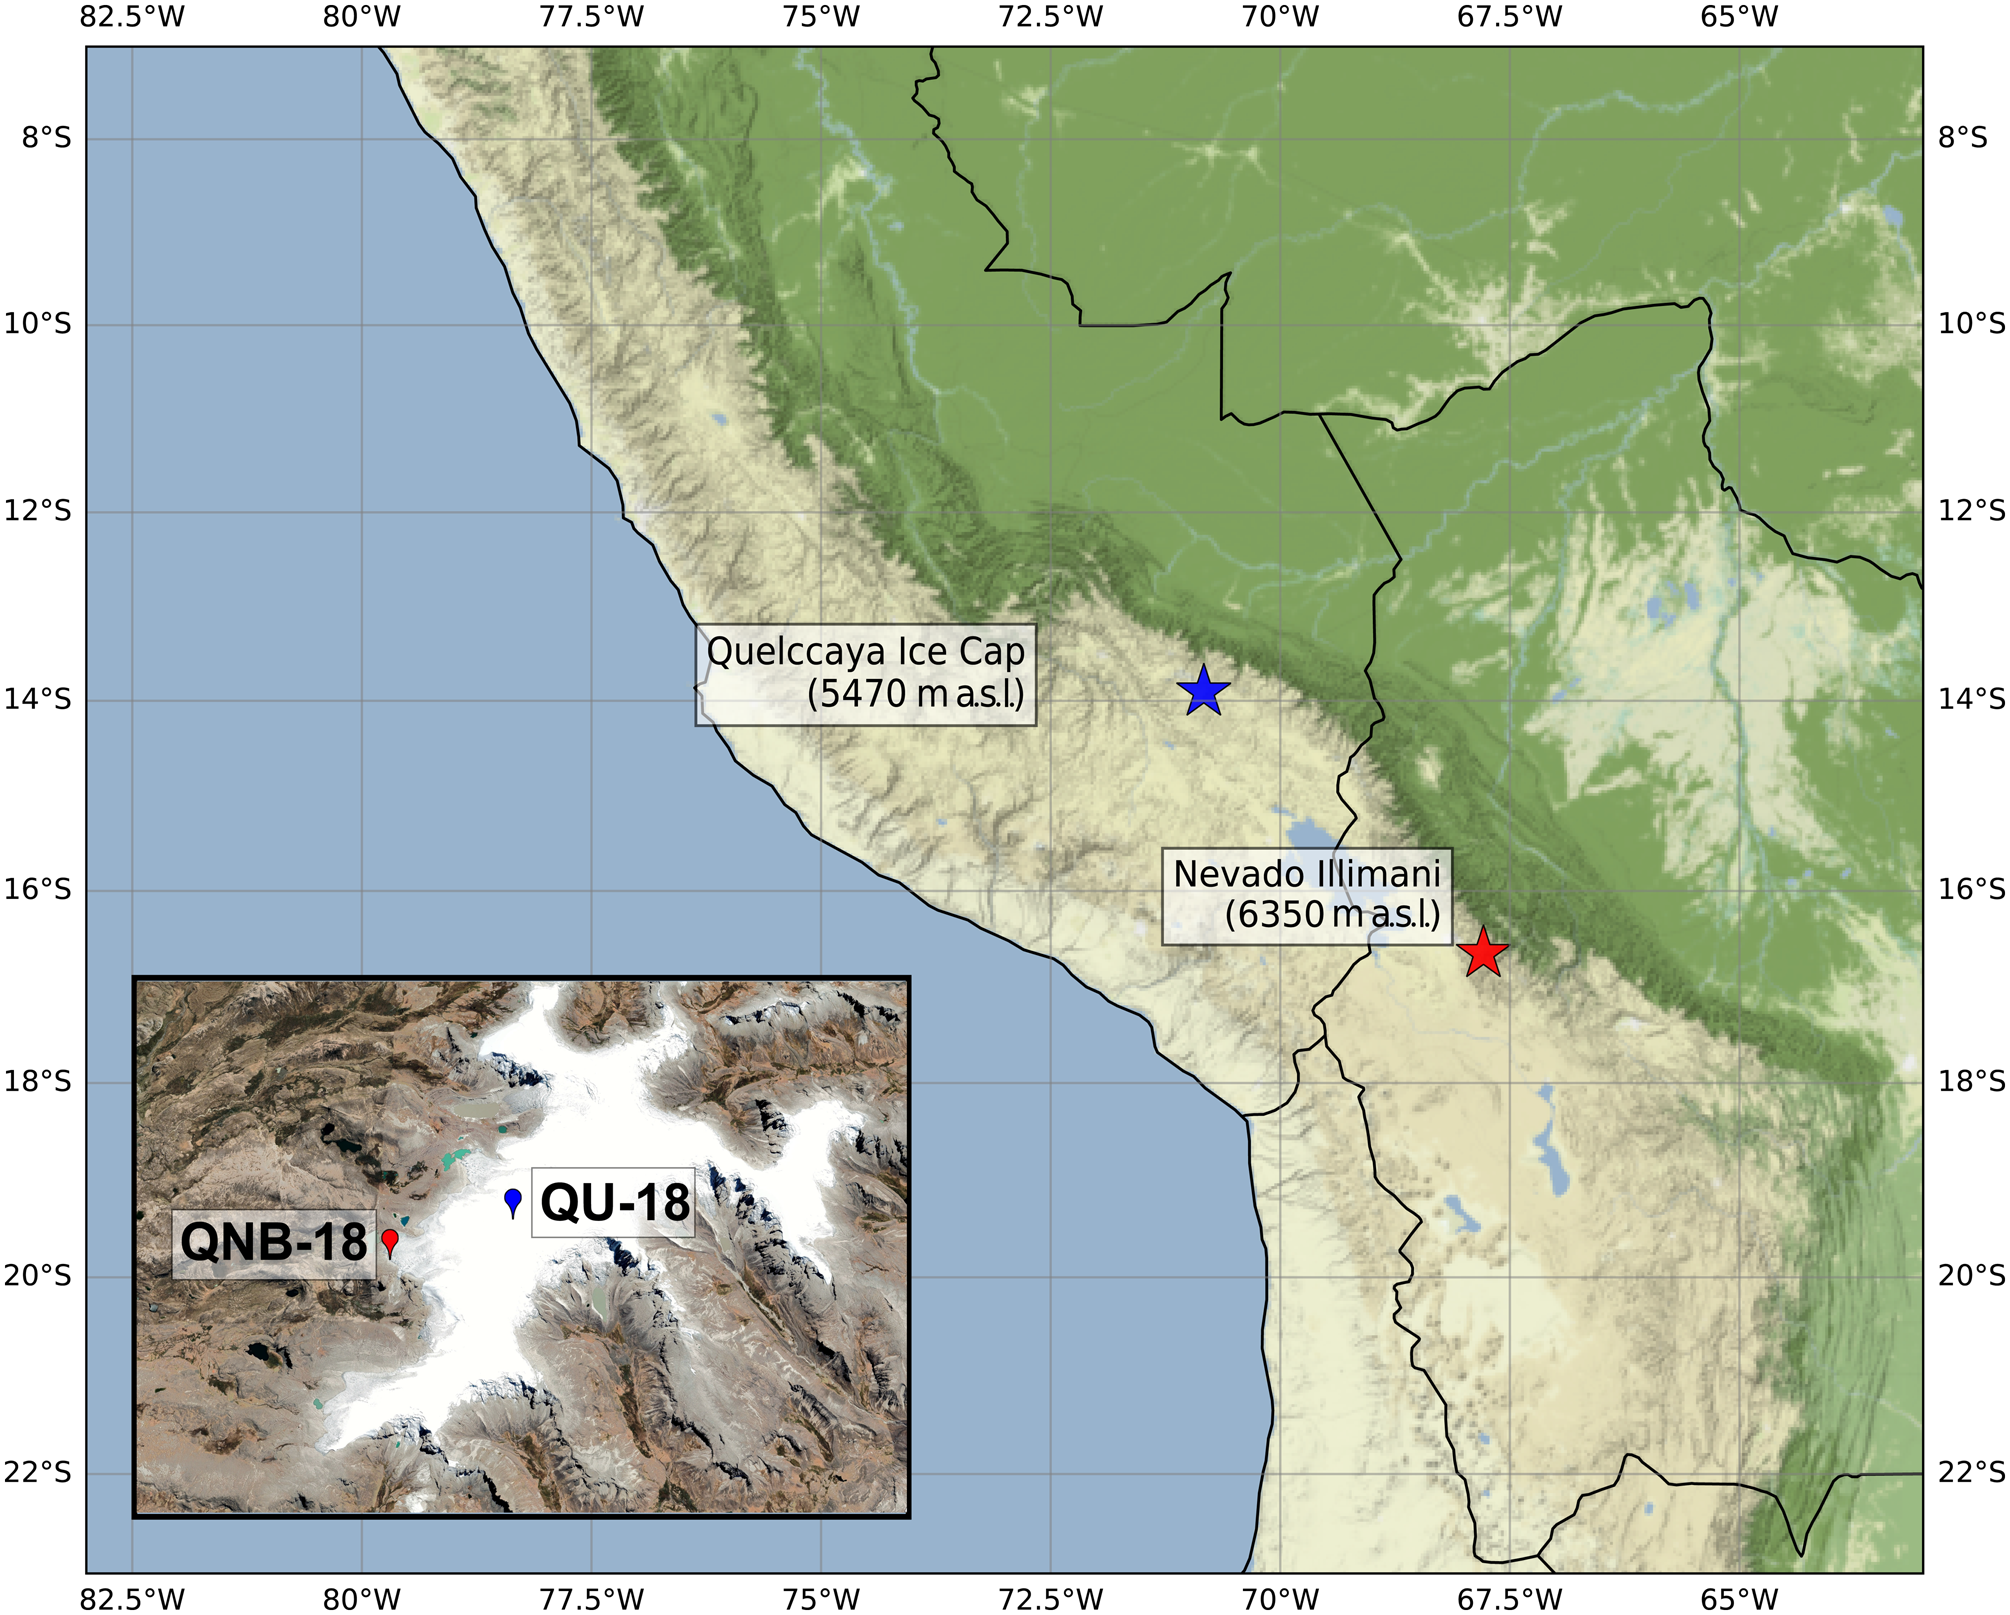
Fig. 1. Map of Central Andean ice core drill locations including the shallow core from the Quelccaya Ice Cap summit (QU-18, −13.933333S, −70.833333W; 5470 m), the shallow core drilled from Nevado Illimani glacier in Bolivia (IL-17, −16.6528433S, −67.7874809W; 6350 m) in 2017, and a 7 m near basal ice core from the edge of the Quelccaya ice cap (QNB-18, −13.939975S, −70.856443W, ~5245 m), ~3 km from QU-18.
The near basal ice core (~7 m), identified as QNB-18 in this study, was collected from the surface of the terminus portion of the glacier, at a site where ice layering is visible (Fig. S1) using a 7.62 cm Kovacs Mark III drill. The ice was collected from the edge of the Quelccaya ice cap, shown in Figure 1. This ice is being described as a ‘near basal’ ice core due to the location of collection near the terminus of the glacier and the visible compressed layering. Both Quelccaya cores were transported from the drill site to a freezer truck via horseback, then shipped to the University of Maine and placed in a −26°C freezer for storage.
The IL-17 ice core (~23 m) was drilled from Nevado Illimani glacier in Bolivia (−16.6528433S, −67.7874809W; 6350 m a.s.l.) in 2017 by a team from the Ice Memory project and supported by French and Bolivian institutions. The field campaign and drilling procedure for this ice core are detailed in Lindau and others (Reference Lindau2021). Surface-to-bedrock ice cores at Nevado Illimani reach a depth of 137–139 m (Hoffmann and others, Reference Hoffmann2003; Knüsel and others, Reference Knüsel2003; Ramirez and others, Reference Ramirez2003).
2.3 Ice core chemical analyses
During the drilling process of the QU-18 ice core, we cut ~5 cm sections in-depth and ~1 cm wide from the core while in the field to melt for stable water isotope (SWI) measurements (δ 18O, δD), reported as per mil relative to Standard Mean Ocean Water (SMOW) analyzed as vapor on a Picarro L-2130-I Isotopic H2O Laser Ring Down Spectrometer with a high throughput vaporizer (Introne, Reference Introne2021). The rest of the core was melted in the lab at the University of Maine's Climate Change Institute using the CFA (continuous flow analysis) system (Osterberg and others, Reference Osterberg, Handley, Sneed, Mayewski and Kreutz2006) and siphoned into two volumes: 5 mL per sample to a Dionex™ AS-DV autosampler as polyvials with filter caps for ion chromatography, and the remaining volume (~5 mL) was acidified to 1% with Optima double-distilled HNO3 and left to digest for 60 days prior to ICP-MS analysis. We measured 29 major and trace elements (Ag, Al, As, Ba, Bi, Ca, Cd, Ce, Co, Cr, Cs, Cu, Fe, K, La, Li, Mg, Mn, Na, Pb, Pr, S, Sc, Si, Sr, Ti, U, V, Zn) using a Thermo Electron Element 2 Inductively Coupled Plasma Sector Field Mass Spectrometry (ICP-MS) coupled to a Cetac Model ASX-260 autosampler. Seven major ions (Ca2+, Na+, Mg2+, K+, NO3−, SO42−, Cl−) were analyzed using a Thermo Scientific™ Dionex™ Ion Chromatograph ICS-6000 analytical system fitted with suppressed conductivity detectors and a Dionex AS-HV autosampler. The CFA analyses results equal to ~1–4 cm resolution. A summary of blank measurements and detection limits for ICP-MS and IC data of the ice samples is presented in Table S1.
Analysis of blank measurements and detection limits signifies that there is negligible sample contamination for the ice core ICP-MS and IC measurements used in this study during collection, transport and chemical analyses. Post-processing of the QU-18 ice core data includes removing data from the bottom 2 m, where the chemical signal in ICP-MS appears to be washed out due to the presence of a water table at that depth around the 23 m depth. We also removed the first 20 cm at the top of the core to avoid any surface contamination. The same analysis and melting procedures were performed for the 2017 IL-17 core and we removed the top 15 cm to minimize the potential of contamination in the record from surface contamination.
An ultra-high-resolution (120 μm per sample) continuously sampled LA-ICP-MS record was produced for a total of 1 m of the QNB-18 ice in the Climate Change Institute's WM Keck Laser Ice Facility. The shallower (younger) 47 cm section is taken from ~5 m (~5.0–5.47 m) below the top of the core (QNB6) and the deeper (older) 32 cm section is from ~6 m (~6.0–6.32 m) below the top of the core (QNB7). Annual layer detection using the LA-ICP-MS has been implemented in previous research from the same lab; however, these studies used a visual approach to detect annual layers (Mayewski and others, Reference Mayewski, Sneed, Birkel, Kurbatov and Maasch2014; Haines and others, Reference Haines2016; Bohleber and others, Reference Bohleber2018; Clifford and others, Reference Clifford2019). Sample preparation details and calibration protocols are found in Sneed and others (Reference Sneed2015) and for multielement analysis in Spaulding and others (Reference Spaulding2017). For the LA-ICP-MS analysis reported in this study, we applied the multi-element method to produce a precise investigation of the relative phasing of elements at submillimeter scales (Spaulding and others, Reference Spaulding2017). We applied this new multi-element method on two ~0.5 m sections of the QNB-18 ice to create a continuous record for the following elements: 56Fe, 27Al, 25Mg and 23Na. The records collected from the LA-ICP-MS methodology are measured in total counts per second (cps) or the intensity for each pass. Concentrations are not measured by this methodology; however, previous studies have shown similar signals and statistically significant positive correlations to concentrations collected from the same ice core using traditional methods for glaciochemistry including ICP-MS and CFA (Sneed and others, Reference Sneed2015; Clifford and others, Reference Clifford2019).
Additionally, aerosol-based micro-radiocarbon dating of the QNB-18 sections was conducted using a cut section from the two bottom sections of the core, ~5 m (QNB6) and ~6 m depth (QNB7) from the top, following the procedure described in Uglietti and others (Reference Uglietti2016). QNB6 had an ice mass of 639 g after decontamination with a particulate organic carbon (POC) content of 18 μg kg−1 and QNB7 (355 g) had a POC of 103 μg kg−1. The sample processing was done at the Paul Scherrer Institute and radiocarbon analysis at the Laboratory for the Analysis of Radiocarbon with AMS of the University of Bern, Switzerland.
2.4 Statistical analysis
To investigate potential associations between the glaciochemical records retrieved from QU-18, IL-17 and QNB-18, we use empirical orthogonal function analysis (EOF). An EOF is used to decompose multi-dimensional glaciochemical records by detecting associated patterns, and is applied in many ice core studies to associate sources and transport mechanisms (Mayewski and others, Reference Mayewski1993; Kang and others, Reference Kang2002; Shrestha and others, Reference Shrestha, Wake, Dibb and Whitlow2002; Hoffmann and others, Reference Hoffmann2003; Vuille and others, Reference Vuille2003). We applied the EOF analysis to the smoothed (Gaussian, 2σ) trace element datasets for QU-18 and IL-17, and the original trace element dataset for QNB-18.
To identify sources other than rock and soil dust, we calculate the crustal EFc by taking the ratio of a selected metal to Al normalized to the mean upper continental crust ratio of the selected metal to Al (Wedepohl, Reference Wedepohl1986; Ferrari and others, Reference Ferrari2000). EFc calculations have been used previously in numerous snow and ice core studies as an indicator of anthropogenic and additional contributions to trace element loading (e.g. Correia and others, Reference Correia2003; Hong and others, Reference Hong2004; Uglietti and others, Reference Uglietti, Gabrielli, Cooke, Vallelonga and Thompson2015). We interpret an EFc larger than 10 as anthropogenic or volcanic source, referred to in this study as ‘enriched’ while an EFc below 10 indicates crustal sources are dominant (Ferrari and others, Reference Ferrari2000; Halstead and others, Reference Halstead, Cunninghame and Hunter2000; Barbante and others, Reference Barbante2003).
To separate signal from noise for portions of this study, we utilized a smoothing technique using the Gaussian filter function (scipy.ndimage.gaussian_filter) from the SciPy (v1.3.1) library in python (v3.7) which employs a sigma value that reflects the std dev. for a Gaussian kernel. We additionally applied a peak detection method (scipy.signal.find_peaks) from the SciPy (v1.3.1) library in python (v3.7) for LA-ICP-MS ALT detection that required user input based on visually distinguishing appropriate spacing between years.
2.5 Back trajectories
We use the NOAA Hybrid Single-Particle Lagrangian Integrated Trajectory Model (HYSPLIT) to identify the geographic origin of air masses relevant to the Quelccaya ice cap in 2013, shown in Figures S2–6. The year 2013 was chosen since it is a neutral year that does not have a strong El Nino or La Nina present and is depicted in both of the cores. The HYSPLIT model utilizes a hybrid approach that combines both Lagrangian and Eulerian frameworks in order to return georeferenced air mass concentrations and particle trajectories for periods of interest. Once back trajectories are initiated, tracks with similar geographic pathways can be grouped together by a method known as clustering. This method groups trajectories together so that differences between clusters are maximized and differences within a cluster are minimized (Stein and others, Reference Stein2015).
For the purposes of this study, HYSPLIT was driven with the National Center for Environmental Prediction (NCEP) Global Data Assimilation System (GDAS) reanalysis product which has a spatial resolution of 1° × 1° and a temporal resolution of 6 h. To properly assess source regions in 2013, the model was run for the period between 1 December 2012 and 31 January 2014, where the months on either side of the year are needed to provide context for the very first and very last back trajectories. Model runs were initiated every 6 h (0, 6, 12, 18 UTC) from the center of the Quelccaya ice cap (−13.93S, −70.83W) at an altitude of 5670 m. For this study, 1280 back trajectories were created where each run was 72 h in length and generated information on latitude, longitude, and height. These trajectories were then clustered into annual and seasonal (DJF, MAM, JJA, SON) groups for comparison of key pathways. Clusters are then visualized in python (v3.7) using the PySPLIT tool kit (Warner, Reference Warner2018).
3. Results
3.1 Annual layer preservation in the Quelccaya and Illimani shallow firn cores
Based on the comparison of SWI (δ 18O) records between the two shallow ice core records, QU-18 exhibits a ‘washed out’ signal below the 5 m depth while the IL-17 isotopes have well-preserved annual layering (Fig. 2). During the drilling procedure for QU-18, increased melt within the core sections, or the presence of water in the borehole was noted along with a buildup of meltwater above the firn-ice transition at around the 23 m depth and the fact that the drill could no longer penetrate. The flattened pattern of SWI washout has been previously documented in ice cores drilled at Quelccaya Ice Cap drilled above the firn-ice transition (1983, 1991, 2003, 2016), whereas the 1976 δ 18O record does show likely annual variability (Thompson and others, Reference Thompson, Mosley-Thompson, Davis and Porter2017, Reference Thompson2021). An increase in regional temperatures over the past seven decades is responsible for the enhanced melting at Quelccaya (Bradley and others, Reference Bradley, Keimig, Diaz and Hardy2009; Salzmann and others, Reference Salzmann2013; Vuille and others, Reference Vuille, Franquist, Garreaud, Lavado Casimiro and Cáceres2015; Yarleque and others, Reference Yarleque2018; Imfeld and others, Reference Imfeld2021). The dissimilarities in melt conditions are due to the 680 m difference in elevation between the two ice core drill locations, also evident when compared with even higher Andean records such as Huascarán (6050 m) δ 18O records (Thompson and others, Reference Thompson, Mosley-Thompson, Davis and Porter2017).
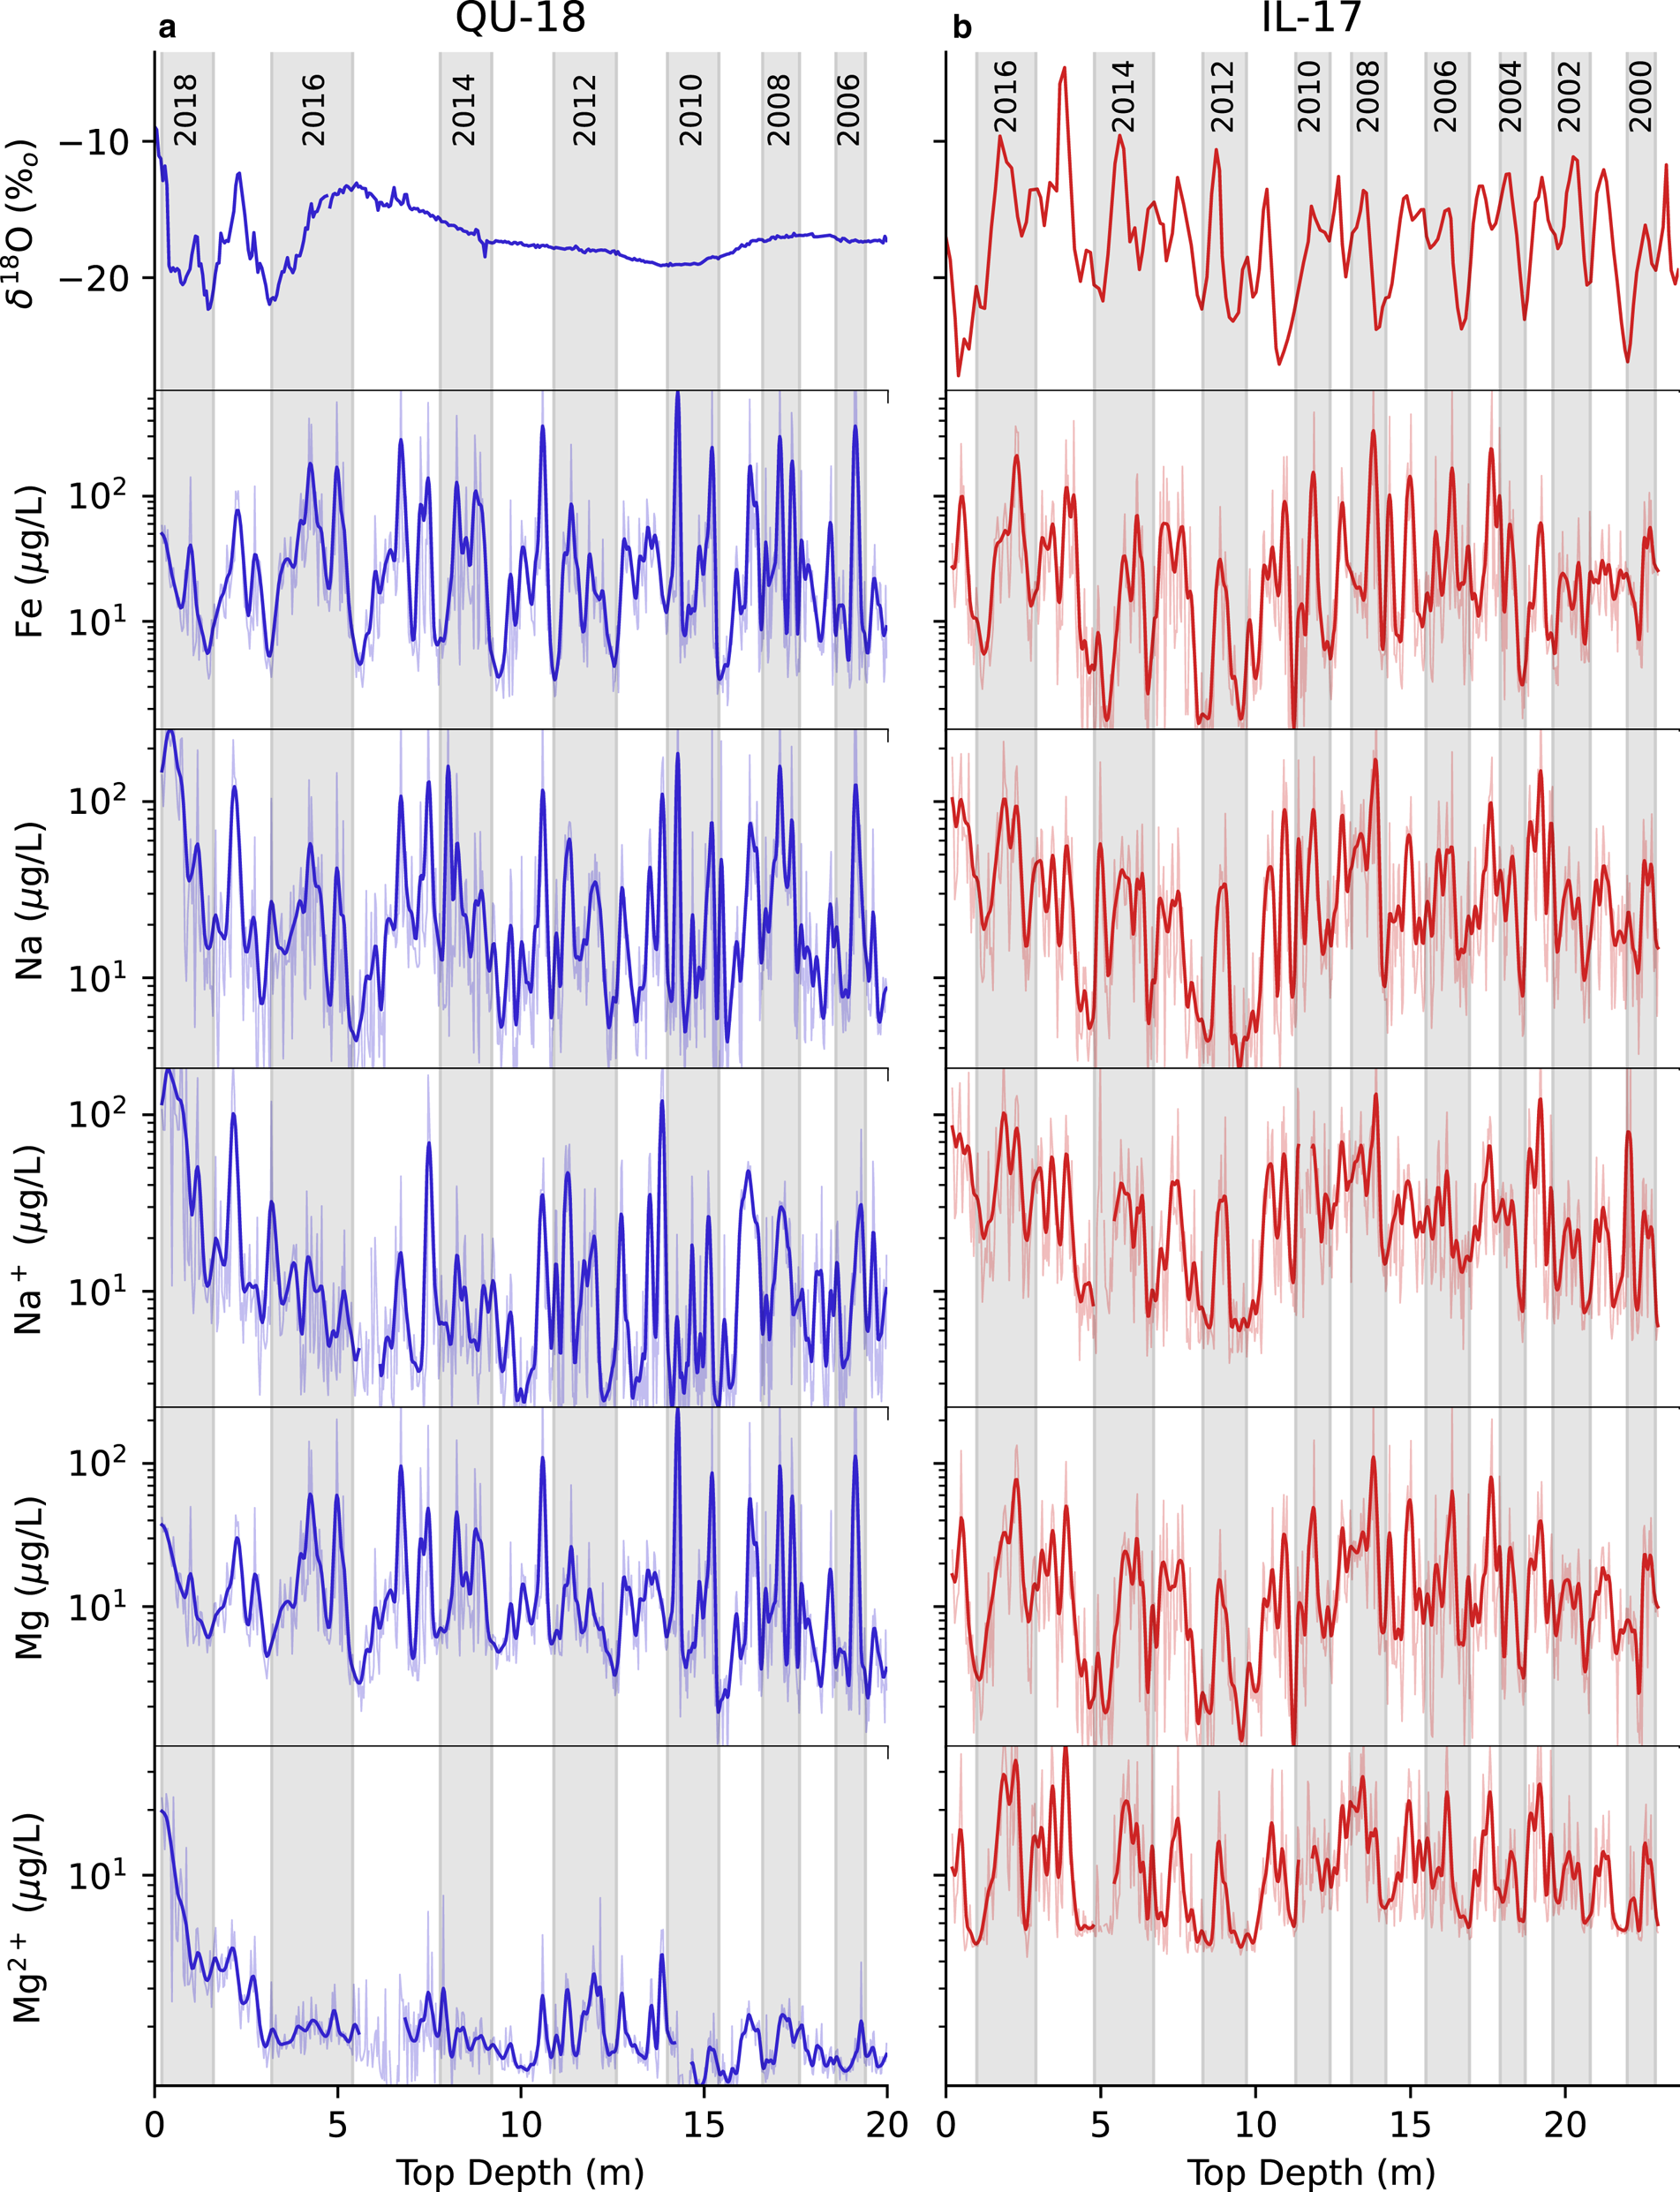
Fig. 2. Raw and smoothed (1σ Gaussian) glaciochemistry (δ 18O, Fe, Na, Na+, Mg, Mg2+) measurements from QU-18 (a, blue) and IL-17 short core (b, red) by depth in meters. The vertical highlights indicate where the years are located by depth from annual layer counting (QU-18) and from Lindau and others (Reference Lindau2021, IL-17).
Trace element records (e.g. Fe, Mg, K, Na), in both Quelccaya and Illimani ice cores, however, are well-preserved. While Ca and S have relatively high-water solubility and a flattened signal at several depths in the QU-18 record; Fe and Al have well-preserved signals since they are water-insoluble mineral dust (Avak and others, Reference Avak, Schwikowski and Eichler2018). Wash out in the environmental signal is also detected in the soluble chemistry in the QU-18 records. Na+, K+ and Cl− demonstrate greater preservation and correspondence to their insoluble and soluble counterparts detected using ICP-MS. In comparison, Mg2+, Ca2+, SO42− and NO3− (Fig. S7) are visibly more impacted by meltwater, likely due to differences in the elution behavior (Eichler and others, Reference Eichler, Schwikowski and Gäggeler2001; Avak and others, Reference Avak2019). However, we do note that there is a visible impact on the signal for all of the soluble chemistry and therefore are not a major focus of this. It is important to acknowledge there may be an impact on the upper portion of some QU-18 trace element records from the increased surface melt present at the drill site, as shown by the elevated signal present in the upper ~0.5 m of Na (Fig. 2). This portion of the core is not removed from the record because we find the concentrations of this section are not elevated in other elements shown in Figure 2, but rather acknowledge it since it may be important for future research.
While Ca has been previously used as a dust proxy for dating in Andean cores, it tends to be more soluble compared with other trace elements and does not preserve as strong a seasonal signal (Avak and others, Reference Avak2019). Based on correlations between chemical species using smoothed data (Gaussian, 2σ – see methods) for seasonal pattern detection, we find that Fe is highly correlated (r-value ≥ 0.99, p < 0.05) to Mg, Si, La, V, Ti, Ce and Al, while Ca only has an r-value of 0.28. Double peaks are identified in multiple crustal element concentrations, including Fe, Ce, Al and Ti (μg L−1), which is a feature common to the Central Andean dust deposition (Ginot and others, Reference Ginot2002; Vimeux and others, Reference Vimeux2009). Using this feature for dating, 14 annual layers were detected in the ~20 m QU-18 firn core for the period 2005–2018. The IL-17 chronology, 1999–2017, was established by Lindau and others (Reference Lindau2021) completely independent of the QU-18 record annual layer counting, using dust concentration measured at the University of Milano-Bicocca in Italy, along with Ca2+ and δD measured at CCI (University of Maine). The Andean mineral dust (Fe, Al, Ti, Ce) signals in the two cores exhibit similar seasonal variability, most notably for the period 2009–2017 (Fig. 3). We do note an apparent phase shift below 2009. Collecting and comparing longer glaciochemical records from regional Central Andean ice cores at a similar resolution would allow for further investigations into the duration and frequency of phase shifts between regional records.

Fig. 3. Smoothed (2σ Gaussian) glaciochemistry measurements of Fe, Al, Ti and Ce (μg L−1) showing the corresponding overlaps of QU-18 (blue) and IL-17 (red) shallow ice cores by age from 2009 to 2018 CE.
3.2 Exploratory annual layer detection in old, compressed ice via ultra-high-resolution investigation
Layering was visible at the site where the Quelccaya (QNB-18) ice core was drilled (Fig. S1). Although this portion of near-basal ice at the terminus of the glacier had likely undergone transformations due to flow and compression, the visible layering validated our confidence that this core could be used to identify ALT using an ultra-high-resolution technique. The prospect for this approach is to give insight into the distribution of layering in the compressed portion of the Quelccaya ice cap by applying a technique of annual layer counting, described in detail by Bohleber and others (2018).
Two of the deeper sections of the 7 m core were 14C dated: 57 CE (1893 B.P.) ± 123 (1σ) in the ~5 m depth section (QNB6) and −212 CE (2162 B.P.) ± 118 (1σ) in the ~6 m depth section (QNB7) (Fig. 4). The distributions of ages resulting from 14C dates further validate that the layering in this portion of the core is sufficiently stratigraphically continuous for the purpose of analysis. Ultra-high-resolution (120 μm per sample) trace element measurements were measured continuously from two segments of the QNB-18 core using the LA-ICP-MS application for ice cores, detailed in Sneed and others (Reference Sneed2015). Based on LA-ICP-MS analysis 56Fe exhibited the strongest signal and variability reflecting seasonal dust deposition. Well-defined variability of LA-ICP-MS 56Fe has previously been detected in a high mountain ice core recovered from a European Alps glacier used for a Saharan dust event record (Clifford and others, Reference Clifford2019). A total of 8732 and 5750 56Fe measurements were collected for QNB6 and QNB7 sections, respectively.

Fig. 4. Annual layer counting of highly compressed ice from two sections, QNB6 (upper ice, a) and QNB7 (lower ice, b) of QNB-18 (Quelccaya near basal ice core drilled in 2018) using ultra-high-resolution LA-ICP-MS 56Fe (cps) measurements, described in the Methods section. Distributions of annual layer thickness (c) and the number of data points or measurements per year (d) for QNB6 and QNB7. Apparent annual layers were counted in the ultra-high-resolution data by applying a peak detection method from the sci-py module in python3 with user input based on visually distinguishing appropriate spacing between years.
Apparent annual layers were counted in the ultra-high-resolution data by applying a peak detection method, discussed above in the Methods section. This technique is applied to smoothed LA-ICP-MS 56Fe using a Gaussian smooth at 4σ to remove any excess noise from the signal. The smooth and peak detection parameters were chosen after careful visual assessment of peaks that are most likely associated with annual layers after manually counting annual layers in a portion of the two core sections. From the upper section of the core, QNB6, 121 annual layers were counted with an average of 73 data points per year, with ALT ranging from 0.29 to 0.79 cm (0.38 cm avg.). In the lower section of the core, QNB7, 81 annual layers were detected with an ALT range of 0.23–0.58 cm (0.37 cm avg.) per year with an average of 72 data points per year. The lower section of the core, QNB7, also exhibits greater layer thinning compared with the upper section (QNB6) as expected with increased depth. The combined values of annual layers within the two sections (202 years) are in the range of the difference between the measured 14C calibrated calendar age ranges (including 1σ error), 28–510 years, from QNB6 (66 BCE to 180 CE) and QNB7 (330 to 94 BCE).
3.3 Regional associations of trace element concentrations from Central Andean ice cores
To detect statistically significant similarities between chemical signals from the QU-18 and IL-17 short cores, we ran cross-correlations between the different species from each core. To compare overlapping trends and identify sub-annual relationships, the chemical records were resampled to 0.1 of an ALT for the period 2006–2015 and then smoothed with a Gaussian filter (1σ) since there are differences in sampling resolution between the two cores, omitting Ca, S, SO42−, Ca2+, Mg2+ and NO3− from QU-18 due to melting impact. The elements with significant positive correlations (p-value <0.05) between the two cores include: U, Sr, Li, Pb, Ba, Sc, Pr, Cs, Na, Si, Co, La, Ce, Al, Cr and Ti, from highest (r = 0.5) to lowest (r = 0.3) respectfully. Of these elements, Cs, Pb, Ce, La, Al, Pr, Sc, U, Li and Ti are best preserved (in the respective order) under conditions of limited meltwater percolation based on a scale of concentration to preservation ratio in wetter conditions in a firn core from the European Alps (Avak and others, Reference Avak, Schwikowski and Eichler2018, Reference Avak2019). Of the lowest-ranked elements (showing depletion based on lack of unidentifiable seasonality) on the scale, we still, however, achieve statistically significant correlations between the two cores for Zn, Ba, Na, Co and Sr (Cr and Si were not ranked). This suggests varying levels of preservation in different trace elements could be unique at each high mountain site depending on the amount and frequency of the particle-based chemistry being deposited and the impact of the meltwater as previously suggested (Avak and others, Reference Avak2019).
Of the cross-correlations run, the highest (r ≥ 0.6, p < 0.05) are between Zn from QU-18 and Sr, Cd, Co, Ca, Mn, Na, Mg and K from IL-17, suggesting Zn is well-preserved in QU-18 and likely comes from the same air mass or source as the detected elements in IL-17. Other high, significant (r ≥ 0.5, p < 0.05) correlations exist between Li from IL-17 and As, Cr, Pb, Sr and U from QU-18, as well as U from QU-18 to Sr, Ba, La, Ce, Pr, Li and Sc from IL-17, suggesting that these elements are transported with southerly air masses since Li is an evaporite proxy likely coming from Bolivia and is also strong seasonal indicator noted in a previously recovered Illimani ice core (Correia and others, Reference Correia2003).
Comparison of the average major and trace element concentrations of the QU-18 and IL-17 short cores and the QNB-18 near basal ice core are presented in Figure 5 and Figure S8. We include the near basal ice because it is old, as indicated by the 14C calibrated age ranges, and therefore provides an example of pre-industrial background. The most abundant elements for the QU-18 ice core (>1% total concentration), in order of percent, are Si, Al, Fe, S, Ca, Na, K and Mg, while similarly for the IL-17 ice core (S, Si, Ca, Fe, Al, Na, K and Mg) and the QNB-18 ~2ky old ice (Al, Na, K, Fe, Si, Ca and Mg). From Uglietti and others (Reference Uglietti, Gabrielli, Cooke, Vallelonga and Thompson2015) in which trace elements were measured from Quelccaya via ICP-MS using slightly different methodologies, their results show Al, Fe, Ti, Mn and Zn are the most abundant elements on average from three different time periods (793–1450, 1450–1900, 1900–1989 CE). These elements, which reflect a dust signature, are also prominent in the QU-18 record. Expanding to the Tupungatito ice core from Chile also indicates that similar elements are abundant in local dust and soil-based aerosols as Ca, S, Al, Fe, Mg, Na and K are >1% of the total sum of average concentrations (based on the same ICP-MS methodologies) (Potocki and others, in review).

Fig. 5. Statistical overview (mean, ci = 0.95) of major and trace element concentrations for the entirety of QU-18 (blue circle) and IL-17 (red triangle) shallow firn cores.
3.4 EFc analyses
For EFc calculations, we use Al as the crustal reference which results in a > 0.99 r-value for correlations with several known crustal-based elements (e.g. Fe, Mg, V, La, Ce, Ti, Ba, Pr). Here we define different levels of enrichment based on the resulting value from the EFc calculation as follows: <10 is not enriched, >10 and <100 are moderately enriched, and >100 is heavily enriched (similar to Correia and others, Reference Correia2003). The elements with an average EFc value denoted as enriched (>10) for either the QU-18 and IL-17 shallow cores include Zn, Ag, S, Cu, Cd, Pb, Bi, As, Cs, Li, Ca and Mn (Fig. 6). Pb, Cu, As, Bi, Mo, Sb, Cr, Ni, Zn, Co and Cd have been previously associated with anthropogenic sources in the Central Andean ice cores (Correia and others, Reference Correia2003; Eichler and others, Reference Eichler, Gramlich, Kellerhals, Tobler and Schwikowski2015; Uglietti and others, Reference Uglietti, Gabrielli, Cooke, Vallelonga and Thompson2015). Some enriched species such as Ag, Cu, Pb, Bi and As, are likely from the transport of anthropogenic releases to the atmosphere, typically from dust and fumes from mining, production facilities, coal and fuel combustion, refuse incineration, and iron and steel production (Nriagu and Pacyna, Reference Nriagu and Pacyna1988; Pacyna and Pacyna, Reference Pacyna and Pacyna2001; Correia and others, Reference Correia2003; Pacyna and others, Reference Pacyna2007). Additional enriched species will be further detailed in forthcoming sections since these elements are prone to originate from other sources (e.g. biomass burning, evaporite salts, volcanic).

Fig. 6. Enrichment factor calculation (EFc) comparison of select major and trace elements (Pb, Cd, As, Cu, U, Ag, Bi, Zn, S, Li) from 2000 to 2018 CE for the QU-18 (blue) and IL-17 (red) short cores. Circles to the right of the plots signify average EFc values with 95% CI for QU-18 (blue), IL-17 (red), QNB-18 (green), QU-15.1 (orange; Quelccaya ice core for 795–1850 CE from Uglietti and others (Reference Uglietti, Gabrielli, Cooke, Vallelonga and Thompson2015)), QU-15.2 (yellow; Quelccaya ice core for 1850–1990 CE from Uglietti and others (Reference Uglietti, Gabrielli, Cooke, Vallelonga and Thompson2015)) and TU-12 (purple; Tupungatito ice core (Chile) for 1913–2012 CE from Potocki and others (In Review)). Grey highlight signifies the potential 2010–2011 Bolivian forest fire signature in IL-17.
3.5 EOF analyses
The computed EOFs of QU-18 and IL-17 sites (Fig. 7) are dominated by dust sources, with most crustal elements having >90% variance in the first EOF. The QU-18 shallow core exhibits seven EOFs of interest (denoted as EOFQ), with at least one element above 10% variance. A similar statistical method, principal component analysis, was applied on the major ions from the Illimani 1999 ice core, giving a similar result (dominated by dust sources) (Knüsel and others, Reference Knüsel, Brütsch, Henderson, Palmer and Schwikowski2005). There are our resulting EOFs of interest from IL-17 chemistry (denoted as EOFI). In addition to the two shallow cores, we ran an EOF on the 7 m QNB-18 ice (denoted as EOFQB) to establish the differences in chemical signals and distinguish air mass patterns from the 2000-year-old ice and the modern ice. The resulting EOFs indicate nine are of interest, having at least one element >10% variance.

Fig. 7. Resulting components from empirical orthogonal function (EOF) for QU-18 short core (a), IL-17 short core (b) and the near basal ice core from QNB-18 (c). Crustal elements (Mg, Fe, Al, Sr, Ba, La, Ce, Pr, Sc, Ti, V, Co, Si, U, Cs, Mn) are shown in black, while elements likely to be from additional sources are shown in color (Ca, S, Bi, Na, Ag, Cu, Pb, Cr, Zn, As, K, Li, Cd). Ca and S are not included in the QU-18 EOF analysis due to washout impact.
The first EOFs in QU-18 (EOFQ1: 74.3% variance) and IL-17 (EOFI1: 75.7% variance) are heavily dominated by mostly crustal-based elements (>90% variance in QU-18: Mg, Ba, Mn, Al, Si, Co, V, La, Fe, Pr, Ti, Ce, Cs, Sr, As, U; >90% variance in IL-17: Mg, V, Al, Pb, Ti, U, Ba, Fe, Si), therefore soil or dust sourced aerosols dominate chemical impurities in Central Andean glaciers (Hong and others, Reference Hong2004; Uglietti and others, Reference Uglietti, Gabrielli, Cooke, Vallelonga and Thompson2015; Eichler and others, Reference Eichler2017) (Fig. 6). Similar to EOFI1 and EOFQ1, EOFQNB1 (74.8% variance) is mostly influenced by crustal elements, and the elements with >90% variance include Fe, Pb, U, Al, Ba, Mg, Ti, Co, V, La, As, Cs and Sr.
EOFQ2 (17.1% variance) is dominated (>10% variance) by Cd, Zn, Pb, Cu, Na and Cr, and similarly, EOFI2 has >10% variance of S, Cd, Zn, Ca, Na and Mn and EOFQB2 has >10% variance of Cd, Zn, S, Li, Cu and K. While Cd, Zn and S are likely from volcanic-derived soils, the heightened variance of Pb and Cu within EOFQ2 could be attributed to mining-based emissions locally sourced to the Quelccaya region, for example, the uranium deposits located ~45 km southeast in the town of Macusani (Li, Reference Li2016). EOFQ3 (3%), 4 (1.8%), 5 (0.8%) and 6 (0.7%) are dominated (>10% variance) by Ag and Bi, Bi and Ag, Na, and Zn, respectively, while EOFI3 (4%) and 4 (3%) are dominated by Cr, Zn, Ag and As, and Bi, respectfully. Additionally, EOFQNB3 (4.8%), 4 (3.2%) and 5 (2.6%) are dominated (>10% variance) by Li, S, Zn, Cr, and K, Ag and Cu, and Cu, respectively. The resulting EOFs with lower variances are likely related to non-crustal sources such as volcanically-derived (Zn, Bi, S), anthropogenic (Cr, Zn, As, Ag, Bi) and marine/evaporites (Na, Li, K) sources. Possible alternative natural sources for the typical crustal-sourced elements that also show enriched signatures (e.g., Mn, Ca, Cs) may include input from volcanoes, biogenic continental particulates or forest fires (Nriagu, Reference Nriagu1989; Hong and others, Reference Hong2004; Meter and others, Reference Meter, Atkinson and Laliberte2019).
4. Discussion
4.1. Well-preserved trace elements records from melt-impacted core
Melt in a glacier typically occurs within the firn and percolates through the porous media to firn-ice transition, where it creates a water table. If the water build-up is not discharged vertically and refreezes, it can lead to stratigraphic discontinuity due to the presence of residual firn within, and between, major ice layers (Gascon and others, Reference Gascon, Sharp, Burgess, Bezeau and Bush2013). The downward transport of meltwater within the firn can alter and even redistribute chemicals engrained in the firn used for environmental reconstructions; however, the degree of depletion is not well understood since we are not aware of the initial conditions before melting (Avak and others, Reference Avak2019). Stable oxygen isotopes (δ 18O) exhibit distinct flattened signals when infiltrated directly by meltwater or can show patterns reflecting the seasonal water table fluctuating between melt and refreezing. Yet, signal preservation in the underlying ice (below firn/ice transition) is still likely due to lateral drainage of percolating water (Thompson and others, Reference Thompson, Mosley-Thompson, Davis and Porter2017). Similar smoothed patterns can be observed in soluble ion chemistry; however, the mobilization is conditional based on the species and its enrichment at ice crystal surfaces during snow metamorphism (Avak and others, Reference Avak2019). The environmental signal preservation in major and trace element measurements is conditional, based on their solubility in water. However, this process is still rather understudied.
Particular environmental signals, including δ 18O, Ca, S, Mg2+, Ca2+, SO42− and NO3−, from the QU-18 core exhibit a flattened record due to increased melt-water influences. Yet, particle-based trace element records (e.g., Fe, Mg, K, Na) in both QU-18 and IL-17 ice cores are well-preserved. Although isotopes and soluble chemistry signals are influenced by enhanced melt, we hypothesize based on our findings that a large portion of insoluble major and trace elements from the ICP-MS from the QU-18 ice are less mobile and therefore may be used for purposes of annual layer counting, climate reconstruction, air mass proxies, etc. We do, however, note that further research is necessary to provide detailed investigations into the full impact of meltwater on different chemical impurities and methodologies, as shown by Avak and others (Reference Avak, Schwikowski and Eichler2018, Reference Avak2019).
Greater preservation of insoluble mineral dust allowed for the detection of seasonal variation in the QU-18 firn core. From our results, 14 annual layers were detected in the ~20 m QU-18 firn core for the period 2005–2018. In comparison with the 18-year chronology from 1999 to 2017 in the IL-17 core, we note that the mineral dust (Fe, Al, Ti, Ce) signals in the two cores are very similar and likely reflect comparable seasonal variation from the wet to dry season. The strong association between the two different sites affirms the broader regional relationships previously revealed using Central Andean water isotope records in Hoffmann and others (Reference Hoffmann2003) and Guy and others (Reference Guy2019), but until now not yet noted in particle-based chemistry records. Further research would benefit our understanding of the mechanisms of climate and environmental signal loss in the presence of massive percolation.
4.2 Defining environmental proxies derived from Central Andean firn/ice core trace element records
Climate reconstructions from the Andes using isotopic composition and soluble ions have been the basis for modern studies on tropical ice cores and are typically focused on the atmospheric water cycle (e.g. Hoffmann and others, Reference Hoffmann2003; Ramirez and others, Reference Ramirez2003; Thompson and others, Reference Thompson2006, Reference Thompson2013; Guy and others, Reference Guy2019). While several trace element ice core analyses are published from the Andes (e.g. Ferrari and others, Reference Ferrari2001; Correia and others, Reference Correia2003; Hong and others, Reference Hong2004; Eichler and others, Reference Eichler2017; Osmont and others, Reference Osmont, Sigl, Eichler, Jenk and Schwikowski2019), there is only one ice core-trace element analysis from the Quelccaya Ice Cap published thus far (Uglietti and others, Reference Uglietti, Gabrielli, Cooke, Vallelonga and Thompson2015). Here we dissect the relationships of the abundant glaciochemical measurements from the Central Andean firn and ice cores in this study and previous studies to define environmental proxies from ice core trace element records. The purpose of this discussion is to present distinct Central Andean ice core proxies that are largely understudied in comparison to other high mountain regions but would add immense value to paleoclimate research if longer and more detailed records were able to be collected.
4.2.1 Crustal proxies
Based on the annual layering identified in both QU-18 and IL-17, trace element signatures originating from dust (e.g. Fe, Al, Ti) show seasonal variability with higher concentrations occurring during the dry season based on regional precipitation patterns (April to October), as seen previously using Ca2+ (Knüsel and others, Reference Knüsel, Brütsch, Henderson, Palmer and Schwikowski2005). Seasonal timing based on the examination of clustered backward trajectories for seasonal source transport to the Quelccaya Ice Cap indicates austral summer dry season (DJF) trajectories from land-based northerly (60%), south-easterly (22%) and north-easterly (16%) sources, with only 2% from westerly moisture sources (Fig. S5).
Previous studies have identified local or nearby sources as responsible for the majority of the dust aerosols in Central Andean glaciers (Ferrari and others, Reference Ferrari2000; Correia and others, Reference Correia2003). For example, the mineralogy and geochemistry resulting from dust particulates from a Nevado Illimani ice core are indicative of local sources in the Southern Altiplano-Northern Puna areas, that are characterized by felsic to intermediate plutonic volcanic source rocks, present in both wet and dry seasons (Delmonte and others, Reference Delmonte2010; Gili and others, Reference Gili2017; Lindau and others, Reference Lindau2021). While QU-18 does not contain enough years for statistically significant spatial correlations, IL-17 Mg yields patterns of significant positive and negative correlations to 850 hpa wind speed and V-wind (wind with a direction of South to North) in the dry season (AMJJASO) for 2000–2017, respectively, using ERA5 reanalysis (Hersbach and others, Reference Hersbach2020), that overlay the Central Andes. Negative correlations to wind speed and positive correlation to 850 hpa V-wind on the western side with opposite correlations on the eastern side of the Central Andes reflect the convergence of air from the southeast Pacific anticyclone with winds accompanying the continental low-level jet (Garreaud, Reference Garreaud2009). The low-level winds between 35°S and 10°S are oriented from south to north along the Pacific coast and flow from north to south along the eastern slopes (Garreaud, Reference Garreaud2009). The foregoing further supports the suggestion that localized amplified winds are responsible for heightened dust during the dry season (Figs S9, S10).
4.2.2 Marine-based proxies
Interannual variability of Quelccaya δ 18O is mostly controlled by Pacific SSTs via the expansion of the tropical troposphere coupled with a warm tropical Pacific and heightened Westerly flow over the Andes (Vuille and others, Reference Vuille2008; Thompson and others, Reference Thompson2013). From seasonally clustered back trajectories, westerly-Pacific moisture sources are observed to be the most significant in JJA (Clusters 1, 4: 46%), SON (Clusters 3, 4: 31%) and MAM (Clusters 3, 4: 30%), while only contributing to 2% of the clusters from DJF (Figs S2–6). However, there is minimal evidence of trace element signatures from Pacific-based sources to the Central Andes based on previous literature. This is likely due to the enhanced evaporite signals from regional salt flats, which potentially overrides a sea-salt signal in ice core trace elements, which have been previously detected, for example, with Na, K, Li, Mg, Ca and Sr signals. Another likely masking against particulate transport from the Pacific coastal zone is the omnipresent thermal inversion ~1500 m a.s.l. resulting from cold sea surface temperatures. Besides δ 18O, westerly Pacific moisture sources have been associated with high concentrations of marine-source chemistry (Cl−) and MSA. Further supporting the marine source of Cl−, a significant positive correlation was generated between IL-17 Cl− and enhanced eastward 850 hpa U-wind direction off the Peruvian coast in the Pacific Ocean during the wet season (NDJFM) from 2000 to 2017 (Fig. S11). EOFQ5 (0.8%), while low in variance, is dominated by only Na (11%) and though ion data are not available for QNB-18, Na is dominant (>10%) in EOFQB7 (1.4%) and 8 (1.1%). More research is required to investigate ice core-based trace element proxies that correspond with Pacific moisture sources that are outside the scope of this study.
4.2.3 Evaporites proxies
Li dominates with a variance of 55, 15 and 26% in EOFQB1 (74.8%), EOFQB2 (7.4%) and EOFQB3 (4.8%) respectively, while Li in both EOFQ and EOFI is notable in the first EOF (89, 82%), defined by crustal elements. Heightened deposition of Li 2000 years ago could indicate more frequent southerly air flows to Quelccaya 2000 years ago, enhanced uplift of Li from the salt flats due to changing water levels on Titicaca and Lake Poopo, with lower lake stands yielding higher aerosol loads (Zolá and Bengtsson, Reference Zolá and Bengtsson2006). Evaporite salts from the southern salt flats located in Bolivia were detected in a 1999 Nevado Illimani ice core using Li, with higher concentrations in the dry season. Evaporite salts are likely responsible for the occurrence of Li in the QNB-18 ice, specifically in EOFQB3 (4.8%) which includes S, Li, Zn and Cr (Correia and others, Reference Correia2003). Average Li enrichment calculations indicate enriched Li in all three short cores, with the greatest values in IL-17 (26 ± 112) which is closest to the source as evident by the large variability, followed by QNB-18 (21 ± 8) and QU-18 (14 ± 9). In comparison, TU-12 (ice core from Tupungatito, Chile drilled in 2012) exhibits non-enriched Li values since it is sourced from crustal materials rather than evaporite salts due to distance from salt flats (Potocki and others, Reference Potocki2022a).
4.2.4 Volcanic proxies
Elevated levels of S (or SO42−), Cl−, F−, Bi, Tl, Ag, As, Bi, Cd, Cr, Mo, Pb and Sb have been used to identify volcanic signals in Andean ice cores in the past (De Angelis and others, Reference De Angelis, Simões, Bonnaveira, Taupin and Delmas2003; Knüsel and others, Reference Knüsel2003; Uglietti and others, Reference Uglietti, Gabrielli, Cooke, Vallelonga and Thompson2015; Lindau and others, Reference Lindau2021). These authors proposed the following volcanic eruption sources for volcanic signals that have been detected in Central Andean ice cores: Nyamuragira-Nyiragongo (2014 CE), Rabaul (2006 CE), Tungurahua (1999/2000 CE), Sabancaya (1994 CE), Pinatubo (1991 CE), El Chichon (1982 CE), Agung (1963 CE), Krakatau (1883 CE), Tambora (1815 CE) and the Unknown 1258 CE (De Angelis and others, Reference De Angelis, Simões, Bonnaveira, Taupin and Delmas2003; Knüsel and others, Reference Knüsel2003; Herreros and others, Reference Herreros2009; Ginot and others, Reference Ginot2010; Kellerhals and others, Reference Kellerhals2010; Lindau and others, Reference Lindau2021). It is common for other volcanic areas that particles geochemically similar to regional volcanic sources could mimic volcanic horizons with material unrelated to the specific volcanic event (Hildreth and Fierstein, Reference Hildreth and Fierstein2012). For example, Seimon and others (2003) suggest earthquake-lofted particulates are present in Quelccaya strata.
Rabaul (~2006) and Nyamuragira-Nyiragongo (~2014) eruption signals were detected from the IL-17 core using EFc S and SO42− excess (Lindau and others, Reference Lindau2020). From our IL-17 EOF calculations, EOFI4 (3.0%) has a high variance of Bi (35%) pointing to a probable volcanic source. The QU-18 EOF calculations, which do not include S due to washout, result in EOFQ4 (1.8%) dominated by Bi (29%) and Ag (12%), which could indicate a volcanic source. We find EFc calculations of Bi are potentially an alternative volcanic proxy in QU-18, which has been previously used as a volcanic proxy in the Himalaya where S ions are dominated by the dust chemistry (Kaspari and others, Reference Kaspari2007, Reference Kaspari2009). Due to the range of EFc >300 in 2006, 2008–2009 and 2013–2014, we suggest QU-18 EFc Bi may be correlated with volcanic signals identified in previous studies as eruptions Rabaul (2006), Chaitén (2008) and Nyamuragira-Nyiragongo (2014) (Fig. 6).
High levels of Cd have been found in South American soils around the Central Andes and are a proxy for soil-based natural substances derived from the enhanced volcanic presence, also from coal-burning (Meter and others, Reference Meter, Atkinson and Laliberte2019). Cd has the highest variance in EOFQ2 (17.1%) with a variance of 89%, EOFQB2 (7.4%) with a variance of 48% and the second-highest in EOFI2 (8.7%) with a variance of 31%. Highly enriched values of Cd are identified in the ~2000-year-old QNB-18 ice and IL-17, with more moderately enriched values in QU-18 and TU-12 (Fig. 6), and additionally detected in the mid-Holocene in Bolivia from the Sajama ice core (Hong and others, Reference Hong2004). Average Cd concentrations in the old ice (18 ± 20 ng L−1) exceed levels in both IL-17 (7 ± 9 ng L−1) and QU-18 (3 ± 7 ng L−1), further suggesting the likely source is not anthropogenic but rather from natural wind-swept soils or volcanic eruptions. Additionally, significant positive correlations are detected between IL-17 Cd and austral summer (DJF) 10 m wind speed (from ERA5) located around the Central Andean cordilleras where high volcanic content is present in soils (Fig. S12). We suggest, based on the spatial correlations to wind speed and high percent variances in EOF2 from all three cores, the chemical species Cd, S and Zn are favorably sourced from heightened volcanic presence in the soils of the Central Andes and amplified wind speed during the austral summer.
4.2.5 Biomass burning proxies
Black carbon and heavy metals in Central Andean ice cores likely show similar chemical signatures as they are both, in part, sourced by biomass burning from vegetation fires in the Amazon basin and are transported by similar mechanisms as shown by their corresponding seasonality (Yamasoe and others, Reference Yamasoe, Artaxo, Miguel and Allen2000; Correia and others, Reference Correia2003; Osmont and others, Reference Osmont, Sigl, Eichler, Jenk and Schwikowski2019). We note a simultaneous large increase in EFc values of Cu, Zn, Ag, Cd, S, Cs, Li and Pb in the IL-17 core ~2010–2011, not found in the QU-18 core (Fig. 6). This abrupt increase in multiple enrichment values is likely from the widespread forest fires in Bolivia that led to burning across 15 000 square kilometers, in addition to a severe drought in 2010 (Heyer and others, Reference Heyer, Power, Field and Van Marle2018). Another, less significant, peak in Ag, Cd, As, Cu, Li, S and Zn is detected in 2015, which may reflect the increased biomass burning from wildfires in Brazil caused by the 2015–2016 El Nino-induced extreme drought conditions (Ribeiro and others, Reference Ribeiro2018).
4.2.6 Anthropogenically-sourced proxies
Based on the EFc time series, values of Pb, Zn, Cu and Cd increase drastically after 2015 in the QU-18, while the values match closely to IL-17 before 2015 (Fig. 6). This pattern also corresponds with elements dominating EOFQ2. We do note that the top portion of the record (particularly the top ~0.5 m, down to 2018.5 CE) may be impacted by increased melt; however, the increasing trend in Pb begins at about 2015 corresponding to ~7.8 m depth from the surface. This abrupt increase could be due to production growth in the Peruvian mining industry after 2015 (Peru Copper Production, 1978–2020 Data). The increased presence of heavy metals in different facets of the Peruvian environment has also been identified in other recent studies (e.g. Quispe-Zuniga and others, Reference Quispe-Zuniga, Santos, Callo-Concha and Greve2019; Custodio and others, Reference Custodio2020; Molloy and others, Reference Molloy, Rodbell, Gillikin and Hollocher2020). The mining industry in Peru is the largest provider to the economy, the second-largest producer of Cu, Ag and Zn mining worldwide, and the third-largest producer of Pb worldwide (USGS, 2021a, 2021b, 2021c, 2021d). Based on our results, the production expansion in the Peruvian mining industry is creating a noticeable impact on the atmospheric occurrence of Pb, Cu, Cd and Zn, suggesting much of the Andean intermountain region including remote locations like Quelccaya is at an increased risk of heavy metal contamination.
Ag production in Peru gradually increased from 1950 to 1993, followed by an increased rate of production from 1993 to 2017 with a slightly decreasing trend between 2009 and 2011 (Peru Copper Production, 1978–2020 Data). There are two major peaks present over the past decade in Peruvian Ag production ~2008–2009 and 2015–2017. While the QU-18 EFc Ag and EFc Cu records do not exhibit comparable peaks to Peruvian Ag production, the QU-18 EFc Pb record closely resembles this trend with multiple peaks occurring after ~2008–2009 (2013, 2014), with a significant increase post-2016. The IL-17 EFc Pb values are within the range of QU-18 yet lack an increasing trend, indicating Peruvian mining as a likely source of Ag to the Quelccaya region. Nevertheless, a large increase in anthropogenic input of Ag and Cu between 1990 and 2008 is evident due to the QU-18 and IL-17 EFc Ag and EFc Cu values exceeding QU-15 (1850–1990) EFc Ag and EFc Cu values (Fig. 6). Compared with values from a Chilean ice core, TU-12, average EFc Ag and Pb values are lower than the Central Andean ice cores from this study, while EFc Cu values are within the range of the older ice QNB-18 and lower than the two modern cores (Potocki and others, Reference Potocki2022a).
In comparison to the 21st century, we note that ancient pollution from QNB-18: EOFQB4 (3.2%) is most influenced by Ag (67%), followed by Cu (11%), and EOFQB5 (2.6%) is dominated by Cu (47%). Average values of EFc Cu (78 ± 140) and EFc Ag (178 ± 380) from QNB-18 are highly enriched, and average concentrations for Ag and Cu are within the range of QU-18 modern values (Figs 5, 6). The notably high variance of Ag and Cu in confined EOFs from the QNB-18 ice suggests the existence of anthropogenic pollution near the Cordillera Vilcanota region ~2000 years ago. Evidence of long-term pollution has been detected in Central Andes ice cores, specifically enriched Pb and Cu from an Illimani ice core going back at least 2000 years (Eichler and others, Reference Eichler, Gramlich, Kellerhals, Tobler and Schwikowski2015, Reference Eichler2017) and enriched As, Bi, Mo, Pb and Sb records going back 800 years in a Quelccaya ice core (Uglietti and others, Reference Uglietti, Gabrielli, Cooke, Vallelonga and Thompson2015). The presence of Pb, Cu and Ag can also be attributed to natural sources such as local soil and rock, forest fires and volcanic emissions, which we do not rule out as influences on this record (Nriagu, Reference Nriagu1989). Cu and Ag metal production was widespread among ancient civilizations in the Central Andes region (Eichler and others, Reference Eichler, Gramlich, Kellerhals, Tobler and Schwikowski2015, Reference Eichler2017) as suggested by the metal clustering in the EOFs. Considering the uncertainty of the 14C dates, the age of the QNB-18 ice core ranges from 330 BCE to 180 CE placing the chemical signature during the Early Horizon pre-Columbian cultural period (1000 BCE to 200 CE), a period of advanced metallurgy production in ancient Peruvian Charipa and Chavin civilizations (Eichler and others, Reference Eichler2017). Collecting additional ice cores from the Central Andes for ultra-high-resolution glaciochemical measurements could allow for significant gains in further understanding of ancient civilizations that were located within this region.
4.3 Potential for Quelccaya surface-to-bedrock ice core timescale extension
The oldest dated Quelccaya ice core study (Quelccaya Summit Dome (QSD), 5670 m a.s.l., 168.68 m) using annual layer counting suggests an ALT of 2.1 cm ~1000 CE (Thompson and others, Reference Thompson2013). The QSD ice core was analyzed for mineral dust and δ 18O as well as major ions enabling annual layer counting to ~160 m depth (683 CE), while the full core was drilled to bedrock at 168.68 m (Thompson and others, Reference Thompson2013). Although information regarding the resolution of chemistry measurements was not published for this core, an ice core drilled ~2 km from this site, QND, has sub-annual to annual resolution from 1989 CE to 1383 CE and a multi-annual resolution down to 793 CE at 160 m, based on a 2–8 cm resolution sampling (Uglietti and others, Reference Uglietti, Gabrielli, Cooke, Vallelonga and Thompson2015). Returning back to the QSD ice core, below the 160 m depth, ages were determined using a polynomial fit to the age/depth relationship yielding a bottom (168.68 m) age of 226 CE. This suggests that the lower 8.68 m contain 457 years or an average ALT of 1.9 cm (Thompson and others, Reference Thompson2013). Visual detection of annual layers in low-resolution datasets and age-depth model applications are commonly used in ice core studies but are not always dependable for accurate representations of annual layering.
Ultra-high-resolution laser analysis from the two ice sections of near basal ice (QNB-18) in this study suggests an ALT ranging from 0.23 to 0.79 cm (~0.38 avg.). The age range for two adjacent sections of near-basal ice is determined by 14C calibrated ages (with 1σ error). QNB6 has 14C calibrated ages between 180 CE to 66 BCE, and QNB7 ranges from 94 BCE to 330 BCE. The 14C calibrated dates resulting from QNB6 are within an appropriate range of the bottom age of the Quelccaya surface-to-bedrock ice core (QSD) resulting from an age-depth model for a plausible comparison assessment. Based on our evaluation of the results from the QNB6 LA-ICP-MS 56Fe ALT analysis, we suggest an average ALT of 0.8 cm (maximum ALT measured using the peak detection method) with an uncertainty of ±0.4 cm. Assuming the average ALT resulting from QNB6 LA-ICP-MS ALT analysis (0.8 ± 0.4 cm) could be similar to the ALT measured for the bottom 8.68 m of the QSD core, we consider there could be between 720 and 2100 years in this portion of the core. These results suggest that where annual layers were not detectable in standard ice core chemical methodologies, the age/depth relationship model may only be detecting up to 60% of the annual layers detectable with ultra-high resolution trace element techniques. Our analyses speculate that there is potential for roughly double to quadruple of the projected number of years in the compressed basal portion of the Quelccaya ice cap compared to the resulting values from the age/depth relationship model.
5. Conclusions
Particle-based element records (e.g. Fe, Mg, K, Na) in QU-18 are well-preserved despite enhanced melt from a recent increase in Andean surface temperature and precipitation variability, allowing for the detection of seasonal variation and environmental records even when δ 18O exhibits a flattened signal. Annual layers in QU-18 were detected for 2005–2018 CE using the wet to dry seasonal variability identified in the particle-based element records. The QU-18 and IL-17 ice core chronologies, established independently by annual layer counting, show a convincing overlap of mineral dust (Fe, Al, Ti, Ce) signals to demonstrate a larger regional association of atmospheric circulation for ice cores separated by ~450 km. The correspondence of the short cores drilled at two distinct, regional sites and the identification of climate-based and anthropogenically sourced proxies can be used to affirm broader regional relationships of climatological signals with longer, future records.
Standard sampling resolution limits annual layer dating, but modern technologies now allow for well-preserved higher-resolution chemistry to be extracted from samples at a depth that have heretofore been too compressed to reveal annual layer structure using classic ~1–2 cm sampling resolution. The ALT (~0.4 cm) of QNB-18 (~2000-year-old), analyzed using ultra-high-resolution laser ablation technology (LA-ICP-MS), indicates Quelccaya ice cores to bedrock may be ~1000 years older or more than previously suggested by depth-age models. Particle-based elemental chemistry methodologies in ice cores, such as high-resolution (1–2 cm) ICP-MS analysis accompanied by ultra-high-resolution (120-μm) LA-ICP-MS, allow for annual layer detection in compressed ice, detection of seasonality and preserved signals in melt-impacted firn/ice, and can reveal new information regarding different environmental proxies in the Central Andes region including modern/ancient anthropogenic emissions, biomass burning, dust sources, volcanic emissions, evaporite salts, and marine-sourced air masses. Based on our interpretation, many environmental proxies from the Central Andean ice cores are understudied and would largely benefit from future glaciochemical analyses.
Paleoclimate research can be greatly enhanced by new high and ultra-high-resolution ice core records that are well-dated. The application of advanced technologies presents promising capabilities for future Andean ice core glaciochemical studies. Novel technologies for ice core applications, like the LA-ICP-MS and 14C dating, are expected to facilitate greater confidence in the dating of new Andean ice cores. Additionally, since isotopic and insoluble ion records from lower elevation sites like Quelccaya may become washed out, it is necessary to investigate environmental proxies that can be derived from particle-based element records. Future research will improve the scientific understanding of how Central Andean climate parameters vary and interact over sub-seasonal to decadal and longer scales and on linkages between atmospheric circulation patterns and forcings (e.g. solar variability, volcanic activity, greenhouse gases, dust).
Supplementary material
The supplementary material for this article can be found at https://doi.org/10.1017/jog.2022.91.
Data
The data for this article can be found at NCEI-NOAA Database.
Acknowledgements
This research is part of the Joint Brazil, Peru, US project with permission granted by Peru funded by NSF P2C2 AGS-1600018 (Mayewski and Birkel), and the Brazilian grants – CNPq 404002/2013-7 and 465680/2014-13; FAPERGS 17/2551-0000518-0 (Simões). All ice core analyses presented in this paper were conducted in the Climate Change Institute's W. M. Keck Laser Ice Facility and their ICP-MS laboratory at the University of Maine. We gratefully acknowledge support for this facility from the W. M. Keck Foundation and the National Science Foundation (PLR-1042883, PLR-1203640 and PLR-1417476). The Quelccaya (QU-18 and QNB-18) ice cores were collected by a joint team effort of Climate Change Institute at the University of Maine, Centro Polar e Climatico, Universidade Federal do Rio Grande do Sul, Porto Alegre, Brazil, Unidad de Glaciología y Recursos Hídricos, Universidad Nacional de San Antonio de Abad del Cusco (UNSAAC), Autoridad Nacional de Agua and National Research Institute for Glaciers and Mountains Ecosystems (INAIGEM). Illimani ice core (IL-17) was recovered by the team of the Ice Memory project (drill manager P. Ginot), and supported by IRD, CNRS, UGA Foundation and local Bolivian institutions (Universidad Mayor San Andrés – La Paz). We thank Adrián Ccahuana Condori and his team for field support as well as Nilton Montoya and Maxwell Rado for their assistance in the export of the ice. We thank the driller Mike Waszkiewicz and Dan Dixon for their efforts during the drilling campaign. Additional support in ice core processing and analysis was provided by Ling Fang (Paul Scherrer Institute) and the Alfred-Wegener-Institut (Bremerhaven, Germany) and the Climate and Environmental Physics Institute, University of Bern. We gratefully acknowledge their support.
Author contributions
Conceptualization, H.C., P.M.; methodology and field resources, H.C., M.P., P.M., C.R., D.D., M.H., E.K., D.I., F.S., F.T., R.B., F.L., O.V.G., H.J.I., V.B.U., B.P., J.M., G.C., S.H., J.S.; writing – original draft, H.C., P.M.; 14C dating and interpretation, M.S.; writing – reviewing and editing, H.C., P.M., F.S., F.L., O.V.G., B.P., J.M., A.S., A.K., K.M., J.S.


 Open access