


Introduction
Creep experiments on granular freshwater ice as a function of temperature have long indicated that there is a breakpoint at ≈−8°C that defines a shift to a regime of greater temperature sensitivity than observed at lower temperatures (e.g. Barnes and others, Reference Barnes, Tabor and Walker1971; Hooke and others, Reference Hooke1980). This temperature sensitivity becomes stronger with proximity to the melting point. Experiments have shown similar behavior for sea ice and oriented single crystals of freshwater ice. Although there has been speculation as to the cause of this phenomenon (suggestions include an increase in the activation energy for creep, preferential melting along grain boundaries and the operation of some undefined, high temperature deformation mechanism), an understanding of the physical processes underlying this behavior has not previously emerged. To fill this knowledge gap, the present effort focuses on identifying and quantifying the underlying cause of the observed high temperature behavior of ice, incorporating that behavior into a dislocation-based constitutive model and validating the model with major creep datasets in the literature.
The key technical developments include (1) an analysis of quasistatic cyclic loading experiments which demonstrates that the high-temperature effects are attributable to a thermally induced (as opposed to stress-induced) increase in the mobile dislocation density, and (2) a synthesis of data from quasistatic and dynamic experiments which gives the thermally induced mobile dislocation density as a function of temperature to −0.01°C. Significantly, the relationship that emerges between mobile dislocation density and temperature very closely approximates the temperature dependence observed in the creep rate of polycrystalline ice as the melting point is approached.
The analysis employs a principle of anelasticity/viscoelasticity known as time–temperature superposition to identify the high-temperature mechanism. The anelastic straining model of Cole (Reference Cole1995) supports this analysis by providing a way to calculate the mobile dislocation density from the hysteresis observed in cyclic loading experiments. Application of the time–temperature superposition principle, which is explained briefly below, provides a way to ascertain whether the observed temperature effects are caused by an increase in the mobile dislocation density or an increase in activation energy with proximity to the melting point. Although only a limited amount of experimental data is available for this assessment, experiments on several ice types (granular fresh water and columnar sea ice and an oriented single crystal of freshwater ice) produce a consistent picture that favors the increasing dislocation density explanation for this phenomenon. The granular ice of interest in the present effort is virtually pore-free polycrystalline ice having approximately equiaxial grains with randomly oriented c-axes.
Since mechanical loading experiments were employed in the studies cited below, it is implicit that this body of work deals with mobile dislocations, therefore in the following treatment, the term dislocation density implicitly refers to the mobile dislocation density. Although more experimental data are certainly called for, the present analysis leaves little doubt that the underlying process is rooted in dislocation mechanics. Due to the lack of consensus regarding the precise mechanism(s) responsible for the experimentally observed increase in dislocation density with temperature, however, exploration of that matter is left to the future.
The first of the following sections summarizes the existing dislocation-based model employed in the analysis. Since the glaciological community may not be familiar with work on crystalline solids other than ice, the section that follows the model description addresses high temperature effects on mechanical properties on other materials and provides validation for the present approach. The section entitled, ‘Thermally induced dislocations vs increasing activation energy’, illustrates the time–temperature superposition principle, applies it to the case of ice and concludes that the subject high-temperature effects are due to a thermally induced increase in dislocation density. The experimental results presented in this section were generated by the author and colleagues over the last 25 years, involve a variety of ice types and with a few exceptions as noted have not been previously published. The section entitled, ‘Quantifying the thermally induced dislocation density’, describes the dislocation density–temperature data obtained from the author's experiments combined with the results of dynamic experiments in the literature. This synthesis produces a multiplicative factor as a function of temperature described in the subsequent section. The next two sections describe the validation of the resulting high temperature model against several major creep datasets in the literature.
The interdisciplinary nature of this effort presents some inherent difficulties but an effort has been made to provide a certain minimum level of background information where appropriate.
Constitutive model summary and implications
The constitutive model developed in Cole (Reference Cole1995, Reference Cole2004) and Cole and Durell (Reference Cole and Durell1999, Reference Cole and Durell2001) has elastic, anelastic (viscoelastic) and viscous components of strain. It quantifies two mechanisms of anelasticity (dislocation and grain boundary relaxations), and viscous straining occurs by the irrecoverable motion of basal dislocations. The dislocation-based component of anelasticity and the viscous strain component were formulated using the basal dislocation drag-controlled mechanism, inspired by the work of Weertman (Reference Weertman1963). The underlying principle of that mechanism is that basal dislocation velocity (and hence the creep rate due to dislocations) is controlled by the drag associated with proton ordering in the stress field of the dislocations. The fundamental dislocation configuration is that of basal plane pileups against grain boundaries. As such, its application in its present form includes the regime of flow with no or very limited microcracking and pressures below the 20 MPa threshold for a likely shift to a climb-controlled deformation mechanism (Jones and Chew, Reference Jones and Chew1983). Additionally, while non-basal dislocation processes are of interest in ice deformation (Chauve and others, Reference Chauve2017), they are not addressed in the present effort.
The model quantitatively links the dislocation density to the hysteresis observed during cyclic tension/compression experiments. Consequently, it provides a way to determine the effective dislocation density of a specimen based on knowledge of its fabric and its cyclic loading response. This approach has been used to determine the effective dislocation density prior to creep straining and it has been applied intermittently during a staged creep test to track the evolution of the dislocation density as a function of stress, strain and temperature (Cole and Durell, Reference Cole and Durell1999, Reference Cole and Durell2001).
The above-mentioned anelastic component of strain is time-dependent but recoverable and as such, gives rise to a relaxation process that can be quantified with the cyclic loading method. The reader is referred to Nowick and Berry (Reference Nowick and Berry1972) for a thorough explanation of dislocation relaxation processes. Such processes are characterized in part by a strength δDd which, as described in Cole (Reference Cole1995), is related to the dislocation density ρ as follows:

Here, Ω is an orientation factor that determines the average resolved shear stress on the basal planes from the background normal stress (Ω = 0.32 for randomly oriented grains), b is the Burgers vector (4.52 × 10⁻¹⁰ m) and K is the experimentally determined restoring stress constant (K = 0.07 Pa for polycrystalline ice) and is evaluated from the location of the relaxation peak at a given temperature (Cole, Reference Cole1995). b and K are thus fixed quantities and the orientation factor Ω is calculated with the knowledge of the crystallographic orientation of the grains and the direction of the applied stress (Table A1). The dislocation density can be determined using Eqn (1) once δDd (which controls the maximum amount of anelastic strain that can be achieved by a given mobile dislocation density) is established from the cyclic loading response.
The viscous strain rate is (Cole and Durell, Reference Cole and Durell2001):

Here, B 0 = 1.205 × 10⁻⁹ Pa s is the pre-exponential term in the dislocation drag expression (Cole, Reference Cole1995). σ is the background normal creep stress in Pa. β = 0.3 is a numerical constant based on laboratory experiments. Q glide is the activation energy for basal glide (8.8120 × 10⁻²⁰ J or 0.55 eV) which is the rate controlling mechanism for viscous straining in the model. T is the temperature in Kelvin. k is Boltzmann's constant. For Q glide in J and T in Kelvin, k = 1.38062 × 10⁻²³ J K−1. As detailed in Cole and Durell (Reference Cole and Durell2001), the dislocation density that evolves during creep straining is a function of the stress level, temperature and strain (Cole and Durell, Reference Cole and Durell1999):

where

Here, ɛ i is the creep strain, ɛ 0 is the strain associated with the inflection point in Eqn (4), evident when plotted logarithmically. ρ 0 is the initial dislocation density and σ creep is the background normal creep stress. E(T) is the temperature-dependent elastic modulus (Cole, Reference Cole1998). For saline ice, f 0 = 4 × 1025 m−2, Q ρ = 7.2098 × 10⁻²⁰ J (or 0.45 eV) and ɛ 0 = 5 × 10⁻³. Equation (3) was derived from experiments on laboratory-prepared saline ice over a temperature range of −5 to −20°C, for uniaxial compression stresses in the range of 0.29–2.49 MPa and salinity ranging from 3.7 to 8.1 ppt. The model adequately reflects the behavior of naturally occurring sea ice over those ranges (Cole and Durell, Reference Cole and Durell2001). Additionally, that work illustrated a temperature dependence of the dislocation production process similar to observations in materials other than ice (see Table A2).
The above model applies to ice Ih in general, given due consideration to the microstructure and whether the subject ice is saline or fresh water. Growth history, ice type and, as demonstrated in the present work, the prevailing temperature, govern the initial dislocation density (ρ 0) in previously unstrained ice. The above-cited work arrives at reasonably consistent average values of ρ 0 for fresh water (3 × 10⁸ m−2) and sea ice (7.8 × 10⁸ m−2 for salinity = 5.0 ppt). Cole (Reference Cole2001) reported that ρ 0 can vary by one to two orders of magnitude for laboratory-prepared single crystals.
The basic stress and strain dependencies of the model satisfactorily simulate granular freshwater ice as demonstrated in a number of studies (Cole and Durell, Reference Cole and Durell2001; Cole, Reference Cole2003, Reference Cole2004; Song and others, Reference Song, Cole and Baker2006a, Reference Song, Cole and Baker2006b, Reference Song, Baker and Cole2008), given attention to the value of ρ 0. On the basis of the present effort, however, values of f 0 = 3 × 10²¹ m−2 and Q ρ = 4.0054 × 10⁻²⁰ J (or 0.25 eV) in Eqn (3) were found for granular freshwater ice vs the above noted values for saline ice. As noted in the section ‘Comments on future work’, it would be desirable to conduct targeted experiments to further validate these values.
When simulating the constitutive behavior of material that has undergone prior loading, the value of ρ 0 would reflect the associated increases in dislocation density. Experimentation and analysis (e.g. Cole and Durell, Reference Cole and Durell2001) made it clear that the population of dislocations produced during deformation are added to the population of grown-in or otherwise preexisting dislocations, hence the form of Eqn (3). In a related matter, although it would be possible to conduct cyclic experiments under conditions that would produce dislocations, that has not been done in the body of work related to the present model development. In fact, care was taken to demonstrate (see Cole and Durell, Reference Cole and Durell1995) that the cyclic loading conditions employed did not alter the dislocation density. As a consequence, Eqns (3 and 4) apply only to the case of constant load creep.
The model derives its overall stress dependence from the product of the linear stress dependence in Eqn (2) and the second power dependence in Eqn (3). As a consequence, the net stress dependence of the creep rate can vary from linear to the third power depending on the relative numbers of initial and stress-induced dislocations. This feature of the model accounts for the fall-off from n = 3 behavior that is sometimes seen in laboratory experiments at lower stress levels and inferred from large-scale ice flow analyses (Pettit and Waddington, Reference Pettit and Waddington2003; Pettit and others, Reference Pettit2011). It is likely that variations in specimen preparation methods and time–temperature histories result in a significant range in initial dislocation density for laboratory-prepared specimens, which determines the stress level below which n < 3 behavior is observed. Model parameter values for freshwater and sea ice are reported in the Appendix.
The above formulation of the model gives strains or strain rates as a function of physical properties, environmental conditions and stress, which lends itself to the analysis of load-controlled experiments. On the other hand, Heijkoop (Reference Heijkoop2017) and Heijkoop and others (Reference Heijkoop, Nord and Høyland2018) demonstrated that the model can simulate strain-controlled experiments on saline ice quite well using an incremental formulation. That approach numerically determines stress relaxation due to the model's anelastic and creep processes in response to a series of applied strain increments.
To put the overall behavior of the model as a function of strain in perspective, Eqn (2) produces the strain rate minimum (which typically occurs at an axial strain of ≈0.01) once the dislocation density has stabilized and provided that the initial fabric remains constant. When the anelastic strain terms given in Cole (Reference Cole1995) are added to the above viscous strain, the result is the decelerating strain rate generally observed in the primary stage of creep. At low strains (typically below ≈0.002) and for specimens with low initial dislocation density, the creep rate can actually increase slightly before decreasing to the minimum value as a consequence of dislocation production. Such behavior is clearly evident in the creep experiments reported by Mellor and Cole (Reference Mellor and Cole1982, see their Fig. 9). Straining beyond the creep rate minimum at 0.01 strain typically produces fabric development and an associated increase in strain rate into the tertiary creep regime. However, the present model adequately captures tertiary creep behavior through the orientation factor Ω, which increases in value as the crystallographic alignment strengthens. Thus, the creep rate produced by the model between the creep rate minimum and the tertiary stage increases in proportion to the higher resolved shear stress on the basal planes, multiplied by the associated increase in the dislocation density. Although of great interest, this matter is not addressed in the present effort.
High-temperature effects on crystalline materials
Dislocation background and the use of cyclic loading and creep experiments
Experiments on metals, ceramics and naturally occurring mineral crystals frequently exhibit an increase in internal friction due to dislocations at high temperatures (Schoeck and others, Reference Schoeck, Bisogni and Shyne1964; Gadaud and others, Reference Gadaud, Woirgard, Mazot, Demenet and De Fouquet1987; Pezzotti and Ota, Reference Pezzotti and Ota1997; Castillo-Rodríguez and others, Reference Castillo-Rodríguez, Nó, Jiménez, Ruano and San Juan2016). This phenomenon is referred to as high temperature background: it increases with temperature and lacks identifying relaxation peaks. It becomes evident in metallic materials beginning at T/T M above ≈0.5–0.6. Ice, remarkably, begins to exhibit high temperature behavior above T/T M ≈ 0.97 (where T M is the melting temperature).
Gadaud and others (Reference Gadaud, Woirgard, Mazot, Demenet and De Fouquet1987) isolated an internal friction peak due to dislocations from the high temperature background in silicon single crystals and demonstrated that the peak amplitude (which varies linearly with the dislocation density) increased with temperature. Lakki and Schaller (Reference Lakki and Schaller1996) found similar behavior in internal friction and creep experiments on three fine-grained ceramic materials. The latter work found a direct correlation between the increased magnitude of internal friction with temperature and the increase in creep rate with temperature. In a study of metallic materials at high temperatures, Castillo-Rodríguez and others (Reference Castillo-Rodríguez, Nó, Jiménez, Ruano and San Juan2016) used a combination of cyclic loading and creep experiments to show that both types of experiments give evidence of a common dislocation-based deformation mechanism and that the kinetics determined from the cyclic loading experiments agree closely with the kinetics observed in the creep experiments. Thus, despite the variations in the structure of the above materials, there is a consistent trend in the dislocation mechanics underlying high temperature behavior in a variety of crystalline materials.
In other work, Farla and others (Reference Farla, Jackson, Fitz Gerald, Faul and Zimmerman2012) conducted high-temperature (e.g. T/T M ≈ 0.83–0.92) mechanical experiments on olivine and found that the high temperature dislocation background prior to straining, as well as the rate of dislocation production, increased markedly with proximity to the melting point. Similarly, Patterson and others (Reference Patterson2016) found that dislocation densities produced during the deformation of single-crystal strontium titanate (SrTiO3) increased substantially with temperature. Other efforts (e.g. Ryu and others, Reference Ryu, Kang and Cai2011) take an atomistic approach to the modeling of dislocation processes, with the consideration of temperature effects on dislocation nucleation rates as a function of applied stress. These findings are in line with observations on ice, where the temperature dependence of the dislocation production process is captured through the activation energy Q ρ in Eqn (3).
Thermally induced dislocations vs increasing activation energy
As noted above, the goal is to establish whether high temperature effects are due to increases in the dislocation density or the activation energy of the dislocation glide process. The following example demonstrates how these two alternative explanations would be manifest in experimental results. Fundamental to the following calculations is the concept of time–temperature superposition. When examined as a function of frequency at a specific temperature, a temperature-dependent relaxation process of the type found in ice exhibits a relaxation peak centered at a specific frequency. The value of that frequency depends on temperature. Typically, the central frequency of the relaxation peak shifts to higher values when the temperature increases, and the magnitude of that shift depends on the activation energy. Analogous behavior ensues if the temperature of the experiments is varied while the frequency is held constant. This phenomenon provides a way to use cyclic data to shed light on the activation energy and address the question of whether or to what extent it changes over specific temperature ranges.
Example calculations
The calculations employ the loss compliance (hysteresis loop width/peak cyclic stress, which is a measure of the dislocation contribution to straining) as a function of frequency and temperature under conditions that are dominated by dislocation relaxation. As per Cole (Reference Cole1995), the loss compliance is a linear function of the dislocation density and can be calculated directly from experimental results for a given frequency, stress level and temperature. Moreover, it is a useful quantity to examine the underlying cause of the subject high temperature effects. Figure 1 illustrates three cases of the cyclic loading response as temperature increases: (1) no change in either dislocation density or activation energy (Fig. 1a), (2) the dislocation density increases by 20% for each temperature increment but the activation energy remains constant (Fig. 1b) and (3) the dislocation density remains constant but the activation energy increases by a factor of 2 per temperature increment (Fig. 1c). The temperatures indicated in Figure 1 correspond to experimental results presented below. The values in Figure 1 were calculated from stress–strain curves generated by the present dislocation-based model. The temperature effect in Figure 1a is that of basal dislocation glide and thus reflects actual behavior. The increases in dislocation density and activation energy reflected in Figures 1b, c are somewhat arbitrary but not unrealistic, and were selected for the purposes of demonstration.
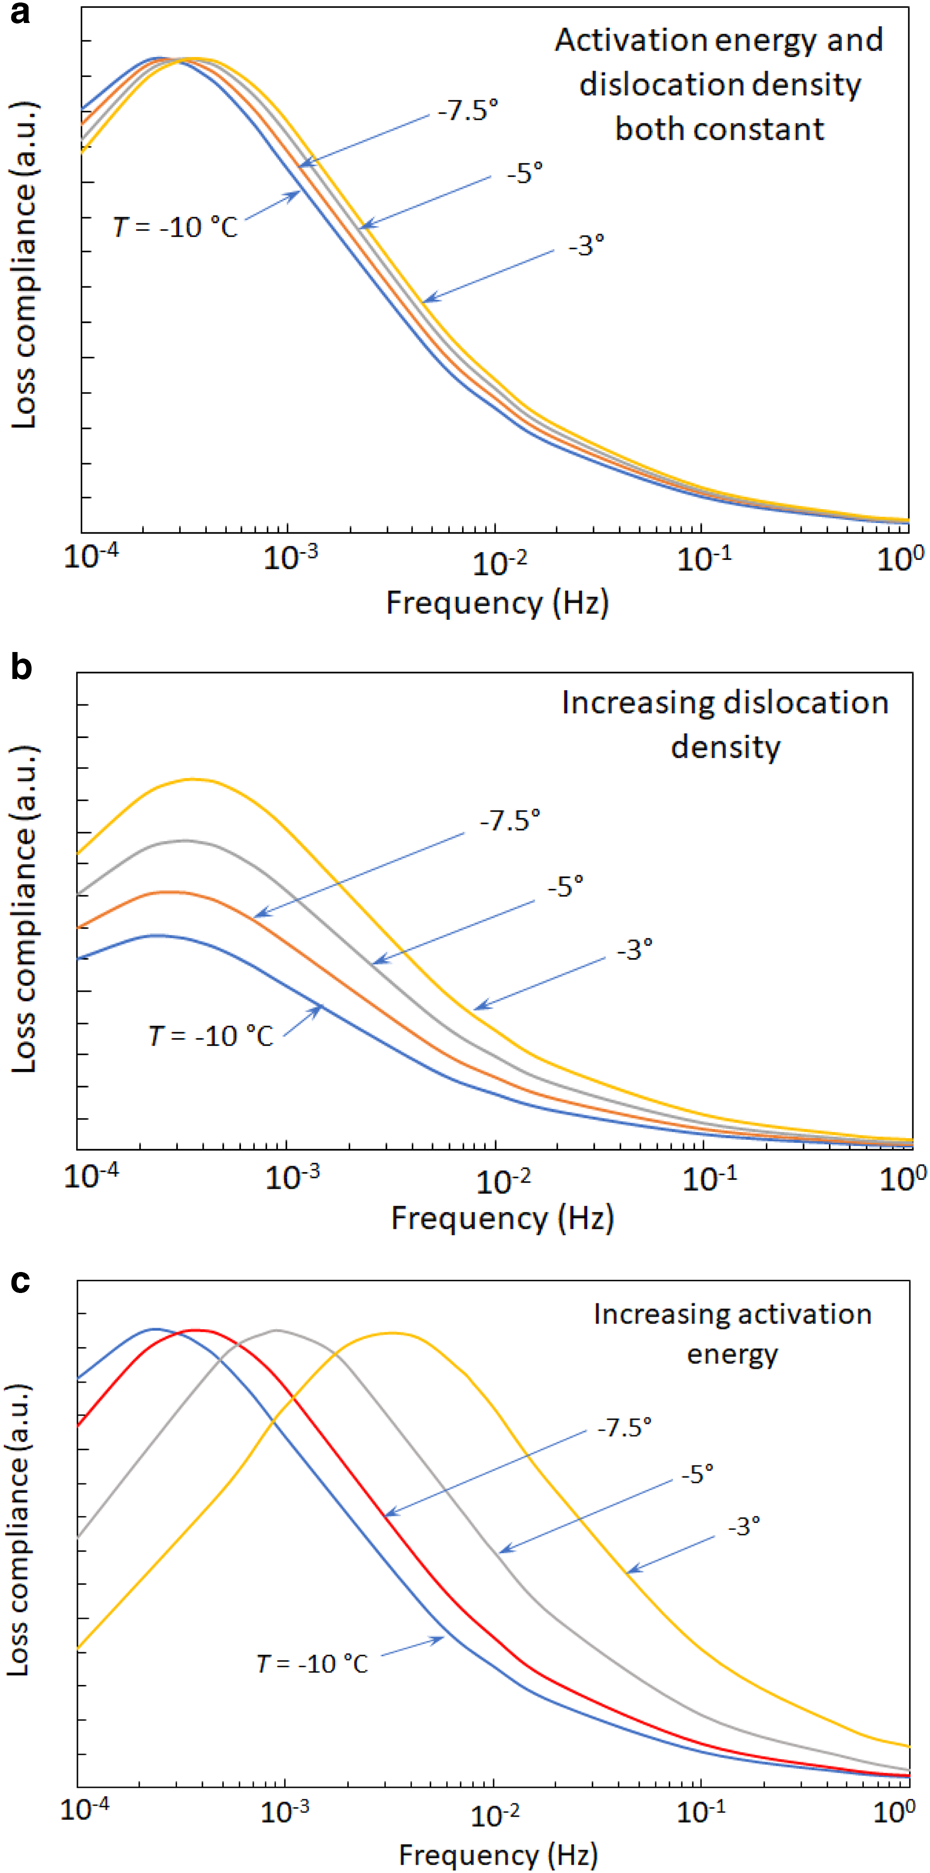
Fig. 1. Illustration of the effects of dislocation density and activation energy on the loss compliance. (a) Activation energy and dislocation density are constant for all temperatures. (b) Dislocation density increases by 20% for each temperature increase and activation energy is constant. (c) Dislocation density is constant and activation energy increases by a factor of 2 for each temperature increase. Loss compliance is given in arbitrary units (a.u.) for the purposes of demonstration.
The indicated temperature changes in Figure 1a cause small shifts of the loss compliance curve to higher frequencies as temperature increases, commensurate with the activation energy for dislocation glide. Such shifts are one way to assess the activation energy using frequency domain data. Note that with a constant dislocation density, the amplitude of the loss compliance peaks remains constant as temperature increases. When the dislocation density increases with temperature but the activation energy remains constant, the amplitude of the loss compliance curves increases with temperature as evident in Figure 1b. These peaks also shift slightly to the right as shown in Figure 1a. Markedly different behavior results when the dislocation density remains constant but the activation energy increases as seen in Figure 1c. The increasing activation energy results in progressively greater shifts to higher frequencies of the loss compliance curves as temperature increases while their amplitudes remain constant.
Experimental observations on several ice types
The Appendix includes a description of the experimental methodology for the quasistatic experiments reported below. The anelastic strain model of Cole (Reference Cole1995) provided the means to calculate an effective dislocation density based on the area (or width) of the hysteresis loops observed under cyclic loading. The reported values of the dislocation density were obtained by averaging the values obtained from the specimen's response to several stress levels at a given frequency and temperature.
As noted above, the lack of an adequate number of experimental results on any one type of ice necessitates an analysis of a combination of saline and freshwater polycrystalline ice and an ice single crystal. Table 1 lists these specimens and notes the type of ice, origin of the specimen and test temperatures. Limited results for certain specimens have appeared in earlier papers as indicated in the table, but results for temperatures above −10°C appear here for the first time. Because of the nature of the supporting projects, a number of the higher temperature experiments were conducted on cores of first-year sea ice. As seen in the table, the analysis includes results on laboratory-prepared polycrystalline freshwater ice and an oriented single crystal.
Table 1. Specimens employed in the analysis

Figure 2a shows loss compliance vs frequency for the oriented single crystal (with c-axis forming a 50° angle with the stress axis) of freshwater ice. Figure 2b shows a similar plot for granular freshwater ice and Figure 2c plots data from a horizontal field core of first-year congelation sea ice.
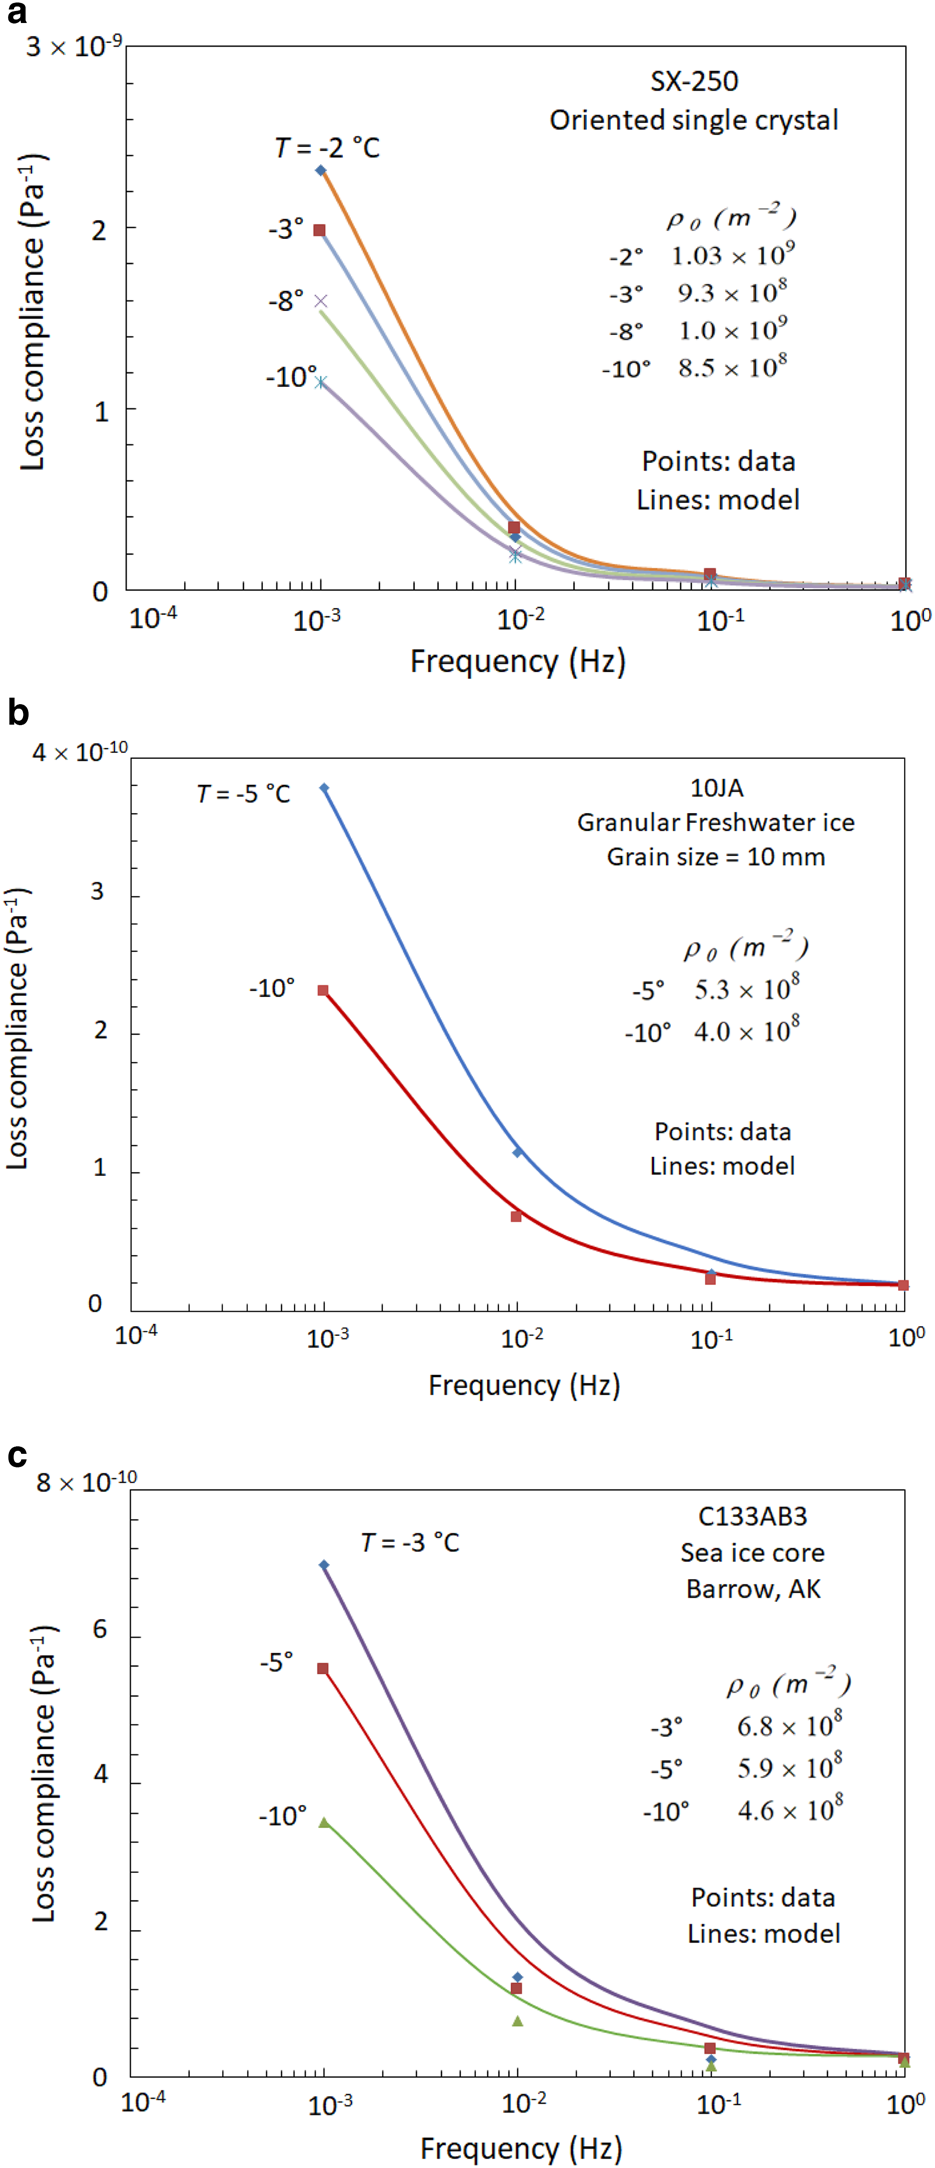
Fig. 2. Loss compliance vs frequency for temperatures and ice types as indicated. All data (points) were obtained using the uniaxial, zero-mean-stress cyclic loading method and the lines were generated by the model as discussed in the text. (a) Single crystal of freshwater ice, (b) laboratory-prepared granular freshwater ice and (c) a core of first-year sea ice. The sea-ice core had a preferred c-axis direction and was oriented to maximize the basal plane shear stress.
The lines in Figure 2 were calculated using the present dislocation-based model and use the mobile dislocation density (ρ 0) that corresponding to the observed loss compliance at the 10−3 Hz frequency. Loss compliances at higher frequencies for each temperature were then calculated using the dislocation density thus determined. The table in each figure gives the values of ρ 0 for the test temperatures. These experiments did not extend to sufficiently low frequencies to capture the relaxation peak as seen in the calculated values in Figure 1. What is clearly evident, however, is that the model output (lines), which is based on a constant activation energy and a mobile dislocation density that increases with temperature captures the basic trends in these data with regard to both amplitude and frequency reasonably well. The alternative explanation for the observed high temperature behavior (e.g. increasing activation energy near the melting point) can be tested by applying a frequency shift to the data points and observing whether the shifted points lie along a master curve, making some allowance for experimental scatter, or diverge. This approach was successfully applied in Cole (Reference Cole1995) to show that the anelastic straining due to dislocations in saline ice exhibited a constant activation energy for −50 ≤ T ≤ −10°C. That analysis showed that the dislocation density of any given specimen was relatively constant over the stated temperature range and the curves for all temperatures converged on a −10°C master curve when shifted. This operation is performed by selecting, in this case, a value of the loss compliance that is within the range of data for each temperature and then shifting all the points for that temperature such that the reference point falls on the master curve (−10°C). If there is no change in the magnitude of the loss compliance as a function of temperature, the shifted curves should all fall along the master curve.
Figure 3 presents typical results of the frequency shift operations conducted on the indicated specimens. It is evident that the shifted curves generally diverge from each other over the 10−2 to 10−3 Hz order of magnitude where the dislocation contribution becomes very large. The single crystal of freshwater ice in Figure 3a, for which the individual curves were shifted to lie on the −10°C master curve at 10−2 Hz, shows a particularly strong divergence at the lower frequencies. The sea-ice specimen in Figures 3b, c fared slightly better in that the lower temperatures tended to fall reasonably well along the master curve but the warmest temperature deviated substantially. These results were typical of the available quasistatic cyclic loading data. Consequently, the inability of the frequency shifted data to fall on a master curve indicates that the high temperature behavior is not due to a simple increase in activation energy near the melting point.
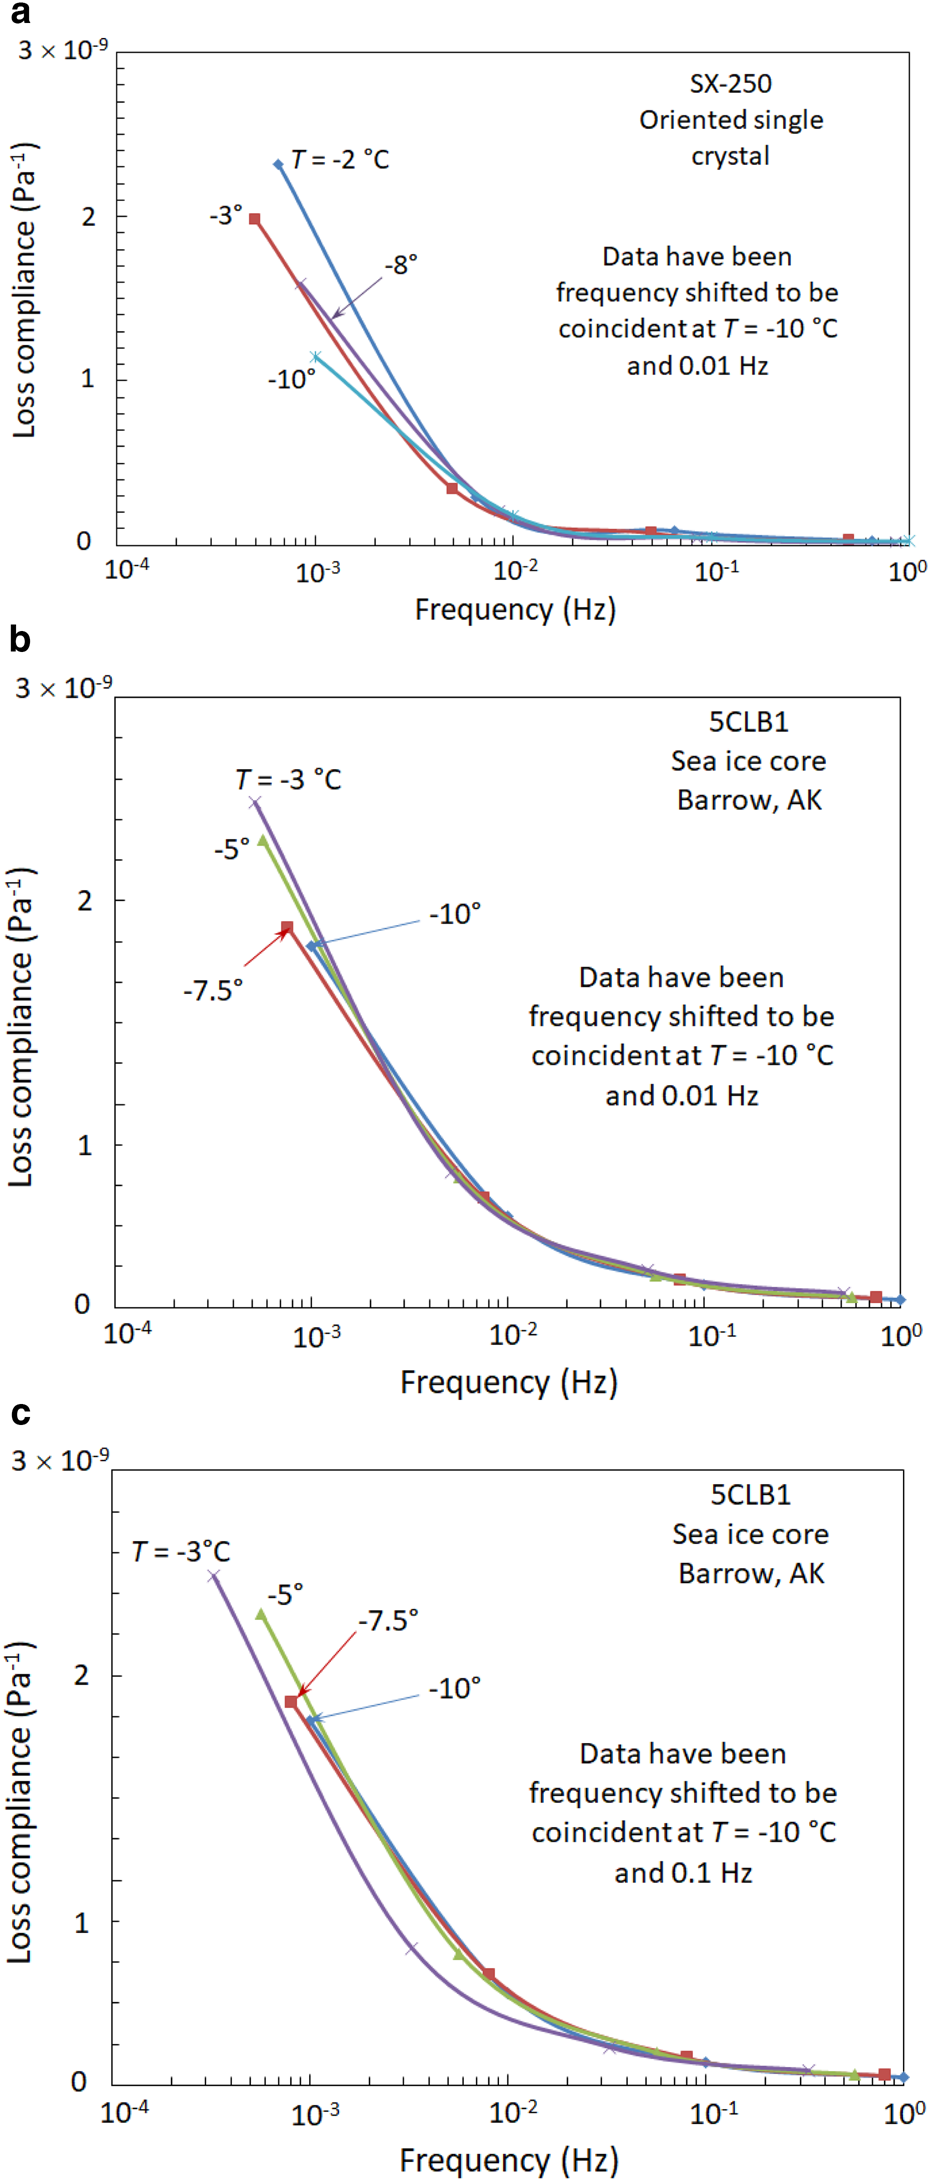
Fig. 3. Examples of the frequency shift analysis conducted on (a) an oriented single crystal of freshwater ice, (b) a sea-ice core shifted to be coincident at 10−1 Hz and −10°C and (c) data as in (b) but shifted to be coincident at 10−2 Hz and −10°C.
To summarize this section, although the relevant experimental data are limited, the analysis indicates that a model that (1) allows the dislocation density to increase with proximity to the melting point and (2) has a constant activation energy adequately captures the quasistatic loading response of several ice types. Dislocation density variations explain the observed amplitude effects and a constant activation energy explains the temperature-dependent frequency shifts. As for the alternative of attributing high temperature effects to an increase in activation energy, this analysis indicates that when a frequency shift was applied to the experimental loss compliance data, they did not convincingly converge to a master curve, which argues against that explanation for the high temperature behavior of ice.
Although more extensive experimental results are certainly called for to solidify the observed trends, the analysis presented below is based on the reasonable indications that high temperature effects are caused by temperature dependent increases in the mobile dislocation density. The following sections analyze available high temperature experimental results from which the mobile dislocation density can be either calculated or deduced with the goal of developing a relationship between what is hereafter termed the thermally induced dislocation density and temperature. The resulting relationship is incorporated into an existing dislocation-based constitutive model and validated with several major sets of creep data in the literature.
Quantifying the thermally induced dislocation density
The ideal dataset for quantifying dislocation density as a function of temperature would be a consistent set of cyclic loading experiments, conducted on granular ice specimens at closely spaced temperature intervals between −8 and −0.01°C. Such data would support the needed dislocation density calculations. Unfortunately, such data do not exist so it is necessary to resort to a synthesis of existing quasistatic and dynamic cyclic experimental results which, when combined, cover the desired temperature range. The following two subsections analyze the results of quasistatic cyclic loading experiments on several ice types and the results of dynamic experiments on single crystals, respectively. Although it would be preferable if these data were all for one ice type, it is noteworthy that once normalized, the dislocation density–temperature relationship for fresh water, saline and single crystals all display a reasonably consistent trend.
Quasistatic experiments
The dislocation densities determined in the quasistatic experiments as a function of temperature have been normalized to the value observed at −8°C, with the resulting dimensionless number being named the dislocation density factor (f ρ). Figure 4 shows examples of the dislocation density factor vs temperature determined for sea-ice cores and laboratory-prepared freshwater specimens. The data in Figure 4 are scattered but the general trend for an increase with temperature is evident statistically.

Fig. 4. Dislocation density factor determined from the cyclic loading response of freshwater and sea-ice specimens.
These results show that the dislocation density increases modestly over the indicated temperatures for all three ice types. Although the initial dislocation densities vary, there is a thermally induced increase relative to the initial value in all cases. As noted above, the maximum temperatures and temperature intervals are less than ideal but they do provide quantitative information up to the lower limit of temperature employed in the dynamic experiments considered in the following section.
Dynamic experiments
Hiki and Tamura (Reference Hiki and Tamura1983) used an ultrasonic method to estimate the dislocation density in pure ice single crystals grown by methods that produced relatively high or low dislocation densities as shown in Figure 5a. These experiments showed fluctuations in the dislocation density up to the range of −0.1 to −0.2°C, but these fluctuations are overwhelmed by the observed increase by factors of 7.3 and 5.0 for the high and low dislocation density specimens, respectively, observed at higher temperatures. These increases are conservative estimates based on the highest reported values near melting, but indications in the original paper (as per the upward pointing arrows reproduced in Fig. 5) suggest that higher but unspecified values were observed.
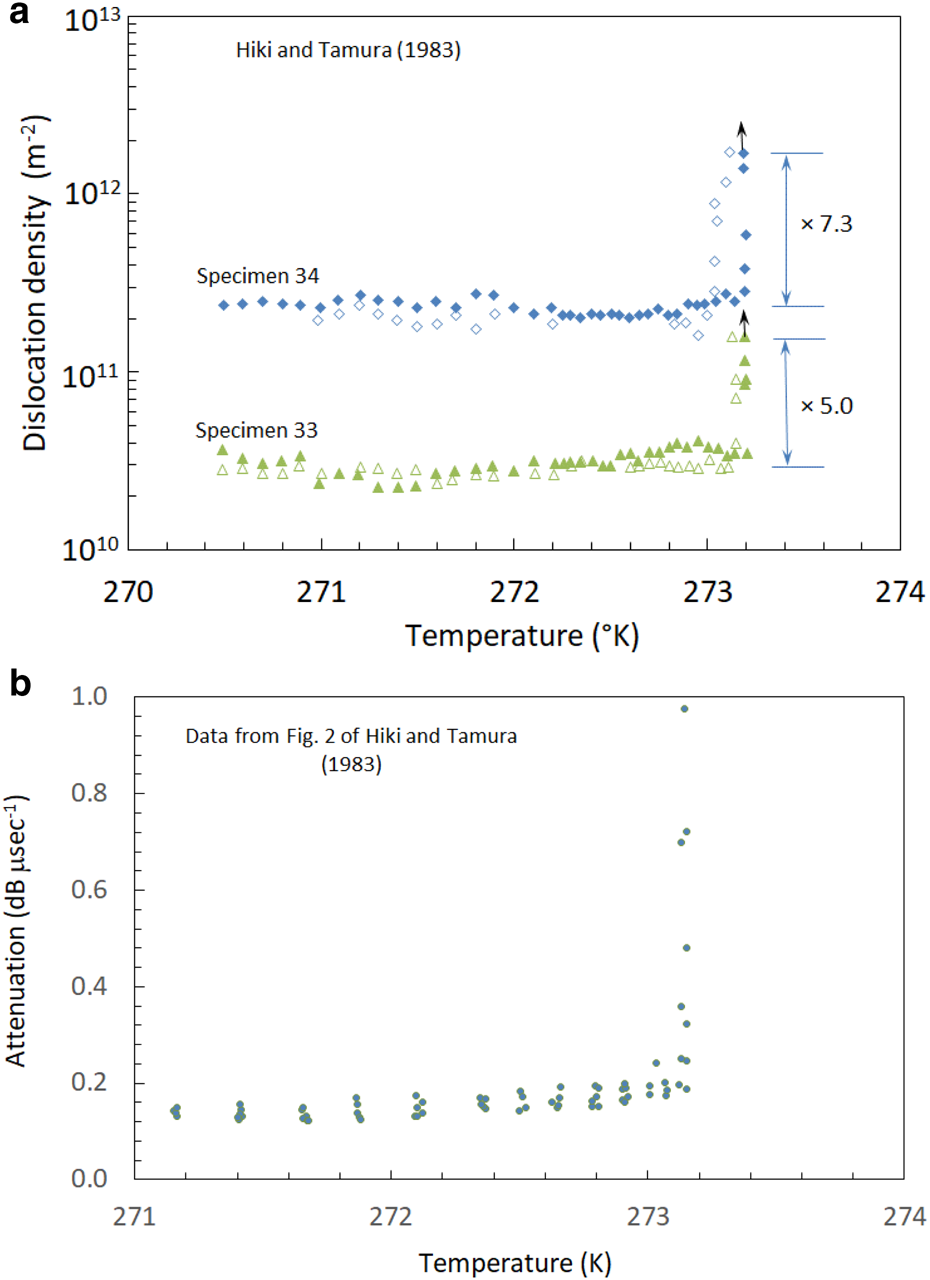
Fig. 5. Results of the dynamic experiments reported by Hiki and Tamura (Reference Hiki and Tamura1983). (a) Values of dislocation density vs temperature from two specimens with dissimilar initial dislocation densities, digitized from their Figure 9 and (b) digitized values of attenuation vs temperature for three warming/cooling cycles conducted on a single specimen, from their Figure 2.
Hiki and Tamura (Reference Hiki and Tamura1983) also presented attenuation data (their Fig. 2) from a single specimen subjected to three warming/cooling cycles. The combined results of these three cycles are plotted in Figure 5b. They show the same overall behavior as the other specimens, but lower scatter due to the use of a single specimen makes the subtleties of the temperature dependence of the attenuation (which varies linearly with the dislocation density) more clear. These data show a gradual increase in dislocation density leading up to the abrupt increase very close to T M. Significantly, this gradual trend for T < −0.5°C is close to the temperature dependence of the dislocation density found for the quasistatic experiments.
Two observations in particular provide support for the present modeling effort: (1) the temperature range over which the dislocation density increased by factors of 5.0 and 7.3 in the dynamic experiments corresponds well to the range over which Glen (Reference Glen1955) and Morgan (Reference Morgan1991) observed nearly an order of magnitude increase in creep rate, and (2) similar to the quasistatic behavior, the increase in dislocation density in dynamic experiments scale relative to the initial value.
The magnitude of the calculated dislocation densities from Hiki and Tamura (Reference Hiki and Tamura1983) deserve mention since they are higher than the typical values in the 108 m−2 order of magnitude determined from the quasistatic experiments as noted in the above model summary section. The ultrasonic pulse-echo method they employed involved low amplitude vibrations applied to oriented single crystals. It is possible that dislocations which contribute to the dynamic measurements would not be sufficiently mobile to contribute to the quasistatic response due to pinning or other restrictions on their motion. It would be preferable to have quasistatic cyclic data along with creep data over the temperature range of these dynamic experiments. Additionally, there is precedent for relating dynamic and quasistatic observations of dislocation behavior in crystalline solids (Gremaud and Bujard, Reference Gremaud and Bujard1985; Vincent and others, Reference Vincent, Djeroud and Fougeres1987).
Dislocation density factor (f ρ)
Although thermally induced increases in dislocation density at high temperatures is a recognized phenomenon as discussed in the section ‘High-temperature effects on crystalline materials’, a physics-based relationship between the dislocation density and temperature has not been developed. Moreover, absent experimental observations to support a serious exploration of the specific physical mechanism(s) responsible for the observed increase in dislocation density with temperature, the following analysis adopts an empirical approach to this relationship. Recognizing the limited data available as of this writing, the relationships developed here should be reexamined in the future as additional experimental results and theoretical advancements become available.
Hiki (Reference Suzuki, Ninomiya, Sumino and Takeuchi1985) reported high temperature increases in dislocation density for several crystalline substances in addition to ice. An empirical relationship was presented that scales the dislocation density with a term that involves (1 − T/T M)−1 where T is the temperature of interest and T M is the melting point. Although convenient and simple, there are two problems with such a function: it does not adequately represent the gradual increase we see for ice over −8 ≤ T ≤ −0.5°C and it has a singularity at T M. The latter issue is problematic since ice can exist in solid form at T M. Consequently, the present effort adopts an alternative approach for the relationship between dislocation density and temperature that involves three linear segments. Although somewhat awkward, this approach adequately reflects the experimental observations and has a finite value (albeit one that is subject to reassessment pending further experimental results) at T = T M.
Given the piece-wise linear appearance of the creep behavior, the data were analyzed in the ranges of −8 ≤ T ≤ −0.5°C, −0.5 ≤ T ≤ −0.05°C and −0.05 ≤ T≤ −0.01°C. The equations for each of these segments appear in Figure 6. These relationships have been formulated to produce coincident values at the breakpoint temperatures and vary slightly from true best-fit equations for each segment.

Fig. 6. Dislocation density factor vs temperature employing quasistatic cyclic loading and dynamic experimental results as indicated. This relationship has been quantified as three piece-wise linear segments for reasons discussed in the text.
The simplest way to incorporate the subject temperature effects into the constitutive model is to employ the dislocation density factor (f ρ), described above. The dynamic data (e.g. Fig. 5) extended from near melting to ≈−2.5°C and the quasistatic data extended to a high temperature of −2°C, so there is some overlap between the two sets. As noted above, the quasistatic data in the range of −8 to −2°C and the dynamic data in the range of −2.5 to −0.5°C exhibit a relatively weak dependence of f ρ on T (exhibiting slopes of 0.048 and 0.25, respectively), so the equation for that range is based on data from both sets. The dynamic values of f ρ have been shifted up by a factor of 1.43 to put them in registry with the quasistatic values.
Defining ρ HT as the dislocation density applicable for T > −8°C, its value is simply the dislocation density determined by Eqn (2) multiplied by the appropriate value of f ρ from Figure 6:

Before validating the model against several creep datasets in the literature, it is informative to (1) assess published high temperature creep datasets for consistency and (2) compare values of the dislocation density factor inferred from creep experiments with those determined directly from the dynamic experiments.
Data considerations for the creep of granular freshwater ice
Reviews of the ice creep literature have been conducted periodically (e.g. Weertman, Reference Weertman, Whalley, Jones and Gold1973, Reference Weertman1983; Budd and Jacka, Reference Budd and Jacka1989; Marshall, Reference Marshall2005; Duval and others, Reference Duval2010) and key datasets are well known. Where tabulated values of minimum strain rate vs stress were not available for the following analysis, published figures were digitized. The latter values are subject to an estimated ±3% digitization error.
In the following sections on uniaxial compression experiments, stress and strain rate are reported as uniaxial compressive quantities. Values originally reported as octahedral quantities have been converted to uniaxial values using the relationships given in the Appendix of Treverrow and others (Reference Treverrow, Budd, Jacka and Warner2012).
High temperature creep observations
Figure 7 plots normalized minimum creep rates as a function of 1/T K (where T K is temperature in Kelvin) from the indicated sources in the literature and serves to illustrate the variability in such observations. To facilitate this comparison, the creep rates have been normalized to the value observed at T = −5°C when possible. Where experiments were not conducted at that temperature, values for the next lower temperature were used. Despite the scatter, these datasets demonstrate a reasonably consistent trend for greater temperature sensitivity with proximity to T M. Given the inherent difficulties in conducting experiments close to the melting point, it is noteworthy that the normalized data of Glen (Reference Glen1955) over this temperature range coincide quite closely with those of Morgan (Reference Morgan1991). The latter dataset involved a single uniaxial compressive creep stress of 0.212 MPa applied at closely spaced temperature intervals over the range of T = −5 to −0.01°C.

Fig. 7. Normalized minimum creep rates at high temperatures from sources as indicated. Values have been normalized to the creep rate observed at T = −5°C or somewhat lower in the case of Mellor and Testa (Reference Mellor and Testa1969).
It is interesting that the normalized results of Mellor and Testa (Reference Mellor and Testa1969) roughly follow the temperature sensitivity seen in the other datasets despite the fact that their actual strain rates are substantially higher than observed by others.
Dislocation density factors inferred from creep experiments
It is possible to quantify the dislocation density factor as a function of temperature for the minimum creep rates by dividing the experimentally observed strain rate at each temperature by the corresponding value calculated from Eqn (2) as indicated by the short vertical lines in Figure 8a. Thus, the baseline strain rates reflect the rather complex temperature dependence of the strain rate extrapolated through the high temperature regime. The differences between those values and the experimentally observed rates from Morgan (Reference Morgan1991) provide a way to quantify the dislocation density factor from quasistatic experiments. The results of this exercise are shown in Figure 8b, which plots the factor by which the strain rate increased as a function of temperature. There is a piece-wise linear character to the temperature dependence of the Morgan (Reference Morgan1991) data, with breakpoints at −0.5 and −0.05°C, which are in surprisingly good agreement with the results of Hiki and Tamura (Reference Hiki and Tamura1983) shown in Figure 5.

Fig. 8. Determination of dislocation density factor from creep and dynamic attenuation data. (a) Illustration of the method used to determine the dislocation density factor from minimum creep rate data. (b) Dislocation density factor inferred from the minimum creep rate data of Morgan (Reference Morgan1991).
Creep rates for T = −0.02 and −0.01°C
Glen (Reference Glen1955) and Colbeck and Evans (Reference Colbeck and Evans1973) conducted creep experiments at temperatures of −0.02 and −0.01°C, respectively. The stress levels in these two datasets overlap at ≈0.1 MPa. The strain rates at the common stress level agree, as seen in Figure 9. That plot includes a data point from Morgan (Reference Morgan1991) for T = −0.02°C, which falls in line with the other results. Colbeck and Evans (Reference Colbeck and Evans1973) noted an order of magnitude disagreement between their strain rates and values from a power law relationship based on Glen's (Reference Glen1955) results for T = −0.02°C. This disagreement apparently stems from the fact that the Colbeck and Evans analysis employed a power law with a fixed stress exponent to represent Glen's results, and data from the lowest stress levels in Glen's dataset were omitted in the calculation of the power law exponent. When all data from both sources are plotted together as in Figure 9, the omitted values actually transition quite well to the lower stress values and a systematic fall-off from power law behavior is clearly evident.
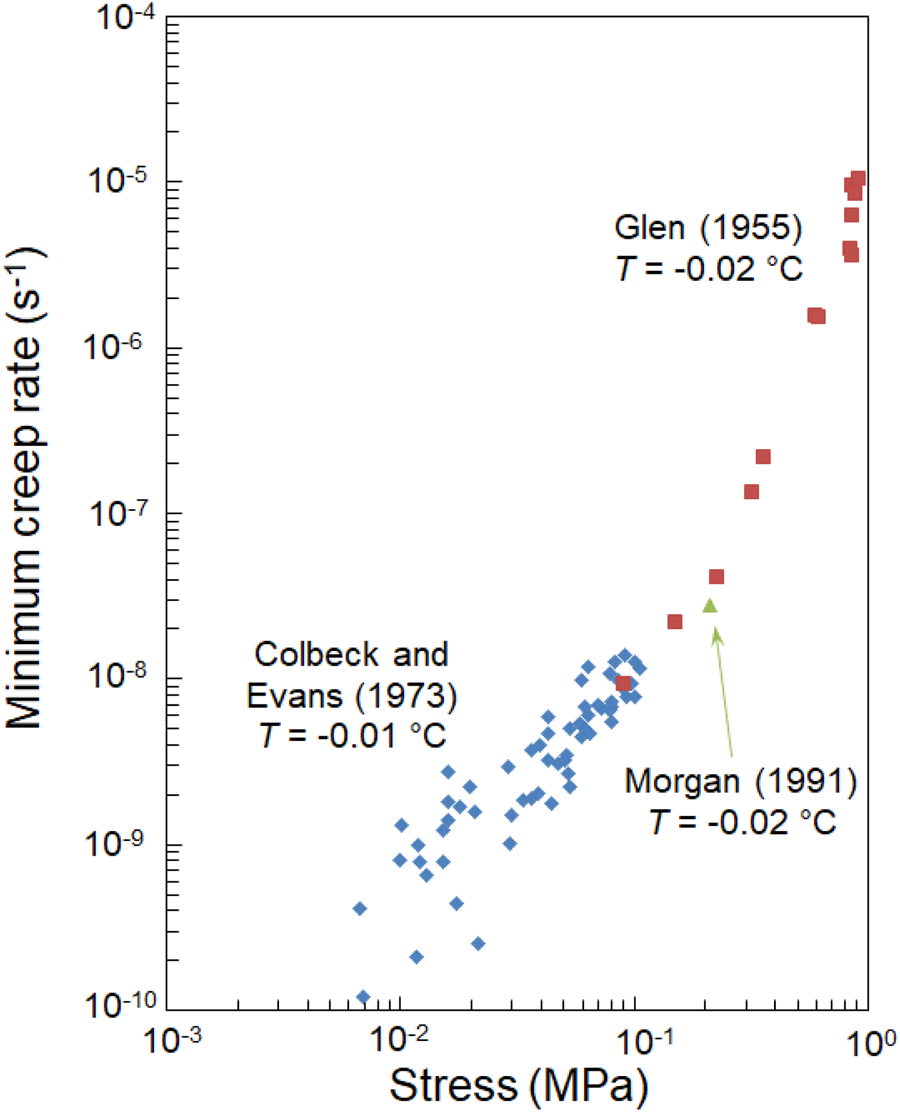
Fig. 9. Minimum creep rate vs stress for experiments conducted at −0.01 and −0.02°C from sources as indicated.
Variability and misinterpretation of creep and strength data in the literature
Creep datasets in the literature are not in full agreement with regard to temperature effects on the minimum creep rate–stress relationship. Although each dataset is internally consistent inasmuch as the minimum strain rate always increases with temperature, there are variations in the strain rates observed for a given temperature. For example, the strain rates from Jacka and Maccagnan (Reference Jacka and Maccagnan1984) for T = −10.8 and −17.8°C fall close to the data of Barnes and others (Reference Barnes, Tabor and Walker1971) for T = −14 and −22°C, respectively. Additionally, an examination of results from Jacka and Mccagnan (Reference Jacka and Maccagnan1984), Barnes and others (Reference Barnes, Tabor and Walker1971) and Steinemann (Reference Steinemann1958) for temperatures between −8 and −22°C revealed that the values for successively lower temperature do not fall in order. As seen in Figure 7, the minimum creep rates reported by Russell-Head and Budd (Reference Russell-Head and Budd1979) are substantially higher than the others at their warmest temperature. Since it is difficult to identify the source of these discrepancies, no attempt is made to rectify the model to the data of Jacka and Maccagnan (Reference Jacka and Maccagnan1984) and Russell-Head and Budd (Reference Russell-Head and Budd1979).
The observations of Jones and Brunet (Reference Jones and Brunet1978) have been cited in the context of high temperature ice behavior (e.g. Morgan, Reference Morgan1991). Jones and Brunet (Reference Jones and Brunet1978), however, examined yield behavior rather than minimum creep rate. They conducted constant strain rate uniaxial compression tests on ice single crystals close to the melting point and found no increase in temperature sensitivity as the melting point was approached. While yield stress is a valid metric, it is associated with the onset of massive dislocation production at relatively low strains. As such, it is not appropriate to associate the general lack of temperature dependence of the yield stress to creep behavior.
Model validation
Values of the model parameters appear in the Appendix. The only quantity that varies among the following calculations is the initial dislocation density. Those values were estimated on the basis of the observed strain rate–stress behavior at low stress levels. Since minimum creep rates for isotropic ice are considered, Ω = 0.32 for these calculations.
Among the more useful creep datasets in the early ice literature for model validation are Glen (Reference Glen1955), Steinemann (Reference Steinemann1958) and Barnes and others (Reference Barnes, Tabor and Walker1971) because they employed temperatures above −10°C and many stress levels below ≈1 MPa, where the influence of microcracking and hence power law breakdown is low or nonexistent. Ramsier's (Reference Ramseier1972) noteworthy results on columnar freshwater ice generally involved stress levels in the power law breakdown range and are thus not considered here.
Figure 10 plots minimum creep rate vs uniaxial compressive stress from tables in Glen (Reference Glen1955) along with values calculated with the present model. The agreement is very good for all but the highest stress levels for T = −0.02°C, which are believed to be influenced by power law breakdown.

Fig. 10. Minimum creep rate vs stress from Glen (Reference Glen1955) plotted with the model values.
The creep results from Steinemann (Reference Steinemann1958) were digitized from graphs and are plotted in Figure 11 along with the associated values calculated with the present model. The agreement here is generally good for T = −1.9 and −4.8°C but less so for T = −11.5 and −22°C. The data points for the intermediate stresses at T = −11.5°C fall somewhat below the model values and likewise for the lower two stress levels at −22°C.
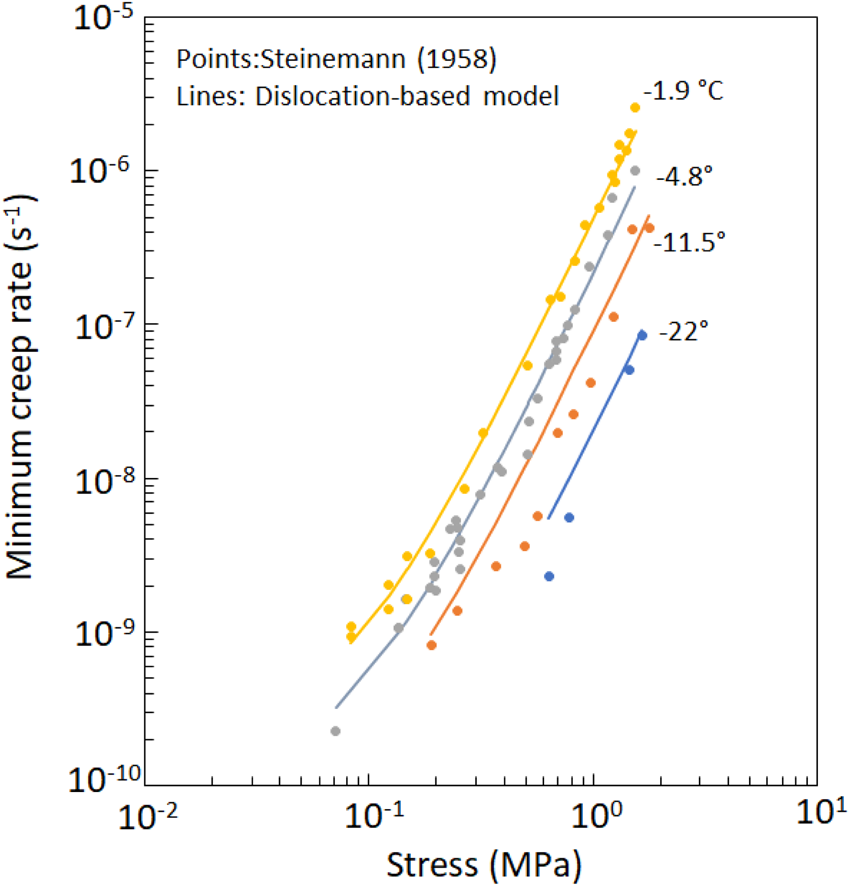
Fig. 11. Minimum creep rate vs stress from Steinemann (Reference Steinemann1958) with calculations from the present dislocation-based model.
Barnes and others (Reference Barnes, Tabor and Walker1971) presented an extensive set of uniaxial compressive creep experiments on granular freshwater ice which remains highly valued to this day. Since tabulated data were not available, minimum strain rate vs stress values were digitized from their Figure 2. These values, along with the results of Glen (Reference Glen1955) for T = −0.02°C and Colbeck and Evans (Reference Colbeck and Evans1973) for T = −0.01°C, are plotted in Figure 12. With the exception of the T = −48°C for which the model values plot somewhat lower than the experimental values, the model adequately represents the creep behavior from these three sources. The only model parameter varied for Figure 12 is the initial dislocation density, the values of which are reported in the Appendix. These initial dislocation densities provide insight regarding the initial state of the specimens used to generate each dataset. Specifically, Colbeck and Evans (Reference Colbeck and Evans1973) harvested their specimens from a temperate glacier so they had an extensive deformation history and evidently a high dislocation density at the start of their experiments. Barnes and others (Reference Barnes, Tabor and Walker1971) and Glen (Reference Glen1955), on the other hand, tested laboratory-prepared specimens and the specimen preparation method employed by each was very similar. They used either hoar frost or frozen water droplets as seed grains, both of which would result in exceeding small grains upon initial freezing. The specimens were allowed to temper for some time prior to testing, during which the grain size grew to ~1–2 mm. It is virtually certain that this period of grain growth resulted in very low dislocation densities (e.g. Baker and Gaydosh, Reference Baker and Gaydosh1987), which in turn explains the persistence of n = 3 behavior to relatively low stresses in the data of Barnes and others (Reference Barnes, Tabor and Walker1971).

Fig. 12. Minimum creep rate vs stress from Barnes and others (Reference Barnes, Tabor and Walker1971) along with results from Glen (Reference Glen1955) for T = −0.02°C and Colbeck and Evans (Reference Colbeck and Evans1973) for T = −0.01°C.
As noted for the Glen (Reference Glen1955) results, the fact that the data for T ≥ −22°C at the highest stress levels in Figure 12 fall above the model values is attributed to the onset of power law breakdown.
Discussion
The foregoing shows that the increased temperature sensitivity of the creep rate of ice with proximity to the melting point can be explained by a thermally induced increase in dislocation density beginning at −8°C. Since this behavior was shown to be common to several microstructural types of ice, it would seem to be a fundamental characteristic of dislocations in the ice lattice.
What can be inferred from the limited number of high temperature creep experiments available for granular freshwater ice is that the behavior is a consequence of (1) the high density of thermally induced dislocations and (2) the mechanism of stress-induced dislocation multiplication continues to act even when the overall dislocation density is high. The latter point is responsible for the emergence of n = 3 behavior even when the thermally induced dislocation density is very high (e.g. for the T = −0.02°C creep results of Glen, Reference Glen1955). In this context, the power law exponent of n = 1.3 calculated by Colbeck and Evans (Reference Colbeck and Evans1973) for their high temperature results, falls in a transitional region between n = 1 and n = 3 behavior which is evident when plotted along with all of Glen's (Reference Glen1955) data points (see Fig. 12).
The observation that the stress-induced dislocations scale with the thermally induced dislocation density might be anticipated on the basis of slip propagation from grain to grain and an increased number of active slip planes to accommodate the higher dislocation density. Pileups at grain boundaries generate dislocations in adjacent grains, so it is reasonable to expect that as the number of active slip planes increases (due to the presence of the thermally induced dislocations), the number of sources for stress-induced dislocations will increase proportionately. It is noteworthy that the dislocation density factor can be applied when the initial dislocation density differs from the stress-induced value as per Eqn (3). This behavior can be understood on the basis of the observations of Hiki and Tamura (Reference Hiki and Tamura1983) plotted in Figure 5.
Regarding the fall-off from n = 3 behavior at low stresses, there is a line of thought that it results from assigning minimum strain rate values before the actual minimum value was achieved. This was evidently first suggested in Glen (Reference Glen1955) as a possible explanation for the behavior seen in his experiments at low stress levels. While this explanation could certainly be valid in some cases, the preponderance of data obtained in the intervening years indicates that the fall-off is a legitimate feature of ice behavior. It does not occur in all datasets because of variations in the initial dislocation density of the specimens (which is a function of their strain history and/or specimen preparation method). Consequently, the systematic fall-off from n = 3 at lower stresses seen in results such as Steinemann's (Reference Steinemann1954, Reference Steinemann1958) can be accounted for with an elevated initial dislocation density. Moreover, the experiments of Cole (Reference Cole2003) clearly demonstrated that the stress level associated with the fall-off from n = 3 behavior is directly linked to the initial dislocation density of the specimen. Specimens used in work such as Barnes and others (Reference Barnes, Tabor and Walker1971) − which do not exhibit a systematic fall-off at their lowest stress levels – would have had a relatively low initial dislocation density for reasons discussed above. Sea ice and freshwater ice containing second phase particles (Song and others, Reference Song, Baker and Cole2008) typically have a much higher grown-in dislocation density than most forms of pure freshwater ice and exhibit a fall-off from n = 3 behavior at higher stresses than pure freshwater ice. These findings indicate that understanding dislocation densities in situ will be a critically important aspect of modeling the constitutive behavior of ice in general.
An important implication of the Barnes and others (Reference Barnes, Tabor and Walker1971) creep data are that the value of ρ 0 determined for those data are essentially a maximum value. The other datasets examined showed at least some fall-off from n = 3 behavior at low stresses which in turn allowed the calculation of a corresponding value of ρ 0. With no evidence of the fall-off in the data of Barnes and others (Reference Barnes, Tabor and Walker1971), it can be stated that the actual value of ρ 0 is no greater than the value reported in Table A3. Owing to the likely effects of pre-test grain growth in their specimens, the actual value of ρ 0 could be considerably lower. This matter has important implications with regard to ice-sheet modeling where similar processes of grain growth occur.
The present model employs explicit deformation mechanisms which in turn leads to the possibility of a range in both the apparent activation energy and stress dependence depending on temperature, stress state and stress/strain history of the material. It is particularly important to adequately model these dependencies given the challenges that the ice mechanics community is currently facing. While this situation complicates numerical modeling efforts, computational capabilities are sufficiently advanced to allow large-scale ice flow models to incorporate more detailed constitutive models and track evolving quantities such as fabric and dislocation density. Given climate change issues dominated by warming trends, employing a physics-based model that is valid close to the melting point would clearly improve predictive capabilities. Similar problems confront the sea-ice mechanics community. Climate trends in recent decades have resulted in thinner, warmer sea-ice covers in many areas of the globe and the validity of empirical models based on data from thicker, colder sea-ice covers should be carefully examined. Those issues will be addressed in a subsequent publication.
An important implication of the present effort is that the problem of modeling the constitutive behavior of ice can be attacked effectively by quantifying the dislocation density for the conditions of interest. Although validation experiments are always called for, a dense matrix of experiments to explore the effects of stress and temperature on creep rate at high temperatures (or under other conditions of interest) is not required since those dependencies are known and controlled by the underlying dislocation mechanism. Moreover, this approach could be applied to the study of in situ ice behavior as well as in the laboratory. Such an effort, as outlined in the following section, would entail experiments on core specimens to profile the dislocation density of an ice sheet, with the caveat that the measurements would need to be taken very shortly after harvesting of the cores. This is not a trivial task, but it would provide the critical link between the model and in situ behavior.
Comments on future work
Additional experimentation to replicate and expand upon the results of Morgan (Reference Morgan1991) is clearly warranted. Given the positive indications of the present approach, it would be critical to conduct such experiments in a way that supported the calculation of dislocation density, paying particular attention to high temperatures, low stresses and conditions involving recrystallization. This would involve the application of cyclic loading or careful monitoring of the post-test anelastic recovery strain in creep experiments. With the knowledge of the microstructure, this assessment requires only the application of a few low amplitude loading cycles at a frequency in the range of 10−2 to 10−1 Hz. Experiments of this type, conducted over a range of temperatures, would also provide information needed to firmly establish the activation energy associated with dislocation production in freshwater ice, which is evidently lower than found for sea ice. The application of cyclic loads to specimens prior to testing would shed light on the initial dislocation density which is of interest because it can have a major impact on the mechanical response at low stress levels.
Clearly, future experimental efforts should continue to include detailed microstructural observations given the overriding importance of crystallographic orientation to understanding the fundamentals of ice behavior. High temperature experiments to discern the extent to which variations in creep rate are due to microstructure, temperature control or naturally occurring fluctuations in dislocation density would be of great use. Due to abiding interest in pressure effects, it would be very informative to repeat the dynamic experiments of Hiki and Tamura (Reference Hiki and Tamura1983) as a function of pressure.
Although the application of the model to the case of granular freshwater ice produces good agreement with laboratory results, the more important question is how well it simulates in situ behavior. Qualitatively, the careful thin section work of Faria and Kipfstuhl (Reference Faria and Kipfstuhl2004) showed remarkably clear basal plane slip bands in ice taken from Dome Concordia at depths to 1291 m, the presence of which validates the view that ice flow at depth is supported by extensive basal dislocation glide. Unfortunately, the dislocation structure is not stable once stress is removed. Cole and Durell (Reference Cole and Durell2001) demonstrated that recovery processes reduce the dislocation density measurably within 1 d and by ≈25% within 3 d after unloading. Consequently, archival ice cores that have been stored for much longer periods are likely to be of little use in assessing the in situ dislocation density. Rather, the validation of the model would require experiments on cores soon after their removal from an ice sheet as described in the following paragraph.
Interest in ice dynamics rather than climate records has prompted drilling projects in the areas of active flow (e.g. the East Greenland Ice-Core Project). Such programs offer an opportunity to conduct experiments to determine dislocation density as a function of depth in a deforming ice mass. Ideally, such an effort would involve cyclic loading experiments on specimens within a day or so after removal from the ice sheet while maintaining the in situ temperature. Fabric data, which are routinely obtained in drilling programs, would be critical to this analysis, but the time constraints on those observations are not severe provided that the specimens were stored at a sufficiently low temperature to arrest recrystallization. In this way, a profile of the dislocation density could be generated along with the necessary microstructural information (to include particulate and dissolved contaminant content). This approach would provide critical insight into how the dislocation density evolves as a function of in situ temperature and pressure as well as recrystallization events. Moreover, this approach would overcome perhaps the most fundamental criticism of laboratory-based studies of ice creep, which is their inability to replicate in situ strain history.
Summary and conclusions
An analysis of quasistatic and dynamic experiments on ice, coupled with dislocation-based constitutive modeling, demonstrated that the increased temperature sensitivity of the creep properties of ice within a few degrees of the melting point is due to a thermally induced increase in the dislocation density. Temperature effects on the dislocation density were found to be consistent for naturally occurring sea-ice cores, laboratory-prepared specimens of freshwater single crystals and polycrystals. This effect was quantified with a temperature-dependent dislocation density factor in an existing dislocation-based constitutive model. For this initial development, the dislocation density factor was formulated with piece-wise linear relationships with breakpoints at −8, −0.5 and −0.05°C and validated against laboratory creep experiments in the literature up to T = −0.01°C. Analysis suggested that the activation energy associated with dislocation production in freshwater ice is lower than the experimentally determined value for sea ice. Additionally, it was deduced from the creep behavior of ice near the melting point that dislocation multiplication during deformation increases in proportion to the thermally induced dislocation density.
The viscous strain component of the model successfully reproduced the temperature and stress level effects on the minimum creep rate found in several major datasets in the literature.
Based on the experimental findings and analysis presented above, the following conclusions may be drawn:
Thermal effects on anelastic and viscous straining:
(1) High temperature effects on the constitutive behavior of ice for T ≥ −8°C are attributable to a thermally induced increase in the mobile dislocation density.
(2) The experimental results support the use of a temperature-dependent multiplicative factor (f ρ), to account for the thermally induced increase in mobile dislocation density.
(3) Available data support the use of three piece-wise linear segments to quantify f ρ as a function of temperature for −8 ≤ T ≤ −0.01°C.
(4) In the high temperature regime, the stress-induced mobile dislocation density increases in proportion to the thermally induced dislocation density.
Acknowledgements
The work described herein covers many years of field and laboratory studies, projects funded by numerous agencies and, most importantly, several colleagues and co-workers without whom this paper would not be possible. In chronological order, the author is grateful for support from the following projects: Office of Naval Research Sea Ice Mechanics Initiative, Grants No. N0001495MP30001 and N0001496MP30021; ERDC-CRREL's In-house Independent Laboratory Research Program; US National Science Foundation Office of Polar Programs, Arctic Natural Sciences Program Awards No. OPP 011737 and PLR 1022703. All of the quasistatic cyclic loading experiments on various ice types were conducted by Mr. Glenn Durell (CRREL-Ret.) and his skill, diligence and creativity are the foundation of this and many related efforts. An indispensable colleague in the Arctic and Antarctic fieldwork was Prof. J.P. Dempsey of Clarkson University, Potsdam NY. The author also thanks Dr Adam Treverrow of the Antarctic Climate & Ecosystems Cooperative Research Centre, Hobart, Tasmania for providing archival data from the Australian program and numerous helpful technical exchanges during the writing of this manuscript.
Appendix
Background of Eqns (3) and (4)
The experimental data which supported the development of Eqns (3) and (4) were presented in Cole and Durell (Reference Cole and Durell1999 and Reference Cole and Durell2001). The experiments involved alternating cyclic and creep loading segments and provided a way to quantify the dislocation density as a function of creep stress, strain and temperature. Initial dislocation densities were determined by subjecting specimens to loading cycles prior to any creep deformation. With the knowledge of average crystallographic orientation and specified experimental conditions (temperature, peak stress and cyclic loading frequency), the dislocation density was calculated from the observed hysteresis loop width or area. Specimens were then subjected to a series of creep loading/unloading stages under a given creep stress level and temperature. Since the dislocation density evolves rapidly as a function of strain, the strain associated with each creep loading section was such that the accumulated strain for all stages was typically 0.01–0.02, by which point a terminal state was well established. Load cycles were applied after each loading stage, which provided a way to calculate the evolution of the dislocation density as a function of the applied creep stress and viscous strain for each temperature. Figure A1 shows a typical example of the cyclic loading portion of these experiments. The increasing area of the hysteresis loops gives evidence of the increasing dislocation density.

Fig. A1. Cyclic loading response after several stages of deformation under a compressive creep stress of 2.45 MPa. Total strain increments were 0.00255, 0.00419, 0.0479 and 0.0043.
Figure A2 plots the calculated dislocation density as a function of accumulated creep strain for several specimens at T = −20°C for the indicated creep stress levels. In total, 20 specimens were tested after at least five increments of creep strain each for a total of over 100 individual data points in stress–strain/temperature space were generated (all values are tabulated in Cole and Durell, Reference Cole and Durell2001), and Eqns (3) and (4) were generated by a best-fit statistical analysis of this dataset.
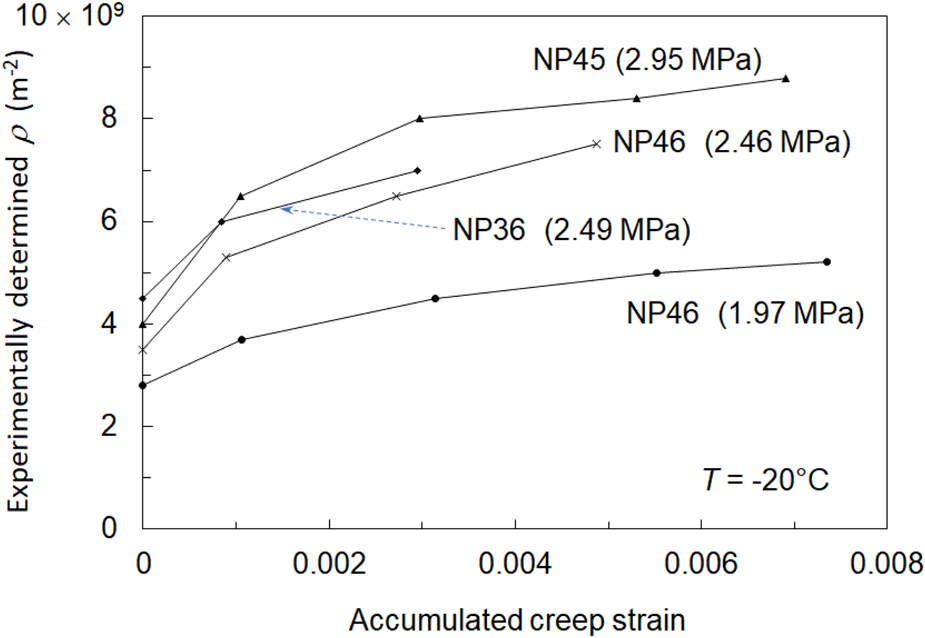
Fig. A2. Calculated dislocation density vs accumulated creep strain for four specimens subjected to the staged creep experiments described in the text.
Details of the cyclic loading methodology
The cyclic loading experiments considered in the present analysis used a zero-mean-stress (e.g. a sinusoidal tension-compression) waveform applied in load control by an electro-hydraulic testing system. This method subjects a single specimen to a great number of experimental conditions (e.g. varying peak stress level, frequency and temperature) which avoids specimen-to-specimen variations associated with strain-to-failure experiments. Regarding the temperature sequence in the experiments presented below, most specimens were tested initially at −10°C, followed by the lower temperatures in decreasing order. After the lowest temperature was examined, temperatures above −10°C were examined in increasing order. Provided that no other loading is applied to the specimens, the above methodology allows the calculation of dislocation density as a function of temperature. The anelastic component of the model described in the text provided a way to determine the dislocation density from the area of hysteresis loops observed in the cyclic loading experiments. These experiments typically called for the application of three load cycles at a given frequency and peak stress level. The reported values of loss compliance and dislocation density derived from these experiments were based on the average hysteresis observed for the second and third cycles. This was done to avoid the transient effects of the first cycle. A typical coefficient of variation (mean/std dev.) of, for example, the hysteresis loop width averaged for all stress levels, temperatures and frequencies applied to a specimen is 6.8%. The quantities derived from these measurements are linear functions of the loop width so they have a similar variability.
These experiments typically involved strains in the 10−4 order of magnitude or less and have been shown to impart no discernible changes to the specimen for frequencies into the 10−4 s−1 order of magnitude (Cole and Durell, Reference Cole and Durell1995). Specimens were either prepared in the laboratory or harvested during field trips to the Alaskan Arctic (Chukchi Sea near Barrow, AK). The laboratory-prepared columnar-grained specimens were produced according to the method described in Cole and Durell (Reference Cole and Durell1995), using either fresh water or saline water as needed. This method produced blocks of columnar-grained ice with c-axes randomly oriented in the horizontal plane. Horizontal cores were obtained from these blocks and end caps were applied according to the method described in Cole and others (Reference Cole, Gould and Burch1985).
Table A1. Fixed model parameters

Table A2. Model variables

Table A3. Values of ρ 0 for various creep datasets from the literature


 Open access