


1 Introduction
The mass balance of glaciers is affected by several components other than surface mass balance. Non-surface mass-balance components related to calving of ice into the ocean or proglacial lakes (see Cuffey and Paterson, Reference Cuffey and Paterson2010, ch. 12) and basal melting of ice shelves (e.g. Pritchard and others, Reference Pritchard2012) are often considered. Mass-balance components due to dissipation of energy in the flow of ice and water within and at the base of the glacier and due to geothermal heat flux have, however, not received much consideration in glaciological research until recently. Alexander and others (Reference Alexander, Shulmeister and Davies2011) calculated basal melting and internal melting due to ice flow of > 2 m w.e. a−1 in the elevation range 300–1500 m a.s.l. for Franz Josef Glacier in New Zealand, a high-precipitation, temperate glacier, and the magnitude of the non-surface mass balance was estimated as ~10% of the total ablation for the whole glacier. Alexander and others (Reference Alexander, Davies and Schulmeister2013) carried out a similar analysis for Columbia Glacier, a fast-flowing, temperate, tidewater glacier in Alaska, and found that these mass-balance components are in the range 0.061–0.129 m w.e. a−1 for this glacier. Oerlemans (Reference Oerlemans2013) analysed energy dissipation due to the flow of ice and water within glaciers and calculated average internal and basal melting for six non-surge-type glaciers in the range 0.01–0.49 m w.e. a−1 depending on conditions, highest for fast-flowing, temperate glaciers (Franz Josef Glacier in New Zealand, Nigardsbreen in Norway, Breiðamerkurjökull in Iceland) but lower values for more continental or high-Arctic glaciers (Dammagletscher and Rhonegletscher in Switzerland, Nordenskiöldbreen on Svalbard).
Except for Franz Josef Glacier, reported average, non-surface mass-balance components are small relative to the average winter or summer mass balance of the respective glaciers, which is typically several metres water equivalent per year. However, the magnitude of the non-surface mass balance can be substantial relative to the average annual mass balance, which is a comparatively small difference of two larger values. The annual mass balance is typically on the order of a few tens of cm water equivalent per year in magnitude up to 1–2 m w.e. a−1. Neglecting the non-surface mass balance can, therefore, in many cases lead to a non-negligible bias in the average annual glacier mass balance although relative errors in the winter or summer balance may seem small.
Geodetic mass-balance studies in recent years have shown that traditional mass-balance measurements are often biased by several tens of cm water equivalent per year (Zemp and others, Reference Zemp2013; Andreassen and others, Reference Andreassen, Elvehøy, Kjøllmoen and Engeset2016). The reported biases are on the same order as the annual non-surface mass balance in many cases. Therefore, it is important to consider the non-surface mass balance explicitly in order to correctly assess the glacier mass balance. The geodetic mass balance differs from surface mass balance, typically measured by in-situ measurements, in that it refers to a direct measurement of the change in the total volume or mass of the glacier (Cogley and others, Reference Cogley2011). This type of measurement includes mass-loss processes that take place at the glacier terminus (calving), the glacier bed (geothermal melting and energy dissipation due to sliding and flow of water along the bed) and internally within the glacier (dissipation in the flow of ice and water).
Apart from its importance for the mass balance, subglacial geothermal heat flux and associated basal melting has attracted increasing attention in recent years as an important component in the dynamics of glaciers, in particular for the large ice sheets of Greenland and Antarctica. The magnitude of localized geothermal heat flux under the Greenland ice sheet has been inferred to be 15–30 times the continental background at the onset of the NEGIS ice stream in northeastern Greenland, and subglacial melting at this location exerts a strong influence on the ice flow (Fahnestock and others, Reference Fahnestock, Abdalati, Joughin, Brozena and Goginen2001; Smith-Johnsen and others, Reference Smith-Johnsen, Schlegel, de Fleurian and Nisancioglu2020). Furthermore, the geothermal heat flux under the Greenland ice sheet shows substantial spatial variations (Greve, Reference Greve2019), which influence ice flow via the temperature of the ice and the thermal conditions at the base. Localized high geothermal heat flux has also been measured and inferred below the ice sheet in Antarctica and is believed to be an important parameter in ice stream dynamics and the formation of subglacial lakes, in particular for West Antarctica (Fischer and others, Reference Fischer2015; Schroeder and others, Reference Schroeder, Blankenship, Young and Quartini2014; Loose and others, Reference Loose2018).
Glaciers in Iceland (Fig. 1) are temperate and have a high mass turnover (Björnsson and Pálsson, Reference Björnsson and Pálsson2008; Björnsson, Reference Björnsson (English translation: D'Arcy JM)2017). Most of them are located in areas of high geothermal heat flux (Hjartarson, Reference Hjartarson2015) and some of them cover active volcanoes (Gudmundsson, Reference Gudmundsson2005). Non-surface mass balance may therefore be expected to be significant for glaciers in Iceland. Below, we present quantitative estimates of the non-surface mass balance of the main glaciers in Iceland over 25 years (the period 1995–2019) and compare these to reported estimates of the average annual mass balance of the glaciers. During this period, the mass balance of glaciers in Iceland turned negative after a few decades of near-zero mass balance (Björnsson and others, Reference Björnsson2013; Aðalgeirsdóttir and others, Reference Aðalgeirsdóttir2020). In Section 2, we describe the methods and data employed in the analysis. The results for the seven largest glaciers in Iceland, comprising $\gt 95\percnt$ of the total glacier area in the country, are presented in Section 3, the results are discussed in the context of glaciers in other parts of the world in Section 4, and the conclusions are summarized in Section 5.
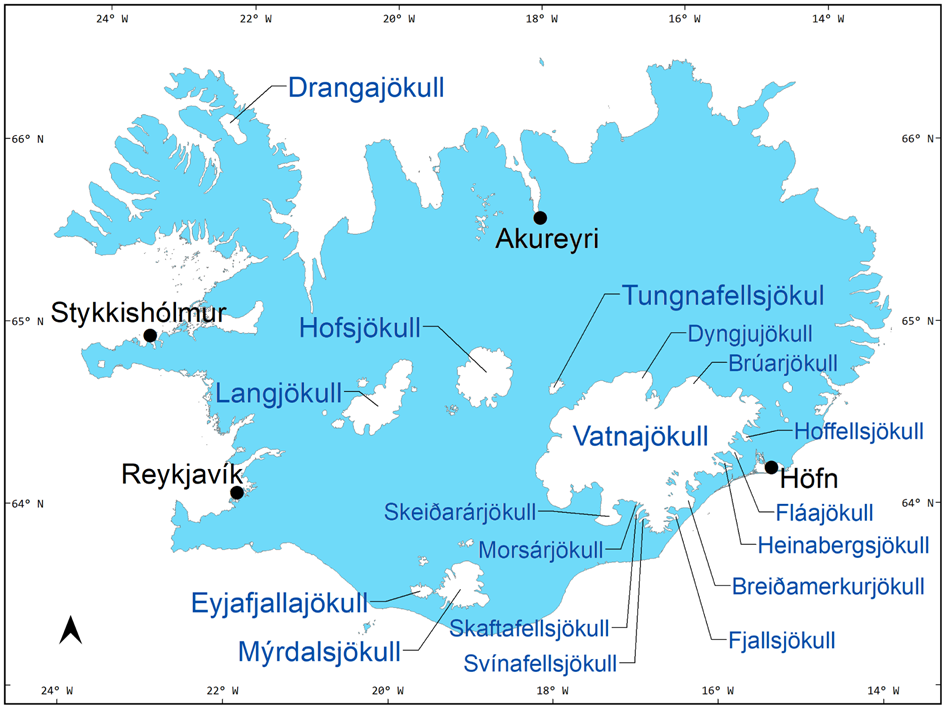
Fig. 1. Location map showing the main ice caps of Iceland and some of their outlet glaciers discussed in this paper.
2 Data and methods
2.1 Geothermal melting and melting due to volcanic eruptions
Average geothermal basal melting, m g, is calculated for each ice cap according to the equation

where q g is the geothermal heat flux outside of localized geothermal areas (Hjartarson, Reference Hjartarson2015), Q gw is the potential heat flow with groundwater away from glaciers located on permeable beds (see below), P k is the estimated power of a geothermal area or volcanic system within the glacier, and L m = 334 kJ kg−1 is the latent heat of fusion for ice (Cuffey and Paterson, Reference Cuffey and Paterson2010). The integral is taken over the area of the glacier, A, which is taken from the glacier map of Iceland by Sigurðsson and others (Reference Sigurðsson, Williams and Víkingsson2017) and determined from aerial and satellite images as well as oblique aerial photographs from the period 1999–2004 (Fig. 1). The sum is taken over known geothermal areas and volcanic systems that are not considered as part of the general geothermal heat flow due to vertical heat conduction in the crust as represented by the heat flow map (Fig. 2).
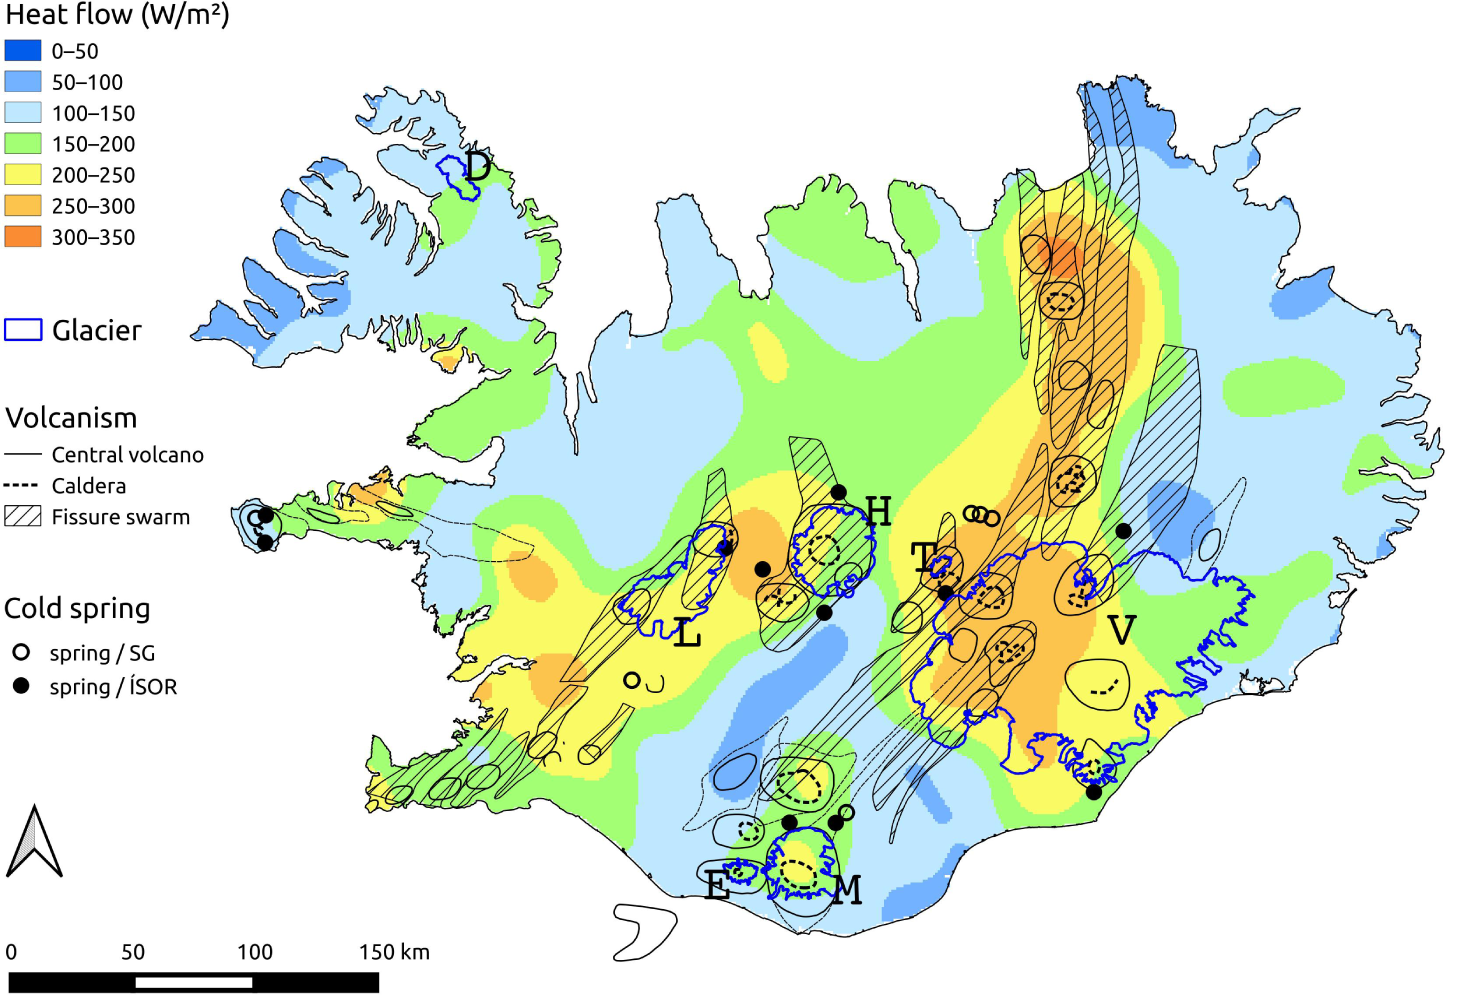
Fig. 2. Heat flow map of Iceland, with outlines of the seven largest glaciers considered in this paper (V: Vatnajökull, L: Langjökull, H: Hofsjökull, M: Mýrdalsjökull, D: Drangajökull, E: Eyjafjallajökull, T: Tungnafellsjökull) and the locations of the main volcanic and geothermal systems as well as associated fissure swarms. Heat flow > 200 mW m−2 roughly reflects the currently active volcanic zones. Reproduced from Hjartarson (Reference Hjartarson2015). Locations of groundwater springs close to glaciers where water temperature has been measured in connection with chemical analysis of water samples (Gíslason and Eugster, Reference Gíslason and Eugster1987; Gíslason, Reference Gíslason1992; denoted by ‘SG’ in the figure legend) and in connection with geological mapping (data from Iceland Geosurvey (ÍSOR), denoted by ‘ÍSOR’ in the legend) are shown. Information about volcanic systems and fissure swarms is from Jóhannesson and Sæmundsson (Reference Jóhannesson and Sæmundsson1998).
The geothermal heat flow in Iceland is highest, typically in the range 200–300 mW m−2, in the neo-volcanic zone that runs across Iceland from SW to NE and underlies the western half of the Vatnajökull ice cap (see Fig. 2). Outside of the neo-volcanic zone, the heat flux is lower, varying between 100 and 200 mW m−2. This may be compared with the average geothermal heat flow of continental crustal areas on Earth which is estimated as 65 mW m−2 (Davies, Reference Davies2013).
The heat flow map is derived from temperature measurements in boreholes, which are naturally non-existent on the glaciers. Therefore, uncertainty in the heat flow is largest in the glacier areas. Nevertheless, the heat flow map should give a good indication of the magnitude of the geothermal heat flow towards the base of the glaciers and the regional variation in heat flow between glaciers in the neo-volcanic zone and glaciers in colder areas such as Drangajökull in Vestfirðir (the Westfjords).
The heat flow shown on the map in Figure 2 does not take account of localized heat flow in high-temperature geothermal areas, which must, therefore, be treated separately. The results of studies of the heat output of several subglacial geothermal areas beneath Icelandic glaciers are given in Table 1. These are mostly based on calorimetry where the volume of ice melted is obtained by repeated mapping of ice-surface elevation where changes occur, or through estimates of the power needed to maintain a depression in the glacier surface. The calorimetry is based on the annual mass balance of ice drainage areas for whole basins as occurs for Grímsvötn, or the balance for the ice drainage areas of individual ice cauldrons (e.g. Björnsson, Reference Björnsson1983; Jarosch and Gudmundsson, Reference Jarosch and Gudmundsson2007; Reynolds and others, Reference Reynolds, Gudmundsson, Högnadóttir and Axelsson2019). The most powerful areas (Grímsvötn, Skaftárkatlar, Katla) account for most of the geothermal heat output and the values for these are more accurate than for the smaller areas. The values obtained for Öræfajökull, Hofsjökull and Eyjafjallajökull are rough indications of the geothermal power that may be improved in the future by further analysis of localized mass balance, repeated Digital Elevation Models (DEMs) and ice-flow modelling.
Table 1. Estimated geothermal and volcanic power beneath the seven largest Icelandic ice caps, 1995–2019

Sources on ice melting and/or geothermal and volcanic power: aReynolds et al. (Reference Reynolds, Gudmundsson, Högnadóttir and Pálsson2018).
bGudmundsson et al. (Reference Gudmundsson, Sigmundsson, Björnsson and Högnadóttir2004).
cM. T. Gudmundsson, Th. Högnadóttir, unpublished data.
dReynolds et al. (Reference Reynolds, Gudmundsson, Högnadóttir, Magnússon and Pálsson2017).
eReynolds et al. (Reference Reynolds, Gudmundsson, Högnadóttir and Axelsson2019).
fOddsson (Reference Oddsson2016).
gGudmundsson et al. (Reference Gudmundsson, Magnússson, Högnadóttir, Pálsson and Rossi2018).
hBased on an approximate estimate of ice catchment basins of cauldrons and annual surface mass balance.
iJarosch et al. (Reference Jarosch, Magnússon, Wirbel, Belart and Pálsson2020).
jGudmundsson et al. (Reference Gudmundsson2012); Oddsson (Reference Oddsson2016).
Studies over decades have shown that geothermal heat output of the subglacial volcanic systems or geothermal areas varies considerably with time depending among other things on the time elapsed since the last eruption. For example, the power of the geothermal area in Grímsvötn, excluding direct melting by volcanic eruptions, varied between 1600 and 6000 MW during the period 1922–1991 (Björnsson and Gudmundsson, Reference Björnsson and Gudmundsson1993; Gudmundsson and others, Reference Gudmundsson, Björnsson and Pálsson1995). A recent study of the Grímsvötn basin (Reynolds and others, Reference Reynolds, Gudmundsson, Högnadóttir and Pálsson2018) provides a best estimate of 1650 MW for the geothermal component in Grímsvötn in the last two decades. The Skaftárkatlar geothermal area is comprised of two large ice cauldrons (2–3 km in diameter) where an 80-year record shows a combined power of ~1500 MW for the period 1970–2018 (Gudmundsson and others, Reference Gudmundsson, Magnússson, Högnadóttir, Pálsson and Rossi2018). The power of Bárðarbunga greatly increased during the caldera collapse in 2014–2015. The average power since the 1990s may be computed from the last 4 years of high power (~400 MW; Reynolds and others, Reference Reynolds, Gudmundsson, Högnadóttir and Axelsson2019) and the two decades of low activity, providing a mean for the study period of 110 MW.
For other ice-covered areas in Vatnajökull (Þórðarhyrna, Hamarinn), the estimates are obtained from annual mass balance (Björnsson and Pálsson, Reference Björnsson and Pálsson2008; annual reports about mass-balance measurements on Vatnajökull, e.g. Pálsson, Reference Pálsson2016), and approximations of ice cauldron drainage area size. Öræfajökull has until recently not been recognized as having an active geothermal area. However, during unrest in 2017–2018, a cauldron was formed in the centre of the summit caldera, where a shallow depression has been present for decades. Moreover, repeated DEMs in the period 1945–2017 reveal a clear depression near the SE caldera rim that has become shallower in the last few years (Belart, Reference Belart2018), which is a sign of localized geothermal activity. The value of 50 MW given in Table 1 is a rough estimate for the study period, based on the annual mass balance, the extent of these depressions and taking into account the heightened activity in the centre of the caldera in 2017–2018. The Kverkfjöll area is only partly ice-covered. Here about one-third of the area is considered to be subglacial. Hence, about 100 MW out of the total estimated power of 190–340 MW (Oddsson, Reference Oddsson2016) is assumed to be dissipated in melting of ice. A small ice-surface cauldron that has been observed in Brúarjökull, east of Kverkfjöll, may be considered to be included in this number as it is located in the same N-Vatnajökull area in our analysis.
Geothermal areas under the ice cover of Mýrdalsjökull ice cap maintain 22 known ice cauldrons, that is depressions in the ice surface that are 0.3–1.5 km in diameter and typically several tens of metres deep (Gudmundsson and others, Reference Gudmundsson, Högnadóttir, Kristinsson and Gudbjörnsson2007; Jarosch and others, Reference Jarosch, Magnússon, Wirbel, Belart and Pálsson2020). Finite-element modelling of ice flow in the vicinity of the cauldrons was used to estimate the subglacial heat flux needed to balance the ice flux towards each cauldron (Jarosch and others, Reference Jarosch, Magnússon, Wirbel, Belart and Pálsson2020). These computations do not consider the large variations of the heat flux with time indicated by the complex history of the variations in the ice surface elevation in the cauldrons (Gudmundsson and others, Reference Gudmundsson, Högnadóttir, Kristinsson and Gudbjörnsson2007, Reference Gudmundsson, Högnadóttir and Rossi2016) but they should give a reasonable estimate of the magnitude of the combined heat flux of all the cauldrons. The total heat flux under 11 of the main cauldrons was estimated as ~600 MW from the modelling. The modelling result was extrapolated to ~800 MW for the total power of the geothermal areas under the 15 cauldrons that show most activity in terms of variation in the surface elevation, which corresponds to 50–60 MW for each cauldron on average. The power of the remaining cauldrons was assumed to be about one-third to one-half of the most active ones, and less localized geothermal activity within the Katla caldera, which may be expected to exist without notable surface depressions, was estimated as a few tens of MW, bringing the total power up to ~1000 MW. Considerations of glacier mass balance over estimated ice-flow basins of the cauldrons lead to a similar estimate of the total power of the geothermal areas. This estimate of the total power of subglacier geothermal systems under Mýrdalsjökull is less certain than the estimates of the power of Grímsvötn and Skaftárkatlar in Table 1. The available evidence, nevertheless, indicates that the power is likely to be in the range 800–1200 MW, i.e. close to the magnitude of Grímsvötn or Skaftárkatlar.
Eyjafjallajökull erupted in 2010 (Magnússon and others, Reference Magnússon2012; Oddsson and others, Reference Oddsson2016) and some minor geothermal activity persisted for several years afterwards. The effect of the 2010 eruption is averaged over the 25-year period 1995–2019 considered here, resulting in an averaged heat flux due to eruptions of 90 MW. The estimated heat flux from geothermal systems of 10 MW is a rough estimate. It is rather low because there are no large ice-surface cauldrons, indicative of substantial localized geothermal activity, in Eyjafjallajökull.
A jökulhlaup in Vestari-Jökulsá in August 2013 (Jóhannesson and others, Reference Jóhannesson, Sigurðsson and Hróðmarsson2014), which was associated with the formation of a 500–1000 m wide and 20 m deep depression in the NE part of the rim of the subglacial caldera in Hofsjökull, is evidence for geothermal activity under the ice cap. There are also ice-caves in the western margin of Hofsjökull known to be formed by geothermal activity. We subjectively assign a total power of 50 MW to this subglacial geothermal activity in Hofsjökull.
We are not aware of evidence for significant subglacial geothermal areas in Langjökull, Drangajökull and Tungnafellsjökull and therefore assume that localized geothermal heat flow does not contribute to basal melting for those glaciers. The geothermal melting computed for those glaciers is therefore only due to the distributed geothermal heat flux term in Equation (1).
Björnsson and others (Reference Björnsson2013) estimated that melting of ice due to subglacial volcanic eruptions in Iceland in 1995–2010 was 2% of total glacier ablation in this period. This is somewhat lower than the melting due to geothermal heat flow which was estimated as <3% of the total glacier ablation in the same study. The melting due to volcanic eruptions takes place as discrete short-lived events. Such eruptions are common (~10–15 per century), most often melting on the order of 0.1 km3 each, while the largest ones, occurring 1–3 times per century, may melt several km3 of ice (Gudmundsson and others, Reference Gudmundsson, Larsen, Höskuldsson and Gylfason2008). Those melt volumes may be compared with the total volume loss of the glaciers in Iceland since the end of the Little Ice Age in ~1890, which is estimated as ~600 km3 by Aðalgeirsdóttir and others (Reference Aðalgeirsdóttir2020). In Table 1, the eruptions that occurred in the period 1995–2019 include one large event (Gjálp in 1996) and four smaller events (Eyjafjallajökull 2010; Grímsvötn 1998, 2004, 2011) and minor subglacial eruptions during the Bárðarbunga eruption in 2014 (Reynolds and others, Reference Reynolds, Gudmundsson, Högnadóttir, Magnússon and Pálsson2017).
2.2 Heat carried away by subglacial groundwater flow
Our heat flow analysis so far ignores the penetration of glacial meltwater into sediments and bedrock below the glacier and the heat carried away with the resulting groundwater streams without causing melting of glacier ice. Such groundwater flow is known to be important for some glaciers in Iceland sitting on geologically young, permeable bedrock, particularly for Langjökull ice cap and for western and northern Vatnajökull (Sigurðsson, Reference Sigurðsson1990). The total groundwater discharge from glaciers in Iceland has been estimated as 200–300 m3 s−1 (Hjartarson, Reference Hjartarsonin press). The groundwater streams may flow away from the glacier with a temperature of a few degrees Celsius instead of flowing at the freezing point through terminus outlets into glacial rivers. The energy corresponding to such a difference in temperature is on the same order of magnitude as the geothermal heat flow in the crust below the glaciers or the potential energy difference between the glacier surface and outlet elevations on the Icelandic glaciers.
Heat carried away by subglacial groundwater flow may be a substantial proportion of the geothermal heat flow at depth below the glaciers in some regions. Glacial groundwater discharge from Langjökull was estimated as 50–80 m3 s−1 by Sigurðsson (Reference Sigurðsson1990) (we will use the middle of the range in this analysis), out of perhaps 100 m3 s−1 total runoff from the whole ice cap, and 35 m3 s−1 for western Vatnajökull (Tungnaá river basin). Other significant areas with glacial groundwater flow discussed by Sigurðsson (Reference Sigurðsson1990) include the northern part of Hofsjökull (estimated as more than ~10 m3 s−1 for the entire ice cap; but we use 10 m3 s−1 here, see also Sigurðsson, Reference Sigurðsson2004), the northwestern part of Vatnajökull (probably tens of m3 s−1 but not separately quantified by Sigurðsson, who gives the range 50–100 m3 s−1 for the entire W- and N-Vatnajökull; we use the value ~75 m3 s−1 here), and the northern part of Mýrdalsjökull (20–30 m3 s−1; we use the middle of the range here).
Additionally, we must expect glacial groundwater discharge from the eastern part of Mýrdalsjökull, feeding the groundwater streams on Mýrdalssandur. A rough discharge estimate is 5 m3 s−1. From the southern part of Vatnajökull, glacial groundwater flow is likely in the extensive alluvial plains in front of the main outlet glaciers (Skeiðarársandur, Breiðamerkursandur and Hoffellssandur). They are composed of deposits of thick moraine, sand and gravel beds, extending from underneath the glaciers to the shore. A conservative estimate of the total glacial groundwater discharge to the ocean in these areas is 5 m3 s−1. These estimates are clearly crude, but the uncertainty does not have a large effect on our estimates of the non-surface mass balance of the respective glaciers.
Temperature in several groundwater springs close to glaciers has been measured in connection with the studies of water chemistry and geological mapping (see Table 2). Figure 3 shows that more than half of these measurements fall in the range of 2–3°C. The measurement of 4.8°C at Vonarskarð west of Vatnajökull is from a spring that is within a geothermal area, and the measurement of 4.5°C at Fagurhólsmýri south of Öræfajökull is from an area where the groundwater flow from the glacier is likely to be substantially mixed with groundwater originating from precipitation on ice-free terrain. Furthermore, the springs at Skjálfandafljót and Brúarárskörð are more than 15 km from the glacier margin and are therefore likely to have a substantial discharge component originating from ice-free areas, although the water temperature there is similar to the temperature in springs closer to the ice margin. We will assume here that the temperature measurements given in Table 2, except for Vonarskarð and Fagurhólsmýri, are typical for groundwater streams near glacier margins with substantial groundwater discharge originating from subglacial water flow.

Fig. 3. Boxplot representation of groundwater temperature measurements of 20 springs in the vicinity of glaciers in Iceland (see Table 2 for references and detailed information, and locations in Fig. 2). The thick horizontal bar shows the median, the box indicates the 25 and 75% quantiles, the whiskers the spread of the bulk of the data (out to at most 1.5 times the interquartile range from the box) and the circle shows an outlier. Star symbols on the right-hand side of the boxplot show the temperature values themselves (the horizontal position of the symbols is shifted to the right to separate the symbols for multiple values).
Table 2. Groundwater temperature of springs (discharge >100 l s−1) in the neighbourhood of glaciers in Iceland; see locations in Figure 2

aHjartarson and Ólafsson (Reference Hjartarson and Ólafsson2005).
bGíslason and Eugster (Reference Gíslason and Eugster1987). Samples no. 88-3038, 88-3039, 88-3041, 88-3042.
cHjartarson (Reference Hjartarson1994).
dHjartarson, unpublished information.
eGíslason (Reference Gíslason1992). Samples no. 14, 15, 16.
fSigbjarnarson et al. (Reference Sigbjarnarson, Hannesdóttir and Erlendsson1971).
gSigurðsson and Einarsson (Reference Sigurðsson and Einarsson1982).
hGíslason and Eugster (Reference Gíslason and Eugster1987). Sample no. 89-1008.
iGíslason and Eugster (Reference Gíslason and Eugster1987). Sample no. 91-3203.
jKristjánsson (Reference Kristjánsson2003).
The potential heat flow with groundwater away from glaciers located on permeable beds, Q gw, may be quantified roughly for the glaciers analysed by Sigurðsson (1990) as

where D gw and T gw are the groundwater discharge and groundwater temperature, respectively, and ρw = 1000 kg m−3, C p = 4218 J kg−1 K−1 are the density and specific heat of water, respectively. The heating of the groundwater flow on the way from the glacier to the springs, where the temperature was measured, partly takes place outside the glacier margin. From the distances to the glacier margin given in Table 2, we may roughly estimate that on the order of one-third of the geothermal heat transferred to the groundwater on its way from the glacier bed to the spring takes place outside the glacier margin. Based on this consideration, we use the value T gw = 2°C for the groundwater temperature near the glacier margin for this simple analysis and assume that this heat loss is insignificant for glaciers other than those mentioned above in the discussion of groundwater streams from glaciers.
The potential heat flux of the subglacial groundwater flow is subtracted from the integral of the geothermal heat flow over the glacier in Equation (1) when the geothermal melting of ice is computed. If the calculated potential heat flow with groundwater exeeds the geothermal heat flux for the glacier in question, then the groundwater heat flux has been overestimated since the groundwater temperature will adjust to the available heat flux for each ice-flow basin. Therefore, we put the heat source due to distributed geothermal heat flux to zero in Equation (1) when the difference between the geothermal heat flux and the potential heat loss due to groundwater is negative.
The potential groundwater heat flux for Langjökull and Mýrdalsjökull is larger than the distributed geothermal heat flux, $\bar {q_{\rm g}}$ , integrated over the area of the glacier so that little or none of the distributed geothermal heat flux reaches the bed to melt ice. For Hofsjökull and N-Vatnajökull, approximately half of the distributed geothermal heat flux is carried away from the glacier by groundwater flow. For other glaciers, we assume that heat loss due to groundwater flow is substantially smaller than the total distributed geothermal heat flux. For Mýrdalsjökull, the inferred heat flux of groundwater flow from the northern part of the ice cap may exceed the geothermal heat flux for the ice-flow basins in question but it may, nevertheless, be smaller than the geothermal heat flux for some other ice-flow basins of the ice cap. The corresponding error in our estimates of non-surface mass-balance ice melt is comparatively small, so we will ignore this complication.
There is of course substantial uncertainty in Sigurðsson (Reference Sigurðsson1990) groundwater discharge estimates, as reflected by the ranges specified by him indicating an uncertainty of several tens of per cent in most cases, and our assumptions regarding the temperature of groundwater flow at the glacier margins may be uncertain by ±0.5°C. Our conclusion that most of the distributed geothermal heat flux from Langjökull and Mýrdalsjökull and a substantial proportion of the flux from Hofsjökull and W- and N-Vatnajökull is carried away by subglacial groundwater flow is, however, robust for likely values of these quantities. This also applies to our conclusion that most of the distributed geothermal heat flux for other glaciers is used for melting of ice at the glacier bed.
2.3 Melting due to dissipation of potential energy in a steady state
Melting due to dissipation of energy in the flow of ice and water within and at the base of the glacier is calculated in the same manner as in Alexander and others (Reference Alexander, Shulmeister and Davies2011, Reference Alexander, Davies and Schulmeister2013) and Oerlemans (Reference Oerlemans2013), with some simplifications. For ice caps in Iceland, we can ignore runoff from adjacent ice-free areas that enters the glacier hydrological system with temperature above the freezing point. Furthermore, we calculate the melting due to dissipation indirectly from considerations based on the loss of potential energy rather than directly based on basal shear stress and sliding velocity and from stresses and straining in the flow of ice or water. Thus, we assume that the loss of potential energy due to the change in elevation of precipitation that is deposited on the surface of the glacier, until it exits the glacier at outlets at the ice margin at a temperature equal to the freezing point, contributes to melting of glacier ice. Energy corresponding to difference between the temperature of rain on the glacier and the freezing-point contributes to the melting of snow or ice at the surface. Such melting is therefore considered as part of the surface mass balance.
For a glacier in steady state, runoff from the glacier will equal the total precipitation on the glacier in a glaciological or mass-balance year, which starts at the beginning of winter and lasts until the end of summer the following year (Cogley and others, Reference Cogley2011). As the geometrical configuration of a glacier in steady state is constant, the loss of potential energy can be calculated as an integral over the entire glacier of the elevation difference between the surface, where the precipitation is deposited, and outlets where runoff exits the glacier. For a non-steady-state, temperate glacier, the loss of potential energy corresponding to the elevation difference of areas where the elevation of the glacier surface changes and the corresponding outlets where meltwater exits the glacier must be added. We assume that the liquid water content of the glacier ice and volume of water stored in subglacial reservoirs does not change with time, nor the volume and density of firn and snow near the glacier surface. Furthermore, we neglect the effect of groundwater flow that may carry heat corresponding to some potential energy loss away from the glacier (see below). Energy conservation then gives the following equation for melting of ice due to energy dissipation, m d, in the flow of ice and water in a glacier

where p is precipitation as a function of horizontal position, z s is the elevation of the glacier surface, z o is the elevation of outlets at the glacier margin where runoff originating from the position in question exits, ρi = 900 kg m−3 the density of ice and g = 9.82 m s−2 the acceleration of gravity. It is convenient to define the precipitation-weighted elevation difference $\bar {\Delta z_{\rm p}}$ as the average difference in surface altitude with respect to outlet altitude weighted with the precipitation, as this quantity can be multiplied by the average precipitation to obtain the corresponding average energy dissipation.
Equation (3) does not distinguish between the direction of the flow of glacier ice and the subglacial flow of water and, therefore, ignores the difference between ice-flow basins and subglacial watersheds in the definition of the outlet elevation z o. The resulting error is small compared with other errors in this analysis as the elevation difference between neighbouring outlets is typically small on the glaciers we consider.
The importance of heat flow in subglacial groundwater flow for heat generated in the dissipation of potential energy by ice and water is difficult to quantify since there are few observations of groundwater infiltration below glaciers or theoretical analyses of the heat exchange in subglacial water flow. Rain and meltwater preferentially enter the glacier bed near the lower end of the elevation range of the glacier since the proportion of rain is larger at lower elevations and snow and ice melting is greatly intensified at the lower elevations compared with the upper reaches of the glacier. The elevation difference between the glacier bed and glacier river outlets in these lower areas that receive most of the rain and meltwater is typically small compared with the total elevation range of the glacier (cf. glacier bed maps in Björnsson, Reference Björnsson2009, Reference Björnsson (English translation: D'Arcy JM)2017 that show large rather flat areas and deep subglacial valleys upstream of many outlet-glacier termini, particularly for Vatnajökull ice cap). Furthermore, loss of potential energy in the flow of the ice and in water flow corresponding to the ice thickness will always contribute directly to melting of ice, as will flow of water along the glacier bed before the water enters groundwater streams, assuming that englacial and subglacial flow of water takes place at the freezing point.
Order-of-magnitude estimates indicate that potential energy lost in the flow of ice and melt water is mostly spent on melting of ice and that only a small proportion of the total dissipated potential energy is carried away by groundwater even when most of the water exits the glacier as groundwater such as for Langjökull and Mýrdalsjökull. Dissipated potential energy carried away from the glaciers by groundwater flow is therefore ignored in our analysis.
We base our energy dissipation analysis on dynamically downscaled precipitation in the period 1980–2019 from the Iceland reanalysis (ICRA) using the HARMONIE–AROME numerical weather prediction (NWP) model (see Bengtsson and others (Reference Bengtsson2017), for the general model configuration, and Nawri and others (Reference Nawri, Pálmason, Petersen, Björnsson and Þorsteinsson2017) for the specific set-up for Iceland), with the ERA-Interim meteorological fields (Dee and others, Reference Dee2011) as boundary conditions. The ICRA precipitation is extended from 2018 to 2019 with precipitation from the operational HARMONIE–AROME NWP for Iceland. The results are similar to the earlier precipitation downscaling for Iceland by Crochet and others (Reference Crochet2007) with a linear model (LT) of orographic precipitation, except that precipitation in NW-Iceland is substantially larger according to the ICRA than the LT downscaling. Comparison of operational HARMONIE–AROME NWP precipitation with observed, wind-corrected daily rain-gauge precipitation at meteorological stations has shown rather good consistency between the modelled precipitation and the observations (Crochet, Reference Crochet2013). Furthermore, regular verification of precipitation forecast by the Icelandic Meteorological Office to monitor the quality of the operational HARMONIE–AROME NWP has shown that it consistently outperforms other NWP models for Iceland, such as the HIRLAM model at 5 km horizontal resolution and the ECMWF HRES global model. Comparison of measured winter mass balance on Vatnajökull ice cap with precipitation from the ICRA shows good agreement except on the high stratovolcano Öræfajökull near the southern glacier margin, where the model substantially overestimates the precipitation on the high plateau of the volcano (Schmidt and others, Reference Schmidt2018). The model also seems to overpredict the precipitation on SE-facing windward slopes of the accumulation area, whereas precipitation is slightly underpredicted in the central part and on the north side of the ice cap, which is on the lee side of the main precipitation wind directions from SE. For the average values calculated, we use the study period 1995–2019 as before.
The altitude of the ice surface was determined from lidar DEMs of the Icelandic ice caps obtained in 2008–2013 (Jóhannesson and others, Reference Jóhannesson2013), except the lidar DEM for Langjökull from 2013, which was provided by Ian Willis. The glacier outlines for determining the areal extent of the integral in Equation (3) are again taken from the glacier map of Sigurðsson and others (Reference Sigurðsson, Williams and Víkingsson2017). The altitude of outlets, z o, was determined as a single representative value for each ice cap, except that Vatnajökull was divided into the area draining south and terminating close to sea level (S-Vatnajökull), and the area draining west and north and terminating in the Icelandic highland (W- and N-Vatnajökull) (see Fig. 4). This was calculated by extracting the elevation of the main termini of the outlet glaciers of each ice cap from the lidar DEMs along the outline, thereby determining a representative range for the outlet altitudes as well as a single respresentative mean outlet altitude for use in Equation (3). Some of the outlet elevations have changed since 1995. The Skeiðará river outlet at Skeiðarárjökull glacier in the Vatnajökull ice cap merged with Gígjukvísl river in 2009. This lowered the outlet altitude of part of the runoff from the Skeiðarárjökull ice-flow basin from 120 m to 60–80 m a.s.l. At Hoffellsjökull, also in Vatnajökull, the outlet of Austurfljót merged with Vesturfljót in 2008, resulting in a lowering of the eastern outlet of this glacier from 40 to 20 m a.s.l. The range of altitudes for the main outlets of each ice cap and the magnitude of time-dependent changes in outlet altitude are much smaller than the range of surface altitudes of the ice caps. The use of a single representative value for the outlet altitude of each ice cap, except for Vatnajökull ice cap where two values are used, is, therefore, considered adequate for the rather crude calculations based on Equation (3).

Fig. 4. Average annual precipitation in Iceland 1995–2019 derived from dynamic downscaling of ERA-Interim reanalysis data with the HARMONIE–AROME numerical weather prediction model (Nawri and others, Reference Nawri, Pálmason, Petersen, Björnsson and Þorsteinsson2017). The outlines of the seven largest Icelandic ice caps in 1999–2004 (Sigurðsson and others, Reference Sigurðsson, Williams and Víkingsson2017) studied here are shown (V: Vatnajökull, L: Langjökull, H: Hofsjökull, M: Mýrdalsjökull, D: Drangajökull, E: Eyjafjallajökull, T: Tungnafellsjökull). The ice divide on Vatnajökull between the ice-flow basins of W- and N-flowing outlet glaciers, terminating in the Icelandic highland, and S-flowing outlets terminating close to sea level is shown in black.
2.4 Dissipation melting due to changes in glacier mass
The contribution to the energy dissipation by the term representing changes in ice-surface elevation with time in Equation (3) can be crudely calculated based on estimates for the volume loss of Icelandic glaciers since 1995 (Björnsson and others, Reference Björnsson2013) and theoretical considerations and observations concerning the distribution of elevation changes with altitude. Changes in glacier elevation over time tend to be concentrated near the terminus, as shown in Figure 5 for Hofsjökull for the period 1999–2015. Similar intensification of surface lowering towards the terminus for 12 outlets of S-Vatnajökull was found by Hannesdóttir (Reference Hannesdóttir, Björnsson, Pálsson, Aðalgeirsdóttir and Guðmundsson2014, Fig. 7) for the period from the end of the Little Ice Age in ~1890–2010. This spatial distribution of changes in the surface elevation of glaciers is expected if they maintain similar overall shape when the terminus advances or retreats as assumed in the theory of the volume time scale for glacier adjustment to changes in climate by Jóhannesson and others (Reference Jóhannesson, Raymond and Waddington1989).

Fig. 5. Changes in surface elevation of Hofsjökull ice cap 1999–2015 according to a DEM based on aerial images by the company Loftmyndir from 1999 and the ArcticDEM from 2015 (PGC, 2016; Porter and others, Reference Porter2018).
The geometry of the surface profiles of many glaciers is well approximated by a parabolic shape (see Cuffey and Paterson, Reference Cuffey and Paterson2010, ch. 11). This shape is exact for a perfectly plastic glacier on a flat bed and an adequate approximate shape of the region near the terminus for most glaciers. The volume of glaciers and ice caps is found to scale with their area (Bahr and others, Reference Bahr, Meier and Peckham1997), consistent with this parabolic relationship, so that

where v and s are glacier volume and area, respectively. For the Icelandic ice caps, the coefficients in this relationship are found to be c = 0.023 and γ = 1.33 if v and s are expressed in km3 and km2, respectively (Fig. 6). For glacier geometries well approximated by a parabolic shape near the terminus, where changes in ice surface altitude are typically concentrated as discussed above, it can be shown that the term representing changes in ice-surface elevation in Equation (3) can be expressed in terms of the rate of change of the total volume change of the glacier as

where $\bar {\Delta z_{\rm t}}$ is the average drop in altitude to the outlet weighted with the lowering of the glacier surface and $\bar {h}$
 is the average ice thickness. This assumes that the outlet altitude is not greatly different from the altitude of the glacier bed in the area near the terminus where most of the changes in ice thickness take place. This term typically is much smaller than dissipation corresponding to the precipitation on the glacier surface, as the rate of volume change is a small fraction of total precipitation on the glacier, and the weighted average drop $\bar {\Delta z_{\rm t}} = \lpar 3/4\rpar \, \bar {h}$
 in Equation (5) is also in most cases small in comparison with the total elevation range of the glacier.

Fig. 6. Volume and area of six of the seven largest Icelandic ice caps (circles). The information about Vatnajökull (V), Langjökull (L), Hofsjökull (H) and Mýrdalsjökull (M) is from Björnsson and Pálsson (Reference Björnsson and Pálsson2008), Drangajökull (D) from Magnússon and others (Reference Magnússon2016) and Tungnafellsjökull (T) from Gunnlaugsson (Reference Gunnlaugsson2016). Note that the symbols for Langjökull and Hofsjökull nearly coincide. The solid line shows a least-squares fit to the points, and the dashed line the corresponding least-squares line derived by Bahr and others (Reference Bahr, Meier and Peckham1997) for 144 glaciers not including ice caps. The line for the Icelandic ice caps is lower than the line derived by Bahr and others for valley glaciers because the thickness of valley glaciers tends to be greater than that of ice caps with the same area.
The average surface mass balance of large glaciers in Iceland in the period 1995–2010 has been found to be near −1 m w.e. a−1 based on mass-balance measurements on Vatnajökull, Hofsjökull and Langjökull (Björnsson and others, Reference Björnsson2013), somewhat more negative for Hofsjökull and Langjökull than for Vatnajökull. Sufficiently extensive mass-balance measurements to determine glacier-wide balances over many years have not been carried out on other ice caps in Iceland. The mass balance of the three main ice caps has been less negative since 2010 than for 1995–2010 (Thorsteinsson and others, Reference Thorsteinsson, Jóhannesson, Sigurðsson and Einarsson2019; Aðalgeirsdóttir and others, Reference Aðalgeirsdóttir2020). Data are not available to calculate the effect of energy dissipation due to changes in ice-surface elevation with time for the entire period 1995–2019 with separate estimates for mass balance for each of the ice caps considered here. Since this term is quite small in comparison with other components of the non-surface mass balance, we use a single value of −1 m w.e. a−1 for all the ice caps for our analysis. This single value will be a little too small for Hofsjökull and Langjökull and a little too large for Vatnajökull, and presumably for Drangajökull too, but it gives a good indication of the relevance of this term and the accuracy is good enough to add the result to other non-surface mass-balance components to calculate the total non-surface mass balance.
2.5 Calving and melting in proglacial lakes
The main calving glacier in Iceland is the Breiðamerkurjökull outlet glacier in S-Vatnajökull that calves into the tidal glacier lagoon Jökulsárlón á Breiðamerkursandi (Björnsson, Reference Björnsson1996; Björnsson and others, Reference Björnsson, Pálsson and Gudmundsson2001). The lagoon began to form in the mid-1930s (Björnsson, Reference Björnsson1998) and its size approximately doubled from 1995 to 2018. By 2018, the lake was over 8 km long, 27 km2 in area (Guðmundsson and others, Reference Guðmundsson, Björnsson, Pálsson, Magnússon E, Sæmundsson and Jóhannesson2019) and 260–300 m deep (according to measurements in 2017) and had become the deepest lake in Iceland. The amount of floating ice in the Jökulsárlón lagoon varies seasonally and between years (Bergsdóttir, Reference Bergsdóttir2012; Jónsson, Reference Jónsson2016), reaching a maximum in winter and minimum in summer. The concentration of ice fragments is greatest near the outlet of Jökulsá river where many icebergs are left stranded in shallow waters near the southern lake margin. There are also many icebergs near the calving glacier front most of the time. Other parts of the lake are often largely without floating ice.
Calving into Jökulsárlón and the heat balance of the lake have been studied by Björnsson and others (Reference Björnsson, Pálsson and Gudmundsson2001) and Landl and others (Reference Landl, Björnsson and Kuhn2003). Tidal currents into and out of the lake, melt plumes near the ice front and the mixing of sea water with glacial runoff were studied by Brandon and others (Reference Brandon, Hodgkins, Björnsson and Ólafsson2017). The calving rate in 1997–1999 was estimated as 260⋅106 m3 a−1, corresponding to a power of 2500 MW, if all this ice is melted in the lake within 1 year (Landl and others, Reference Landl, Björnsson and Kuhn2003). In 2002–2007, the calving rate was 400–500⋅106 m3 a−1 (Bergsdóttir, Reference Bergsdóttir2012, based on Guérin, Reference Guérin2010), corresponding to a power of 3800–4800 MW, and the calving flux was estimated as 700⋅106 m3 a−1 in 2009 when the calving flux was exceptionally large (Guérin, Reference Guérin2010). The calving flux in recent years, 2015–2017, was estimated as ~600⋅106 m3 a−1 by Pálsson (Reference Pálsson2018), corresponding to a power of ~5700 MW, indicating that the calving flux has been similar, but perhaps slightly increasing, for the last 15 years. The above calving flux estimates may be compared with the average 1996–2017 total summer surface balance of 2400⋅106 m3 a−1 determined from in-situ measurements for the Breiðamerkurjökull ice-flow basin (Pálsson, Reference Pálsson2018).
The available power for melting of calved ice increases with lake area, and was estimated to have doubled to 3600 MW between the mid-1990s and 2011 by Bergsdóttir (2012). From the above calving flux estimates, it may be assumed to have increased further since then. Based on these studies, we will use the estimate P c = 4000 MW as an average value for the time period 1995–2019 for the energy corresponding to the calving flux of Breiðamerkurjökull and note that the current value is likely to be larger.
Many marginal lakes have formed in front of glacier termini in Iceland in recent decades, particularly at the southern margin of Vatnajökull where such lakes are currently growing in front of the Morsárjökull, Skaftafellsjökull, Svínfellsjökull, Kvíárjökull, Fjallsjökull, Heinabergsjökull, Fláajökull and Hoffellsjökull outlet glaciers (see Fig. 1), to name the largest lakes other than Jökulsárlón, which in combination now have an area of ~30 km2. Before 2000, some of these lakes hardly existed except for Breiðárlón by Breiðamerkurjökull and lagoons in front of Fjallsjökull, Heinabergsjökull and Fláajökull. Between 2000 and 2010, their combined area increased from 13 to 21 km2 (Guðmundsson and others, Reference Guðmundsson, Björnsson, Pálsson, Magnússon E, Sæmundsson and Jóhannesson2019). Thermal flux due to radiation and sensible heat flow into these lakes provides an additional heat source for ablation for the adjacent glacier that may directly ablate ice from the terminus or melt floating ice fragments that calve off the glacier. None of these lakes are tidal lakes so their effect on the mass balance of the glacier is much smaller than for Breiðamerkurjökull.
Landl and others (Reference Landl, Björnsson and Kuhn2003) estimated heat flow into Jökulsárlón due to atmospheric radiation and sensible heat flux as 80 W m−2, and a similar result is used in Bergsdóttir (Reference Bergsdóttir2012) analysis of the energy balance of Jökulsárlón for 2011. In lakes where the availability of calved ice fragments is sufficient, one may assume that similar conditions to those in Jökulsárlón would be encountered and the additional ablation due to the presence of the lake may then be crudely estimated from the lake area times a heat flux on the order of 80 W m−2. However, calving into some or most of the terminus lakes listed above appears to be slower than would be required to spread ice fragments over a large fraction of the surface area, so the lakes are largely free of ice fragments, except for the lake in front of Hoffellsjökull.
Since this calving ablation component for other outlet glaciers than Breiðamerkurjökull is comparatively small, as an average for the entire period 1995–2019, we estimate it with ~20 km2 as the average value for the total lake area, and half the heat flux due to radiation and sensible heat flux estimated for Jökulsárlón in 2002 by Landl and others, which leads to a heat source of P c = 800 MW. This estimate is quite uncertain but the computation nevertheless shows that it is much smaller than the heat source corresponding to the calving flux at Breiðamerkurjökull. The current calving flux into these lakes is likely to be considerably larger than the mean flux for 1995–2019 that has been crudely estimated here and needs to be calculated based on the measurements of ice velocity and ice thickness at the calving termini. Mass balance due to calving does not need to be taken into account for the other Icelandic ice caps considered here.
3 Results
Geometrical characteristics of the seven largest ice caps in Iceland are summarized in Table 3. These include the minimum and maximum elevations, z mn and z mx, the 25, 50 and 75% quantiles, z 25, z 50 and z 75, a representative range for the altitude of runoff outlets, z o, and a single representative value for the outlet elevations of each ice cap, $\bar {z_{\rm o}}$ , for use in computation of energy dissipation in the flow of ice and water. The statistics are calculated within the areas covered by the glaciers in the period 1999–2004, which is a little before the middle of the period 1995–2019 that we are considering, but the DEMs are more recent, that is from 2008 to 2013, somewhat after the middle of the period 1995–2019. We do not correct for this difference in timing between the glacier extents and ice surface DEMs as changes in glacier surface elevation during this time period are small in the interior of the glaciers that matters most for our analysis, but this should be borne in mind when the statistics in Table 3 are used.
Table 3. Geometric characteristics of the seven largest Icelandic ice caps (see the location map in Fig. 1). The ice divide separating W-/N- and S-Vatnajökull is shown in Figure 4. The range for the outlet elevation, z o, is chosen to give an indication of the altitude of main outlets; there are some minor outlets at higher elevations. The mean outlet elevation, $\bar {z_{\rm o}}$ , is determined so that it reflects the elevation of the main outflow outlets of the glacier. Altitudes are given to the nearest 5 m because seasonal variations in glacier surface elevations make greater numerical accuracy rather meaningless. The glacier area includes the area of nunataks and ice-free areas such as Esjufjöll and Mávabyggðir in Vatnajökull because runoff from these areas enters the subglacial hydrological system and leads to melting of ice from loss of potential energy as for precipitation that falls on the glacier. Altitudes are determined from lidar DEMs of the Icelandic ice caps from 2008 to 2013 (Jóhannesson and others, Reference Jóhannesson2013), except the lidar DEM of Langjökull from 2013, which was provided by Ian Willis

Due to the elevation difference between the north and south sides of the Vatnajökull ice cap, this ice cap was divided into two for our analysis, along a N–S ice divide (see Fig. 4). The elevation along the entire glacier margin in 2000 is shown in Figure 7 together with the chosen representative outlet altitudes for W/N-Vatnajökull and S-Vatnajökull. The figure shows clearly that most of the glacier margin is hundreds of metres higher than the outlet glacier termini. The lowest altitudes are, however, the correct altitudes to choose for our analysis because this is where almost all the runoff from the ice cap exits the glacier. The figure also shows that the outlet glaciers terminate at a rather consistent altitude for the W/N-part and S-part of the ice cap, respectively.

Fig. 7. Altitude along the outline of Vatnajökull in 2000 from west of Skeiðarárjökull counterclockwise around the ice cap (see location map in Fig. 1). The main outlet glaciers are denoted above the corresponding drop in altitude. Representative outlet altitudes, z o = 50 m a.s.l., for glaciers draining south and terminating close to sea level (S-Vatnajökull), and z o = 700 m a.s.l., for glaciers draining west and north and terminating in the Icelandic highland (W- and N-Vatnajökull) are indicated with horizontal dashed lines.
The non-surface mass-balance components calculated from Equations (1) and (3) for the main Icelandic ice caps are given in Table 4. The geothermal and volcanic melting and the dissipation melting are on a similar magnitude, varying from a few tens of mm w.e. a−1 to ~100–150 mm w.e. a−1 each. Mýrdalsjökull has the highest values of both geothermal/volcanic and gravitational melting, 157 and 149 mm w.e. a−1, respectively, and the south side of Vatnajökull has the largest total non-surface mass balance, 376 mm w.e. a−1, when calving is taken into account. The term in Equation (3) arising from energy dissipation due to changes in ice-surface elevation (not shown separately in Table 4) is only 1–9 mm w.e. a−1, highest for N-Vatnajökull and lowest for the smallest ice caps Drangajökull, Eyjafjallajökull and Tungnafellsjökull. The total non-surface mass balance is largest (in magnitude) for Mýrdalsjökull and Vatnajökull, in particular for S-Vatnajökull, as well as for Eyjafjallajökull, with melting in the approximate range 200–375 mm w.e. a−1. The glaciers in the central highland and in Vestfirðir have much lower-magnitude non-surface mass balance, with melting in the range 45–80 mm w.e. a−1. The northern and western ice-flow basins of Vatnajökull also have a rather low non-surface mass balance, close to 90 mm w.e. a−1 on average.
Table 4. Non-surface mass balance of the main Icelandic ice caps (see the location map in Fig. 1). The total non-surface melting, m t, is the sum of melting due to geothermal heat and volcanic eruptions, m g, dissipation of potential energy, m d, and a heat source corresponding to the calving flux, m c. P g denotes the combined power of geothermal systems and volcanic activity within the glacier, see Equation (1), and P c the power corresponding to the calving flux. See the Methods section for further explanation of the variables. The last column gives the volume of non-surface melting, m t A, for each glacier and the total for all the glaciers

The non-surface mass balance of other glaciers than the seven largest ice caps listed in Table 4 may be assumed to be similar to or lower than the non-surface mass balance of Tungnafellsjökull since these smaller glaciers have a narrow altitude distribution, comparatively low mass turnover and most of them are located in areas with low geothermal heat flow in N-, W- and E-Iceland. There are some minor ice-surface cauldrons in Torfajökull, a small ice cap north of Eyjafjallajökull, that are probably due to localized geothermal activity, and some similar activity could be present in other small glaciers, but their combinded power is unlikely to be significant in this context. The combined area of these smaller glaciers in about 2000 was ~320 km2 according to Sigurðsson and others (2017). Assuming melting due to non-surface mass balance on the order of 50 mm w.e. a−1 or less for those glaciers, their average contribution to the total non-surface mass balance of glaciers in Iceland was <0.02 km3 w.e. a−1 in 1995–2019, which is negligible in comparison with the total contribution of the seven largest ice caps.
As a fraction of the typical magnitude of the surface mass balance (−1 m w.e. a−1 on average for the glaciers in Iceland since 1995; Björnsson and others, Reference Björnsson2013; Aðalgeirsdóttir and others, Reference Aðalgeirsdóttir2020), the non-surface mass balance ranges from 4 to 38%, largest for Mýrdalsjökull (31%) and S-Vatnajökull (38%). In-situ mass-balance measurements are only available for the three largest ice caps in Iceland and the measurements for Langjökull do not cover the entire study period. The averages of available measurements are −1.3 mm w.e. a−1 for 1997–2019 for Langjökull, −1.0 mm w.e. a−1 for 1995–2019 for Hofsjökull and −0.6 mm w.e. a−1 for 1995–2019 for Vatnajökull (Björnsson and others, Reference Björnsson2013; WGMS, 2019; unpublished data from the IMO and the IES/UI). Using separate values for the magnitude of the surface mass balance for the individual glaciers where available in this comparison decreases the relative importance of the non-surface mass balance for Langjökull (from 6 to 4%) and increases the importance for Vatnajökull (from 22 to 35%). The overall conclusion, however, remains the same, the non-surface mass balance corresponds to on the order of 10% or several tens of per cent of a typical magnitude of the surface mass balance in recent decades.
The non-surface mass balance corresponds to a total runoff contribution of 2.1 km3 a−1 of water from the Icelandic glaciers. This is substantial in comparison with the total surface mass-balance contribution of glaciers in Iceland to sea-level rise, which has been on the order of 5–10 km3 w.e. a−1 in recent decades (Björnsson and others, Reference Björnsson2013; Aðalgeirsdóttir and others, Reference Aðalgeirsdóttir2020).
4 Discussion
Our results imply that during steady-state conditions, the average surface mass balance for the studied glaciers must be positive by tens of cm water equivalent. The total non-surface mass balance of the Icelandic glaciers corresponds to 0.006 mm a−1 sea-level rise equivalent and is substantial component in the contribution of glaciers in Iceland to global sea-level rise. This is comparable with the total sea-level rise contribution of Scandinavian glaciers and about one-quarter of the contribution of glaciers in Svalbard in 2006–2015 (Hock and others, Reference Hock2019).
We find that calving into terminal lakes other than Jökulsárlón along the southern margin of Vatnajökull did not have much effect on the mass balance of this part of the ice cap in the period 1995–2019, almost an order of magnitude less than the effect of calving into Jökulsárlón. This may change in the coming decades. Several rapidly retreating outlet glaciers in this area are in overdeepened valleys (Björnsson, Reference Björnsson2009, Reference Björnsson (English translation: D'Arcy JM)2017; Schomacker, Reference Schomacker2010; Guðmundsson and others, Reference Guðmundsson, Björnsson, Pálsson, Magnússon E, Sæmundsson and Jóhannesson2019) where the water depth at calving termini will increase if the current terminus retreat continues. The adjustment of glaciers to warming climate involves an amplifying mass-balance–elevation feedback, which is counteracted by a restoring feedback due to retreat of the terminus which reduces the ablation area of the glacier as it adjusts to the warmer climate. This restoring feedback due to the terminus response is potentially affected if the area lost by the glacier is replaced by a terminus lake with a calving ice front. Then, melting at the ice front and the presence of melting ice fragments in the lake effectively enlarge the ablation area of the glacier.
The termini of S-Vatnajökull may retreat by ~1 km per decade during the next century (Flowers and others, Reference Flowers, Marshall, Björnsson and Clarke2005), based on scenarios for climate warming. The lakes may grow by several tens of km2 during the next decades. The albedo of the lake surface of Jökulsárlón is similar to or lower than the albedo of the nearby ablation area of Breiðamerkurjökull Landl and others (Reference Landl, Björnsson and Kuhn2003). Melting of ice in the lakes may therefore be similar to or greater than the glacier ablation over the same area before the lakes were formed if the calving rate is sufficiently high. If calving into the lakes is rapid enough then the corresponding power available for melting is thousands of MW, which is on the same order as the total melting due to geothermal heat flow, geothermal areas and volcanic eruptions for the whole of S-Vatnajökull. The non-surface mass balance is therefore likely to become more negative for S-Vatnajökull in the future.
Our estimates for the non-surface mass balance of glaciers in Iceland, which include geothermal and volcanic melting, are near the upper end of the range 0.01–0.49 m w.e. a−1 found by Oerlemans (Reference Oerlemans2013) for melting due to energy dissipation in the flow of ice and water for six non-surge-type glaciers as discussed in the Introduction. This is due to the large mass turnover of the Icelandic glaciers, the high geothermal heat flux and volcanic eruptions in Iceland, and calving of the southern termini of Vatnajökull. Oerlemans (Reference Oerlemans2013) estimated melting of 0.17 m w.e. a−1 due to energy dissipation for Breiðamerkurjökull outlet glacier, which may be compared with our estimated dissipation melting of 0.14 m w.e. a−1 for the entirety of S-Vatnajökull (see Table 4). These estimates are in fair agreement with each other considering the different simplifying assumptions in the analyses and that Breiðamerkurjökull is only one of several ice-flow basins of S-Vatnajökull.
Non-surface mass balance is more important for Icelandic glaciers than for most other glacier regions. There are, however, several glacier regions in other areas on Earth with volcanism or high geothermal heat flux, for example in Alaska, Kamchatka, New Zealand, parts of Antarctica and northeastern Greenland. Moreover, dissipation melting will be important for glaciers with a wide elevation range and large mass turnover, such as in parts of the Himalayas, Alaska and southern Greenland. This indicates that non-surface glacier mass balance may be more important in the global context than most often assumed and warrants further analysis of this process in studies of the effect of glaciers on global sea level. The effect of geothermal heat flux and basal melting on ice-dynamics is also a subject that has recently been discovered to be of great importance, e.g. for northeastern Greenland (Smith-Johnsen and others, Reference Smith-Johnsen, Schlegel, de Fleurian and Nisancioglu2020), and may be essential in ice-flow modelling of this part of the Greenland Ice Sheet.
5 Conclusions
It is clear that non-surface mass balance is significant for large glaciers in Iceland, which are temperate, with a high mass turnover, and located in an area of high geothermal heat flux. Therefore, the non-surface mass balance is more negative for glaciers in Iceland than in most other glacier regions on Earth. The non-surface mass balance of Icelandic glaciers varies over an order of magnitude from small glaciers with a narrow altitude range and comparatively little precipitation to glaciers with a large altitude range, high precipitation, many geothermal areas and calving into terminal lakes.
Neglecting non-surface mass balance leads to biased estimates of glacier-mass change derived from traditional mass-balance measurements. For Mýrdalsjökull, S-Vatnajökull and Eyjafjallajökull, this bias can amount to ~20–40% of the magnitude of the (negative) average surface mass balance of Icelandic glaciers in 1995–2019. This proportion varies with the time period and glacier in question. For periods and glaciers with a less negative average surface mass balance, such as after 2010 in Iceland, the proportion can be much larger.
The non-surface mass balance of south flowing outlet glaciers of Vatnajökull is likely to become more negative in the future due to calving into rapidly growing terminus lakes in overdeepened valleys.
Acknowledgments
Financial support for lidar mapping of glaciers in Iceland in 2008–2012 was provided by the Icelandic Research Fund, the Landsvirkjun (National Power Company of Iceland) Research Fund, the Icelandic Road Administration, the Reykjavík Energy Environmental and Energy Research Fund, the National Land Survey of Iceland, the Klima- og Luftgruppen (KoL) research fund of the Nordic Council of Ministers, and the Vatnajökull National Park. The acquisition of the Hofsjökull 2013 DEM was funded by AlpS GmbH and the University of Innsbruck. The acquisition of the Langjökull 2013 DEM was funded by NERC grant IG 13/12 and the DEM was provided by Ian Willis at the Scott Polar Research Institute. The work on estimating geothermal and volcanic power is based on funding from many sources, including the Research Fund of the University of Iceland, ISAVIA (the Icelandic Aviation Service), the Icelandic Road Administration and Landsvirkjun; logistical support has been provided by the Iceland Glaciological Society. We thank Sigurður Reynir Gíslason, at the University of Iceland, for sharing with us his knowledge of water temperature measurements in springs in the Icelandic highland, Snævarr Guðmundsson, at the Southeast Iceland Nature Centre, for providing us with unpublished estimates of the area of terminus lakes along the southern margin of Vatnajökull ice cap, Ragnar H. Þrastarson for drawing the location map, and Matthew J. Roberts who provided useful comments on the manuscript. We acknowledge the developers of the analysis and graphics package R (R Core Team, 2019) which we found very useful in the preparation of the paper. We also thank Miriam Jackson and an anonymous reviewer for constructive comments on the manuscript and Ken Moxham for help with the English language.


 Open access