


Introduction
Friction on snow and ice is of practical importance. Extensive work has been done in relation to skating and ski-ing. The relatively low value of the frictional coefficient between a solid material and snow or ice has been understood in terms of “self-lubrication" due to the presence of liquid water formed at the interface between a slider and snow or ice. It has been accepted by many authors that the theory of frictional healing is more applicable to the explanation of self-lubrication than the theory of pressure melting, but it appears that the accurate mechanism of friction on snow and ice remains ambiguous because of complicated factors involved.
Studies on friction on snow and ice have been made extensively in Japan as regards practical problems, among which the results on skis have been partly published under the title of Scientific study of skiing in Japan during the XI th Olympic Winter Games which was hosted in Sapporo in 1972. Since it is almost impossible to review all of the data available in this country, the present paper concentrates on recent studies on the friction of snow and ice with the aim of throwing light on the mechanism of friction occurring between the skis and snow as well as between the skate and ice.
Friction of Ski on Snow
The resistive force which a ski experiences from snow consists of two parts: the resistance due to ploughing and compression of snow at the top bend of ski, and that caused by friction between the sole of the ski and snow. Therefore, in order to measure the coefficient of kinetic friction between the sole of the ski and the snow, it is necessary to exclude the resistive force which the snow applies to the top bend of the ski. First of all, we shall show how much snow is compressed by the sliding of the ski.
(a) Change of stratification in Snow underlying a ski track
Following U. Nakaya and his co-workers, Reference HuziokaHuzioka (1957) demonstrated how snow is compressed by the top bend of ski. Figure 1 shows the profile of a snow cover made along the track of a ski. In order to identify the change of stratification of snow compressed by the ski, blue ink was sprayed onto the surface of the vertical snow profile. Many horizontal lines seen on the surface of the profile indicate original strata in the snow cover. The part of the snow compressed by the ski is shown by a bracket A, the boundary between the compressed and the undisturbed snow is represented by a thick broken line. Prior to coming into contact with the ski, the snow cover had been marked with vertical lines placed at 0.75 m intervals by means of a red iron oxide powder inserted into the snow cover. As seen in this figure, the top part of the vertical line E1 located directly underneath the top bend of the ski was bent straight toward the running direction of the ski, but the top part of the vertical line E2 was bent gradually. This demonstration indicates that the snow underlying the top bend of the ski was compressed homogeneously and thereafter the compressed snow suffered a shear due to the friction of the sole of the ski, and that the shear deformation in the compressed snow was completed while the top bend of the ski travelled from E2 to E1.

Fig. 1. Profile of snow compressed by running ski (after Huzioka).
As seen in this figure, the surface snow was compressed approximately 0.04 to 0.05 m in depth. According to observations of density of snow compressed by the ski, the value of the density of the undisturbed surface snow was 0.06 to 0.07 Mg/m3, but it increased to 0.16 to 0.17 Mg/m3 when the surface snow was buried under the top bend of the ski.
(b) Interfacial friction between a ski sole and snow
For the investigation of the frictional resistance between a ski sole and snow without any compression of snow at the top bend of the ski, it is convenient to use an annular plate or ring as a slider. Using the device shown in Figure 2, Reference HuziokaHuzioka (1958, Reference Huzioka1962) made measurements extensively of frictional resistance, varying the materials of the slider, temperatures and sliding velocities. A steel or methacrylic resin ring (0.2 m in outer diameter, 0.18 m in inner diameter) was mounted on a vertical rod suspended from a framework and brought into contact co-axially with the rotating surface of snow packed in a metal pan. The torsional moment induced by friction was recorded through an oscillograph. The resistance and the coefficient of kinetic friction could be calculated from the moment of force recorded. Using a steel ring as the slider, Huzioka found three types of oscillograms A, B and C as seen in Figure 3. The type A oscillogram was observed at relatively low sliding velocities. In this oscillogram, the electric motor started its rotation at the time A, and at the same time the resistive force began to increase rapidly with time although the snow pan still remained at rest. The moment the resistive force reached the maximum value f3 at the time B in the oscillogram, the snow pan suddenly began to slide, showing a rapid drop of the resistive force, thereafter f maintained a definite value f k. When the rotation of the snow pan was brought to a halt at the time D, the value of f k began to decrease gradually, suggesting that the shearing stress induced within the snow by friction started to relax with time. Hence, from this type of oscillogram it is obvious that the friction made by a slow sliding velocity causes the plastic deformation within the snow. The static and kinetic frictional coefficients could be calculated from the peak value f s and the steady value f k respectively.
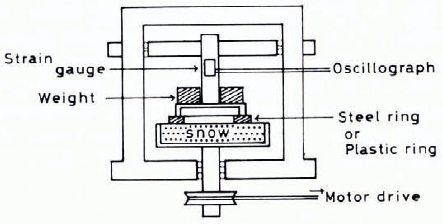
Fig. 2. Experimental device for measuring friction coefficients of snow.
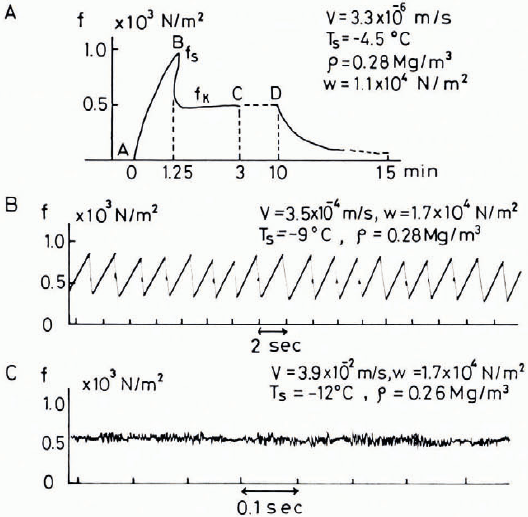
Fig. 3. Three types of oscillograms obtained at different sliding velocities.
When the sliding velocity was increased, oscillograms changed their features from the type A to the types B and C seen in Figure 3. The type B oscillogram was not observed at temperatures above —6°C. The zigzag variation of the resistive force seen in the type B suggests that the stick-slip friction occurred between the slider and snow. In this case, adhesion between the surface of the steel ring and the snow grains must be interruptedly fractured by the rotation. When the sliding velocity was raised again, small fluctuations in the value of f were recorded as seen in the type C oscillogram, implying that the amplitude of the variation in resistive force caused by the stick-slip friction was decreased with the increase of the sliding velocity. In case of the types B and C, the coefficient of the kinetic friction was calculated from the average value of the fluctuating resistive force.
Values of μ k for the steel ring are plotted in Figure 4 against the temperature of snow and the sliding velocity, using different, labels for the different types of friction observed. The number attached to an individual plot indicates the value of μ k. The thick and thin solid lines indicate respectively boundaries between different types of friction and contours of the coefficient of kinetic friction. It is interesting to note that the distribution of values of μ k seen in Figure 4 is very similar to that of the mode of fracture of snow columns being subjected to uniaxial compression under different temperatures and velocities.

Fig. 4. Distribution of values of μk plotted against temperatures and velocities (after Huzioka): XA-type, ⚪ B-type, ⚫ C-type.
Three different modes of fracture of snow columns are plotted in Figure 5 against the temperature and velocity of compression by using different labels Reference Kinosita and Ōura(Kinosita, 1967). Dotted and broken lines were drawn to group these plots into the regions A, B and C. A typical oscillogram showing the change of resistive force of a snow column being subjected to a uniaxial compression is shown schematically under each letter of the group. When a snow column was compressed under the conditions given in region A, it was compressed plastically without any fractures, but in region B snow behaved like a brittle material, the compression was accompanied by discernible fracture of snow grains; and in region C, the compression was associated with a continuous fracture of grains at both ends of the column. The difference in the force applied to snow between friction and uniaxial compression is that, unlike uniaxial compression, in the case of friction, snow is subjected to compression and shearing forces from a slider. It is well known that friction between two solid materials is accompanied by an abrasion (microscopic fracture) at the frictional interface. If it is assumed that the distribution patterns of μ k shown in Figure 4 indicate the difference in the mode of fracture of snow being subjected to friction, the following inference may be drawn from the similarity between Figures 4 and 5: the friction caused by the condition given in region A in Figure 4 is accompanied by a plastic deformation of snow without any fractures, but the friction in region B produces a discernible fracture of snow grains because of the slick-slip action of the slider; and in region C, the friction may be associated with a continuous fracture of snow grains, producing simultaneously small amount of lubricating water film at the interface between the slider and the snow. From inspection of Figure 4, it is roughly concluded that, if the sliding velocity is kept constant, the value of μ k decreases with the elevation of temperature, and that, if the temperature is kept constant, the value of μ k decreases with an increase of the sliding velocity, except for temperature near 0°C.
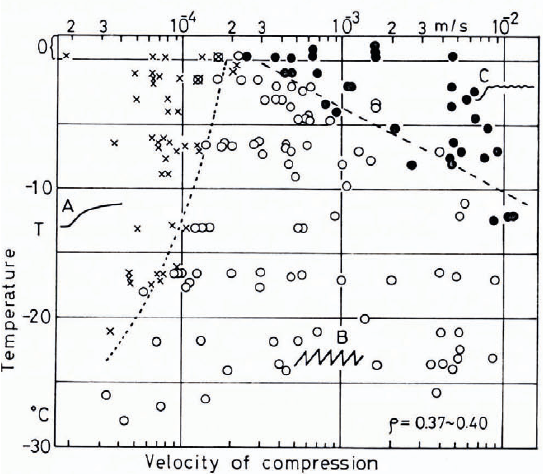
Fig. 5. Modes of fracture of snow columns subjected to uniaxial compression under various temperatures and velocities (after Kinosita) : X region A, plastically deformed, ⚪ region B, interruptedly fractured, ⚫ region C, continuously fractured.
The value of μ k for the plastic ring made of methacrylic acid resin was also measured as a function of temperature and sliding velocity. Similarly three types of oscillograms were observed and the mode of distribution of μ k plotted against the snow temperature and sliding velocity resembled that shown in Figure 4. It was found that values of μ k for methacrylic acid resin were frequently higher than those obtained for the steel ring.
(c) The real contact area between a slider and snow
One of the most ambiguous factors in friction research arises from the estimation of real contact area between a slider and a substrate. Since it was difficult to measure a real contact area between a metallic slider and snow, Huzioka tried to measure a real contact area between the flat glass surface and snow. A hexahedron of snow having the apparent contact area of 2 cm X 3 cm was brought into contact with the clean surface of a circular glass plate which can rotate against the snow specimen. The experiment was made at the temperature of −4°C for a sliding velocity of 6 X 10⁻² m/s by applying the normal load of 0.279 kg on the snow. The density of snow used was 0.34 Mg/m3. After friction for 5 min, the interface between the snow and the glass surface was carefully observed through a microscope. The real contact areas of snow grains created by the friction were found to be mirror-like flat surfaces as shown by s, t and u in A of Figure 6. As seen in this figure, minute air bubbles were entrapped at the interface of the real contact area. From the inspection of the apparent contact area of the specimen, the total number of contacts and sum of these real contact areas were found to be respectively 190 and 8.35 mm2. Since the density of snow is 0.34 Mg/m3, the volume percentage of ice grains in the snow is 0.34/0.92 = 37%, where 0.92 is the specific weight of ice. This means that 37% of the apparent contact area of the specimen was geometrically occupied by ice grains. Hence, the geometrical contact area of the snow specimen amounts to 600 mm2 x 0.37 = 220 mm2. If we lake the ratio of 8.35 mm2 to 220 mm2, it is concluded that the real contact area created by friction was only 3.8% of the geometrical contact area of ice grains.

Fig. 6. Photomicrograph of the frictional interfaces between snow and glass and methacrylic resin surfaces (after Huzioka).
A. s, t, u show real contact areas (glass).
B. icicles and flings produced by friction (methacrylic resin).
We shall estimate how much energy was consumed to melt snow during the 5 min friction, assuming that the real contact areas were created by frictional heating. Since the total number and the sum of the real contact area were respectively 190 and 8.35 mm2, the average value of the real contact area is 8.35 mm2/190 = 4.4 X 10⁻² mm2. If we assume that the shape of the real contact area is circular and that the circular areas were created by the melting of hemispherical asperities on ice grains, we can estimate the total mass of melted hemispherical asperities M, as follows:
The energy required to melt the total mass of hemispherical asperities can be written as Em = M(—cT+λ), where c is the specific heat of ice, T the temperature and λ the latent heat of fusion of ice. Putting c =2 kJ kg-1 deg-1, T =—4°C, λ = 335 kJ kg-1, we obtain Em= 0.216 J.
In this experiment, the frictional resistance, F, acting on snow specimen was measured to be approximately 0.98 N. Therefore, the total energy, Ef, required to slide the snow specimen on the glass surface for 5 min amounts to Ef = Fvt = 0.98 N x 6.9 x 10-2 m/s X 300 s = 20.3 J.
A comparison between Em and Em shows that the energy required to melt snow was only 1.1% of Ef This estimate seems to be rough, but it should be noted that only a small fraction of frictional energy was consumed to melt snow, and therefore most of it was transferred to the snow and the glass in the form of heat.
B of Figure 6 shows a frictional interface between the surface of methacrylic acid resin and snow. This picture was taken after friction at — 2°C with a sliding velocity of 9.7 X 10⁻² m/s for 5 min by applying a load of 0.25 kg. The arrow indicates the direction of sliding. As seen in this figure, melt water produced by the frictional heating was frozen as parallel icicles toward the sliding direction. The most remarkable Tact seen in this figure is that many ice filings produced by the friction gathered around ice grains. This fact means that the abrasion of ice grains occurred concurrently with the partial melting of grains, producing many filings.
(d) The coefficient of kinetic friction on practical skis
The measurement of μ k in the laboratory has to be limited in the range of sliding velocities used. Reference Kuroiwa, Kuroiwa, Wakahama, Fujino and Tanahashi.Kuroiwa and others (1969) tried to measure values of μ k for practical skis as a function of sliding velocity. A snow cover lying on a slope was artificially hardened to exclude the resistance which the top bend of skis experiences from snow. When the tangential force tending to slide a ski forward is balanced by the frictional resistance which acts on the sole of the ski and dynamic wind pressure on the skier, the velocity of the ski reaches a definite value (terminal velocity) allowing an estimate of μ k of the running ski. The measurement of the terminal velocity of the running ski was made using a photoelectric method. The change of μ k for both waxed and unwaxed polyethylene skis measured at temperature near 0°C for sliding velocities between 8 and 22 m/s are shown by solid lines in Figure 7. As seen in this figure, values of μ k of the waxed skis were found to be slightly lower than those for the unwaxed skis. In this figure, two values of μ k for “Perspex" skis (∎) obtained by Reference BowdenBowden (1953) and six values for a Teflon slider (x) measured by Reference ShimboShimbo (1961) are plotted for comparison with our data although their data were obtained in laboratories using miniature skis or annular sliders. As seen in this figure, values of μ k of practical skis increased with increasing sliding velocities. According to experiments made by Reference HabelHabel (1968), the frictional resistance (or μ k) of running skis also increased with increasing velocities (up to 27 m/s). The increase of μ k with increasing sliding velocities is not attributable to the increase of wind resistance acting on a skier, because the effect of the wind resistance was eliminated from the estimation of μ k The increase of μ k may be related to the increase of the real contact area between the sole of a ski and snow, but the precise interpretation of this problem awaits a future study.
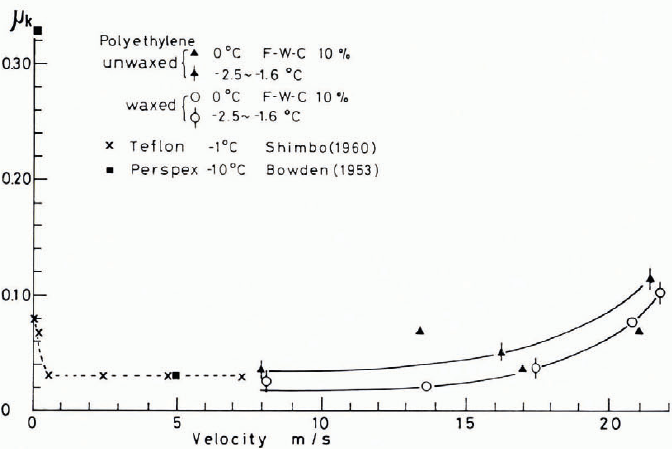
Fig. 7. Change of μ k of waxed and unwaxed skis against sliding velocities.
Sliding Friction between Skate and Ice
Since Reference Bowden and HughesBowden and Hughes (1939) proposed that the water film produced by frictional heating at the interface between a slider and ice may act as an effective lubricant to reduce the coefficient of friction, the concept of “self-lubrication" has been accepted as one of the most plausible interpretations of the friction of snow and ice. Recently, Reference Evans, Evans, Nye and Cheeseman.Evans and others (1976) developed Bowden and Hughes’ theory and concluded that the frictional heat used to melt ice is small and most of the heat flows from the contact area at the melting point into the slider and ice. A similar conclusion had already been reached by Reference HuziokaHuzioka (1962) through direct observation of the real contact area at the frictional interface.
It has been empirically accepted by many skaters that the sliding velocity of the skates decreases with decreasing temperatures of ice and it decreases again when the temperature is very close to the melting point or the surface of the ice rink is completely wetted. This skaters’ experience seems to suggest that there must be an optimum condition of the surface temperature of ice for skating. If the average time recorded for any speed skating event is good in relation to the fastest time ever recorded in the past meets for that event, it may be reasonable to assume that the ice of the skating rink where the event was held was in a good condition for the sliding of skates. To elaborate on this argument, Reference Kobayashi, Kobayashi, Nakawo and Shiji.Kobayashi and others (1970;Reference KobayashiKobayashi, 1973) defined the ratio R for an individual event as the ratio of the five best average times (converted to a distance of 500 m in events) to the best recorded time in past meets (also converted to a distance of 500 m events). They plotted values of R for various events during All Japan Championship Meets (1968 and 1969) against the temperature of the rink ice at which each event took place. In Figure 8, the length of horizontal bars indicates the range through which the temperature of ice changed in the course of an event, and the solid and broken lines show respectively values of R obtained in meets at Mizunami and Karuizawa skating rinks. The letters M and W followed by numbers labelled to horizontal bars show events respectively for men and women, the numbers the skating distance in the meets. From the definition of R, it will be obvious that the value of R must be larger than unity, unless the average time recorded by five best competitors coincides with the value of fastest time recorded in the past meets for the same kind of event. Therefore, values which approach 1.0 mean more suitable sliding conditions. As seen in Figure 8, the values of R were deviated more from unity in events which were performed on low temperature ice surfaces. However, it should be noted that the value of R obtained in the M5 000 m event at Karuizawa rink (see X in Figure 8) was very high in comparison with others and that this event was performed on a rink surface of ice covered with melt water. Therefore, if we extrapolate the solid and broken lines towards lower values of R, one can find that the best condition of ice to obtain the lowest values of R occurs when the temperature lies between –1°C and –2°C.
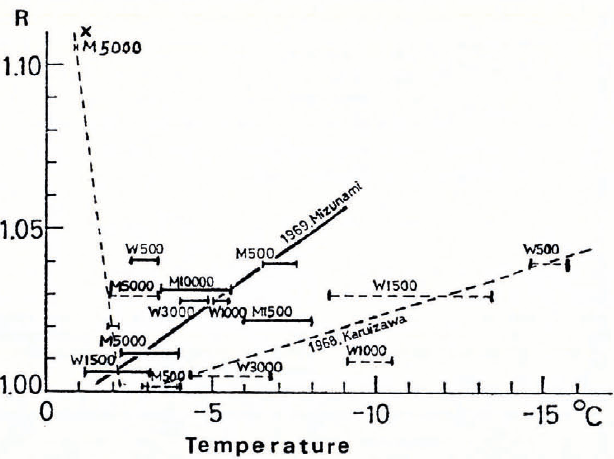
Fig. 8. Relation between R and temperatures of rink ice (after Kobayashi and others).
This interesting finding may be worth studying experimentally. To find a relationship between the sliding velocity of the skates and temperature of ice, Reference Kobayashi, Kobayashi, Nakawo and Shiji.Kobayashi and others (1970) designed an apparatus as shown in Figure 9. Two actual blades of speed skate, 400 mm x 1.2 mm, were mounted in parallel on hard plastic frame rigidly brazed with metal fixtures. Mounted on top of this frame were a 16 mm film movie camera and small light projector both focussed on the ice surface at the rear of one of the blades together with the dry cells necessary to drive them. The entire frame weighed 53 kg to simulate the skater’s weight. The skate-frame was ejected from a specially designed catapult at an initial speed 1.4 m/s as seen in B of Figure 9. Many pieces of aluminium tape were buried 3 mm under the surface of ice at 1 m intervals. As the skate-frame crossed a tape, the movie camera recorded the reflection of light from the projector, allowing the estimation of the sliding velocity of the skate-frame.

Fig. 9. Skate-frame and catapult (after Kobayashi and others).
The total distance travelled by the skate-frame, S, was plotted against the surface temperature of ice as shown in A of Figure 10. In this figure, curves a and b indicate respectively results obtained on the surface of natural lake ice at Tatenoumi and an artificial skating rink at Mizunami. As seen in this figure, both curves showed sharp maxima around –1°C to –2°C. This fact suggest that the coefficient of kinetic friction, μ k,between the skate and ice reached a minimum within the same temperature range, because the distance covered by the skate-frame is inversely proportional to the value of μ k. This result seems to support strongly the result shown in Figure 8.
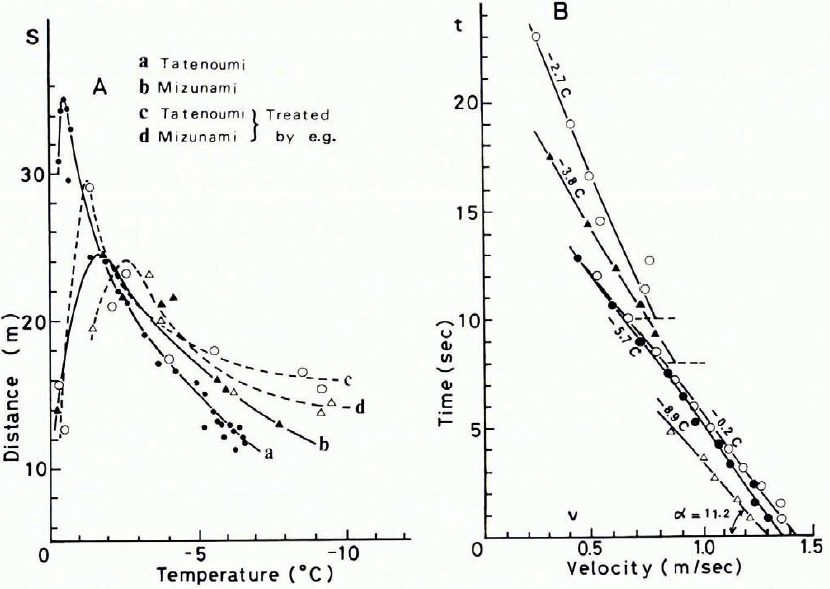
Fig. 10. Changes of distance travelled and velocity of a skate-frame plotted against temperatures (A) and time (B) (after Kobayaski and others).
Shown in B of Figure to is the change in velocity v of the skate-frame against the time t. As seen in this figure, the velocity of the skate-frame decreased linearly with time, implying that the value of μ k remained constant throughout the travel of the skate-frame despite its velocity changing from 1.5 to 0.5 m/s. This linear relationship may be true for the short range of velocity shown above. If the effect of wind pressure acting on the skate-frame is ignored, the relationship between v and t can be written
where g is the acceleration due to gravity, and v 0 the initial velocity of the skate-frame as catapulted. From the slope α of these straight lines, values of μ k could be estimated and are listed in Table 1.
TABLE I. COEFFICIENT OF KINETIC FRICTION μk

The following interesting test was made on the surface of the natural lake ice and artificial rink ice: the ice surface was treated with ethylene glycol which was sprayed onto the surface and wiped with a cloth, and then the skate-frame was catapulted. As seen in Figure 10 A, after this treatment, the distance covered by the skate-frame changed from a to c for the natural lake ice and from b to d for the artificial rink ice, and the temperature at which the maximum of S appears shifted toward the low temperature range. If we note the change of S measured at lower temperatures, it is seen that S was increased after the ethylene glycol treatment which suggests that values of μ k were reduced by coating the ice with ethylene glycol. Since this compound can melt ice, the reduction of μ k can be attributable to the existence of water in the liquid phase on the ice surface as a lubricant. Ethylene glycol was not only effective in reducing the high value of μ k on the low temperature ice, but also in preventing frost from forming on the ice surface.
Concluding Remarks
Experimental results of friction on snow and ice obtained by various authors were reviewed in relation to ski-ing and skating. The great difference between snow and ice regarding friction on them is that snow is a compressive substrate for sliding, but ice is not. As for the friction of skis on snow, the first studies concerned how snow is compressed under the running skis and revealed the change of snow stratification underneath the ski track; secondly experiments were made on friction between the sole of a ski and snow as a function of temperature and velocity by using a steel or methacrylic acid resin ring as a slider. The conclusion was that, when the friction on snow was made at temperatures higher than–10°C and at rates less than 10-4 m/s, the friction was caused by plastic deformation in snow, but when the temperature was lowered below –10°C or the rate of friction was increased to more than 10-3 m/s, the friction was associated with fractures and partial melting of ice grains due to frictional healing as shown in Figure 6. These results do not conflict with those obtained by Reference Barnes, Barnes, Tabor and WalkerBarnes and others (1971) on the friction of ice.
As regards skating on ice, measurements of the coefficient of kinetic friction, μ k, were made on natural lake ice and artificial rink ice by using a specially designed device. The distance S travelled by the skate-frame catapulted on the ice surface showed maximum around –1 to –2°C as shown in Figure 10A. This feature of the variation of S with the surface temperature of ice may be explained by the theory developed by Reference Evans, Evans, Nye and Cheeseman.Evans and others (1976). The decrease of S with lowering ice temperature may be attributable to the increase μ k due to losses of frictional heat to the skate and ice, and the decrease of S near 0°C may be related to the increase of the contact area between the skate blades and ice. Since the temperature of the air was usually several degrees higher than 0°C whereas the surface temperature of the rink ice was very near the melting point, it was inevitable that some heat flowed from the air into the ice through the blades to melt the ice. This excess heat flow and softening of ice caused the decrease of S at and near 0°C. However, it should be noted that the value of μ k obtained by Reference Kobayashi, Kobayashi, Nakawo and Shiji.Kobayashi and others (1970) was surprisingly low in spite of the fact that the measurement was made on a virgin ice surface where the friction includes the effect of ploughing.
Treating the surface of ice with ethylene glycol showed that the existence of liquid lubricating film is not only important in reducing high values of μ k at low temperatures, but is also effective for preventing frost formation on the surface of rink ice.
The author is indebted to Drs T. Huzioka, S. Kinosita and T. Kobayashi for their kind permission to use their valuable data and Mr Tusima for his kind assistance in the preparation of this paper.
Discussion
L. LLIBOUTRY: In spite of your splendid work, much remains to be done especially for high velocities— those which are of interest for ski-ing and skating competitions. We could not obtain financial support from the ski manufacturers. How did you fare?
D. KUROIWA: The funding problem is indeed very difficult; we did not obtain support from commercial interests either.
E. R. LACHAPELLE: In contrast to the preceding paper it would seem that the waxing of skis is still an art rather than a science.
J. V. DANYS: In view of your tests, which friction theory would be most in line with your findings? A customary friction theory (friction force proportional to normal force, independent of the contact area, velocity and temperature) or a non-customary (non-classical), assuming that surfaces have protrusions and that friction is produced by adhesion (Bowden), or assuming loose swivelling of the surface molecules (Niven), a water film or a vapour film.
KUROIWA: In the case of slow sliding velocities, adhesion theory is the most appropriate, whereas in the case of high sliding velocities then a lubricating water film should be assumed.
M. DE QUERVAIN: In outdoor experiments the temperature of the very surface determined by the complete heat balance (including the radiation balance) is responsible for the friction coefficient. How have these temperatures been measured ?
KUROIWA: The snow surface temperature was measured using a thermocouple arrangement.
D. J. GOODMAN: In the first experiment you described, do you think the boundary between the two mechanisms (B and C) may depend on the stiffness of the apparatus, and so there may not be two separate regimes of stick-slip ?
KUROIWA: I agree that this is a possibility.


