


1. INTRODUCTION
Surface albedo, which controls the surface shortwave radiation balance, is a fundamental parameter in climate models (Guo and others, Reference Guo, Wang, Jiang, Mao and Wu2013). An investigation found that the rapid increase in water temperature in Superior Lake is caused by a positive ice-albedo feedback (Austin and Colman, Reference Austin and Colman2007). Ice cover can increase the lake surface albedo and thus decrease the absorbed solar radiation (Ingram and others, Reference Ingram, Wilson and Mitchell1989). Conversely, the melting of ice is mainly determined by the solar radiation absorbed by the lake (Efremova and Pal'shin, Reference Efremova and Pal'shin2011). Melting in advance of lake ice can lead to an earlier establishment of the summer thermocline, which accelerates the warming of the upper water body (Austin and Colman, Reference Austin and Colman2007; Hampton and others, Reference Hampton2008; O'Reilly and others, Reference O'Reilly2015).
Previous studies have shown that lake ice albedos range from 0.10 to 0.60 (Bolsenga, Reference Bolsenga1969; Heron and Woo, Reference Heron and Woo1994; Gardner and Sharp, Reference Gardner and Sharp2010; Semmler and others, Reference Semmler, Cheng, Yang and Rontu2012; Svacina and others, Reference Svacina, Duguay and King2014). However, low lake ice albedos (<0.2) have been reported by only a few studies (Bolsenga, Reference Bolsenga1969; Pärn and others, Reference Pärn, Jaatinen, Erm, Leppäranta and Lei2011). Lake ice albedo is associated with many factors, such as the solar zenith angle, ice type (Bolsenga, Reference Bolsenga1977, Reference Bolsenga1983), bubble and impurity contents (Gardner and Sharp, Reference Gardner and Sharp2010), ice thickness (Mullen and Warren, Reference Mullen and Warren1988) and the cloud cover (Warren, Reference Warren1982). According to Pirazzini (Reference Pirazzini2009), there are currently three main types of lake ice-albedo parameterization schemes. The simplest type uses a few specified constant values, such as LAKE 2.0 model (Stepanenko and others, Reference Stepanenko2016). Another type depends on the surface temperature, such as FLake model (Mironov and others, Reference Mironov2010). A more complex type also considers snowfall, snow/ice thickness and other factors, such as the Canadian lake ice model (Svacina and others, Reference Svacina, Duguay and King2014). Most schemes are developed based on the early high-latitude sea or lake observations or are even derived from sea ice models. Early in our investigation, based on MODIS products, we found that these schemes severely overestimate the ice albedos of the Tibetan Plateau (TP) lakes. In high-latitude lakes, the ice surfaces are often covered with snow due to the humid climate and weak solar radiation. The effect of albedo error is largely diluted by snow cover. However, there is often little snow on the lake ice in the TP due to strong solar radiation and a dry climate. Inaccurate ice albedo can lead to larger biases in the simulation of the lake temperature (Hall and Qu, Reference Hall and Qu2006; Svacina and others, Reference Svacina, Duguay and King2014).
The TP lakes, with a total area of 4.7 × 10⁴ km2 (Zhang and others, Reference Zhang, Yao, Xie, Zhang and Zhu2014), are sensitive to climate change and have an important influence on the water resources of Asia (Zhang and others, Reference Zhang2017). Recently, observation studies of the TP lakes have increased significantly (Biermann and others, Reference Biermann2014; Li and others, Reference Li2015; Huang and others, Reference Huang2016; Kirillin and others, Reference Kirillin, Wen and Shatwell2017; Wang and others, Reference Wang, Ma, Ma and Su2017). However, little attention has been paid to ice-albedo observation, due to the harsh environment in winter. In February 2017, a field experiment aiming to investigate the radiation budget of lake ice surface, including the in situ and mobile observations, was carried out in Ngoring Lake in the eastern TP. Mobile observation can enlarge the spatial representation of the observation, and make it easier to compare with the remote-sensing product. Compared with a previous similar study (Hudson and others, Reference Hudson, Granskog, Karlsen and Fossan2012), we adopted a mobile platform of hollow steel frame and reduced its interference with the albedo observation. In this study, we introduce this experiment and data in Section 2, and evaluate the applicability of MODIS albedo products as well as the ice-albedo parameterization schemes in the TP lakes using experimental data (Section 3). In Section 4, the effectiveness of the albedo observations and the influence of the ice albedo on lake simulation are discussed. Finally, in Section 5, the conclusions are presented.
2. STUDY AREA, FIELD EXPERIMENT AND DATA
2.1. Study area and field experiment
Ngoring Lake (4274 m a.m.s.l.) is located in the Yellow River source region of the eastern TP, with a mean depth of 17 m and a surface area of 610 km2, which is the highest large fresh water lake in China. The Ngoring Lake basin is characterized by a cold and semi-arid continental climate. From early December to early April, the lake is usually completely ice-covered, and the average precipitation is only 28.16 mm (year 1954–2014). Our data show that the observed thickest ice is ~0.7 m in 2013 and 2016 and typically appears in late February.
From 10 February to 18 February 2017, a field experiment was carried out over western Ngoring Lake (Fig. 1). The in situ observation station (IOS) was placed on the ice surface 240 m from the lakeshore (34.905°N, 97.571°E), where the ice thickness was 0.6 m. Turbulent fluxes, radiation components and standard atmospheric variables were measured at IOS. A mobile observation platform (MOP) was used to measure the radiation balance of the ice surface over larger region (Fig. 2). Both the IOS and MOP used the Kipp & Zonen CNR4 four-component net radiometer to measure the broadband downward and upward shortwave and longwave radiations at heights of 1.20 m (IOS) and 1.60 m (MOP), respectively. For the IOS, the CNR4 measured once per minute and output a group of average data every 30 min. For the MOP, the CNR4 measured once per 10 s and output a group of average data every 60 s. The MOP had a built-in GPS sensor, which can record the instrument position in real time. In addition, a four-rotor unmanned aerial vehicle (UAV) was used to take aerial photos (Fig. 3d) with a maximum flight height of 500 m.

Fig. 1. The IOS on the ice surface (a), the aerial photo of the IOS using the UAV (b) and its location (the yellow five-pointed star) (c).

Fig. 2. Photos and albedos of different types of lake ice from the MOP.

Fig. 3. The aerial photos of the lake ice at 10 m (a), 100 m (b) and 500 m (c, d) heights using the UAV. The UAV took the first three photos (a, b, c) looking straight down from the belly of the UAV over the same place, and the fourth photo (d) was taken in an approximate horizontal direction. A photo of the UAV is added to the top right-hand corner of Figure 3d.
2.2. DATA
2.2.1. Observation data
The ice surface temperature can be estimated from the downward and upward longwave radiation measurements by
 $$T_{\rm s} = \left[ {\displaystyle{{Rl_{{\rm up}} - \left( {1 - \varepsilon} \right)Rl_{{\rm dw}}} \over {\varepsilon \sigma}}} \right]^{0.25}. $$
Here,σ (=5.67 × 10⁻⁸ W m−2 K−4) is the Stefan–Boltzmann constant; Rl dw and Rl up are the downward and upward longwave radiations, and T s is the ice surface temperature. Following Wilber and others (Reference Wilber, Kratz and Gupta1999), a surface emissivity ε of 0.99 is employed in Eqn (1). There is some uncertainty in the surface emissivity of ice. However, a sensitivity test in this study indicates that its small fluctuations (from 0.97 to 0.99) have little effect on the surface temperature (the maximal difference is only 0.64 °C). T s is employed in the parameterization scheme to obtain the model-derived ice surface albedo. During the observation period, clear ice was dominant, but sporadic snow cover could also be found (Fig. 2). The in situ observation began on 10 February and ended on 18 February. For the mobile observations, the wind speed increased too much in the afternoons and threatened the safety of observers, so measurements were carried in the late mornings (local time 10:00–12:00) of 11, 12, 14, 15, 16 and 17 February. During this period, the solar zenith angle is <60°, and the influence of its variation on albedo can be approximately ignored. In addition, the observation data for water temperature in Ngoring Lake from 22 September 2015 to 21 September 2016 are also used in this study to evaluate simulation results from LAKE 2.0 model (Section 2.4).
2.2.2. MODIS products
The MODIS albedo products used in this study are the MOD10A1/MYD10A1 V006 daily albedos, the MCD43A3 16 d albedo and the quality assurance product MCD43A2, which determines whether the albedo is recorded for a snow-covered pixel. The MOD10A1(Terra)/MYD10A1(Aqua) products include the snow/ice albedo and the fraction of snow cover at a spatial resolution of 500 m (Hall and Riggs, Reference Hall and Riggs2007). The MCD43A3 product combines the albedo retrievals from the Terra and Aqua satellites at a 500 m spatial resolution. The latest version (V006) of MCD43A3 is updated every day, and uses the current day's snow status instead of the majority snow/no-snow status from the 16 d period in the V005 version (https://lpdaac.usgs.gov/dataset_discovery/modis/modis_products_table/mcd43a3_v006). The clear sky is dominant during the observation period. The MOD10A1/MYD10A1 products are retrieved exclusively under clear-sky conditions. For the MCD43A3, the black sky albedo is used for this study because it represents the albedo under clear-sky conditions. In this study, the MOD11A1/MYD11A1 surface temperature products are also used to evaluate the simulation results.
2.3. Lake ice-albedo parameterizations
Many parameterization schemes of the lake ice albedo have been developed and have varying degrees of complexity. In the Weather Research and Forecasting (WRF) Model, the lake ice albedo of a completely frozen lake is 0.6. In the 1-D lake model LAKE 2.0 (Stepanenko and others, Reference Stepanenko2016), the ice albedo is also 0.6. Temperature-dependent albedo schemes usually have a minimum and maximum albedo values, respectively, corresponding to the melting conditions and to the surface temperatures below a certain threshold. These schemes mainly originate from the observations of sea ice or glaciers (Ross and Walsh, Reference Ross and Walsh1987; Brock and others, Reference Brock, Willis and Sharp2000; Pirazzini and others, Reference Pirazzini, Vihma, Granskog and Cheng2006). The ice surface albedo (a i) scheme in FLake model is derived from a sea ice model (Mironov and Ritter, Reference Mironov and Ritter2004):
 $$a_{\rm i} = a_{{\rm max}} - \left( {a_{{\rm max}} - a_{{\rm min}}} \right)\left[ {{\rm exp}\left( { - \displaystyle{{95.6\left( {T_{\rm f} - T_{\rm s}} \right)} \over {T_{\rm f}}}} \right)} \right]{\rm \;,} $$
where a max is set to 0.60, referring to the albedo of white ice or snow ice, and the blue ice albedo (a min) is equal to 0.10. As T s approaches the freezing point (T f), the albedo moves toward 0.10 based on Mironov and others (Reference Mironov2010). In the WRF-FLake model (Mallard and others, Reference Mallard, Nolte, Bullock, Spero and Gula2014), the white ice or snow ice (a max) is set to 0.80; other variables remain unchanged.
In some models, a separate dependency of albedo on surface temperature is prescribed for visible and near-infrared wavelengths (Roesch and others, Reference Roesch, Wild, Pinker and Ohmura2002). In the Community Land Model (CLM) version 4.5 (Oleson and others, Reference Oleson2013), the lake ice albedo without resolved snow layers is similar to that of FLake:
 $$a_{\rm i} = a_0 - \left( {a_0 - 0.10} \right)\left[ {{\rm exp}\left( { - \displaystyle{{95\left( {T_{\rm f} - T_{\rm s}} \right)} \over {T_{\rm f}}}} \right)} \right].$$
The albedo at cold temperatures a 0 is 0.60 for visible and 0.40 for near-infrared radiation. For frozen lakes with resolved snow layers, the reflectance of the ice surface is fixed at a 0. In the General Lake Model (GLM) 2.0 (Hipsey and others, Reference Hipsey, Bruce and Hamilton2014), the ice surface albedo is a function of surface temperature and ice thickness (Svacina and others, Reference Svacina, Duguay and King2014):
 $$a_{\rm i} = \left\{ {\matrix{ {c_1 h_{\rm i}^{0.28} + 0.08\; \; \; \; \; \; \; \; \; T_{\rm s} \lt T_{\rm f}} \cr {{\rm min}\left( {a_{{\rm mi}}, c_2 h_{\rm i}^2 + a_{\rm w}} \right)\; \; \; \; \; \; \; \; T_{\rm s} = T_{\rm f} \;} \cr}} \right.\;, $$
where a w is the albedo of open water (0.05), a mi is the albedo of melting ice (0.55), h i is the ice thickness (m), c 1 is a constant equal to 0.44 m−0.28 and c 2 is a constant equal to 0.075 m−2.
2.4. LAKE 2.0 model
LAKE 2.0 is a 1-D lake model for solving horizontally averaged equations for heat, gases and momentum transport (Stepanenko and others, Reference Stepanenko2016). In this model, the near-infrared solar radiation is consumed completely at the water surface, whereas the visible solar radiation is partially reflected according to water albedo, and its remainder attenuates with depth according to an extinction coefficient specific for the lake. In this study, the extinction coefficient for water is set to be 0.15 referencing the observation result from Nam Co Lake in the TP (Nima and Zhuo, Reference Nima and Zhuo2012). LAKE 2.0 model also includes multilayer snow and ice modules (Stepanenko and Lykossov, Reference Stepanenko and Lykossov2005; Stepanenko and others, Reference Stepanenko, Machul'skaya, Glagolev and Lykossov2011). In LAKE 2.0, several different turbulent mixing parameterizations can be selected. In this study, we use a standard k-ε (K-epsilon) parameterization scheme to calculate eddy diffusivity. The inflow and outflow of the lake are disregarded, because of their small effect on the water balance of Ngoring Lake.
3. RESULTS
3.1. Daily cycle of the albedo
The peaks of the downward shortwave radiation exceed 800 W m−2 during most days (Fig. 4a), with a maximum value of 899.13 W m−2, which is even greater than the maximum solar radiation observed in the high-latitude lakes in summer (Rouse and others, Reference Rouse2003). The upward shortwave radiations are all <90 W m−2 except for that on 11 February. In contrast, the upward longwave radiation is significantly greater than the downward longwave radiation. The daily mean downward and upward shortwave radiations are 204.20 and 24.75 W m−2 from 11 February to 17 February, respectively. The downward and upward longwave radiations are 172.04 and 268.59 W m−2, respectively. The mean net radiation (79.29 W m−2) is obviously less than that in summer (178.01 W m−2), but greater than that before the lake freezes in the early winter (24.11 W m−2) (Li and others, Reference Li2015). Generally, strong downward shortwave radiation means that a slight variation in albedo can cause a drastic change in the energy absorbed by the lake. The ice surface albedo can reach ~0.30 after sunrise and before sunset, and decreases to 0.08–0.09 around noon. This albedo is clearly lower than that reported previously (Zdorovennova and others, Reference Zdorovennova, Zdorovennov, Palshin and Terzhevik2013; Svacina and others, Reference Svacina, Duguay and King2014), especially when the ice is thick (0.6 m). Note that the ice structure (with a radius of 0.45 m) below the radiation bracket at IOS is partly broken during installation, which causes some original blue ice to become white because of intruded air bubbles. The overestimation of the albedo due to this phenomenon should be slight because it is not directly beneath the CNR-4 sensor and only covers a small area.
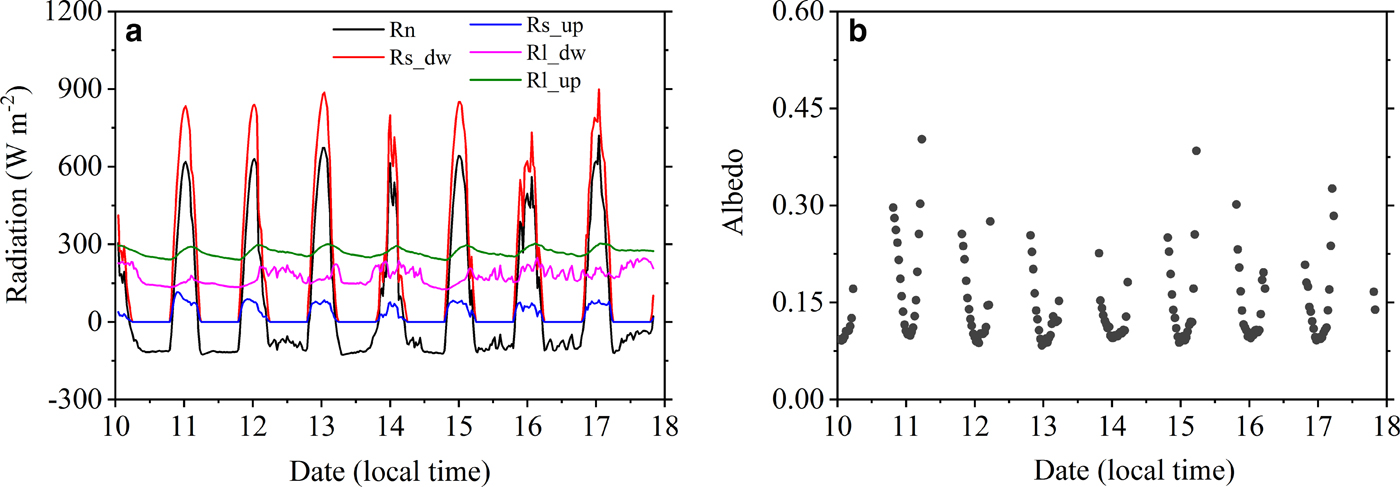
Fig. 4. Daily cycles of the radiation components (a) and the ice surface albedos (b) from the IOS in February 2017 (the dates in the horizontal axis are days of February). (Rn: net radiation; Rs_dw and Rl_dw: downward shortwave and longwave radiations; Rs_up and Rl_up: upward shortwave and longwave radiations).
3.2. Mobile observation of the albedo
Based on the GPS and radiation data, the observation paths and albedos are presented in Figure 5. The maximum observation range is ~630 m in the meridional direction, and 960 m in the latitudinal direction, which is larger than a MODIS pixel. We obtain 529 groups of valid data within 6 d.
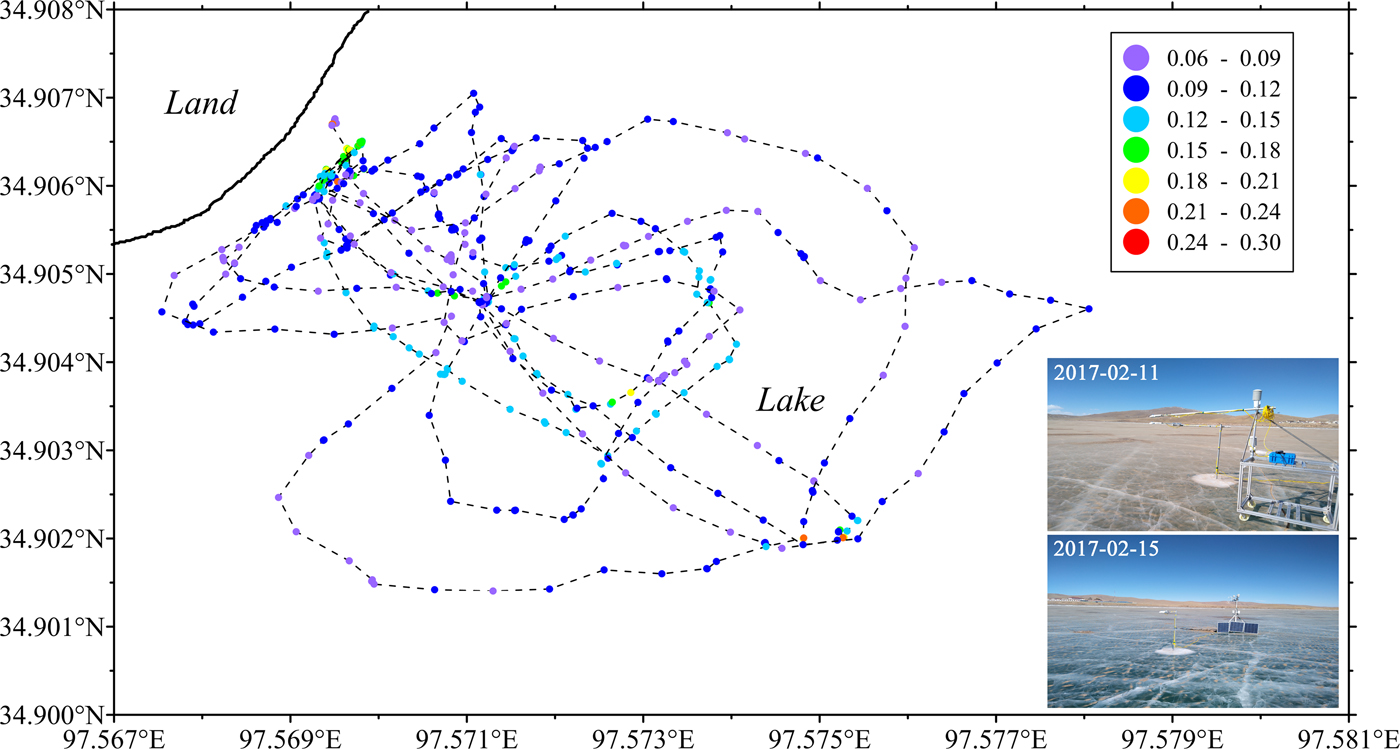
Fig. 5. Spatial distribution of the ice surface albedo using the MOP data of 6 d (photos of ice surface on February 11 and 15 are displayed in the lower right corner).
Although the ice surface is relatively flat, its radiation budget is still affected by many processes that occur at small scales (order of 1–10 m), such as the existence of air bubbles, cracks, dust, variations of ice color, thickness and water depth. Therefore, the MOP walks randomly across the ice. On an ordinary ice surface, the MOP moves slowly at ~0.5 m s−1. However, when encountering a characteristic ice surface (e.g. the blue ice, white ice, crack ice, bubble ice, the ice covered with dust or snow), the MOP will stay on the ice for 3–4 min, in order to obtain the typical albedo value of that type of ice. This kind of specific observation accounts for ~15% of the total MOP data. As shown in Figure 5, the lake ice albedos are <0.12 for most areas. The albedos at the clear blue line (0.12–0.15) are relatively high, which may be associated with the relatively large amount of dust that covered the ice on 11 February (photo is inlaid in Fig. 5). The albedos above 0.15 usually come from the stationary observations of the ice covered with patched snow or dust. As shown in Figure 6, the albedo samples ranging from 0.08 to 0.12 account for 65.41% of the total MOP data, and 42.72 and 72.21% of the samples are <0.10 and 0.12, respectively. Further, 93.38% samples are below 0.16. For the statistic characteristics of the albedos in each interval, both the median lines and the mean values are left of the 0.08–0.10, 0.10–0.12 and 0.12–0.14 intervals and toward the lower albedos.
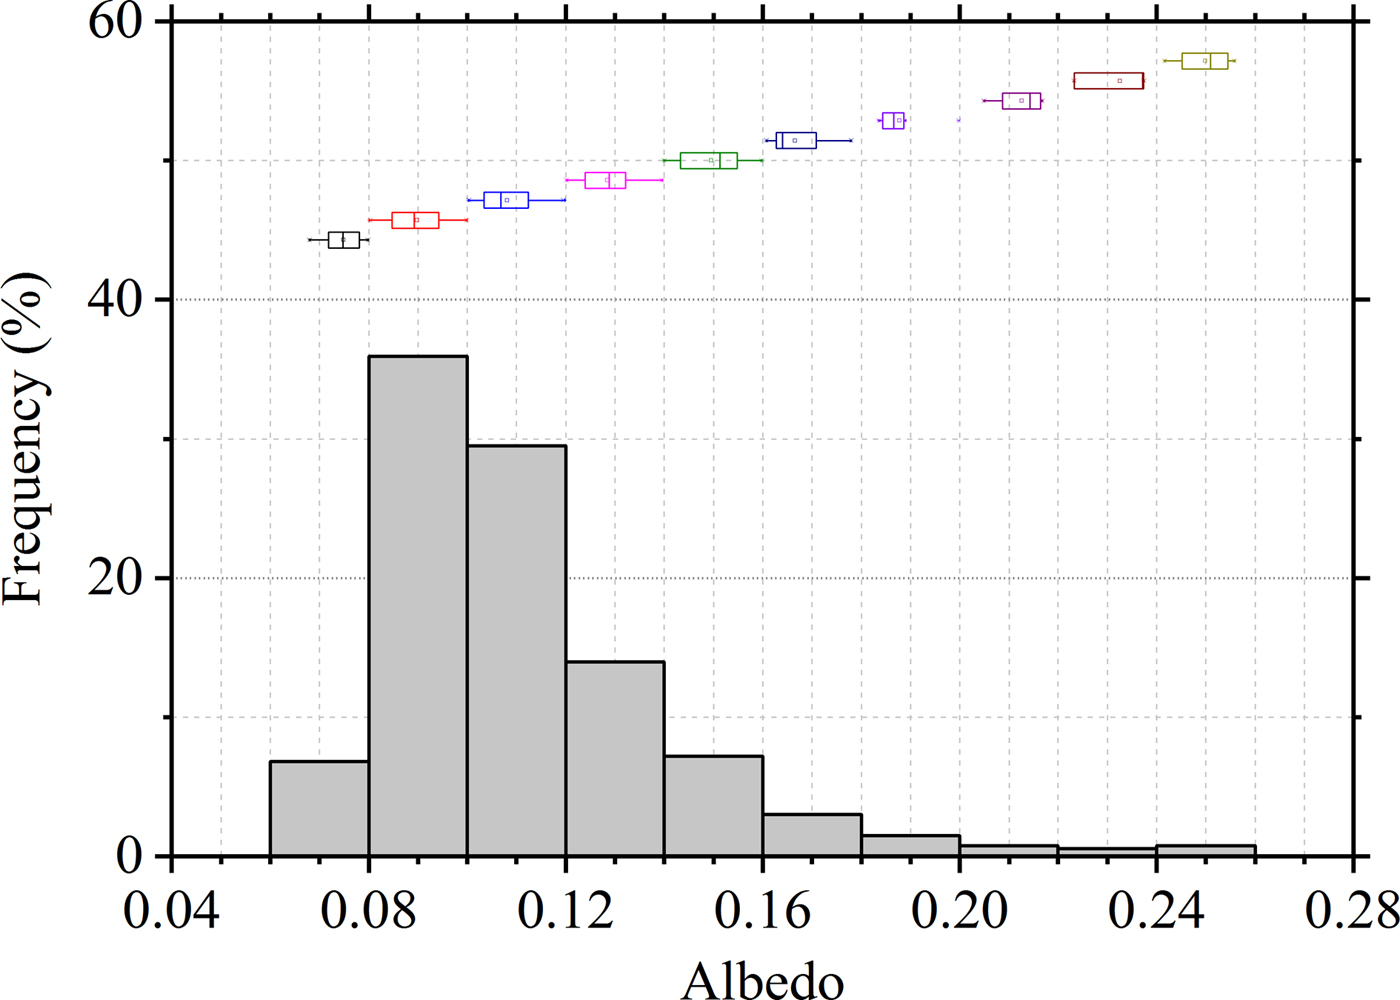
Fig. 6. Frequency distribution of the albedos from the MOP over 6 d. The center of each box represents the median value, the edges of each box indicate the 25th and 75th percentiles, and the whiskers represent the 5th and 95th percentiles of the distributions.
Photos of six typical types of lake ice and their albedos are presented in Figure 2. The albedo of the relatively clean blue ice is only 0.075 (Fig. 2a), which is very close to the water surface albedo in Ngoring Lake (0.04–0.05) (Li and others, Reference Li2015). The cracked ice is a little white due to intruded air bubbles, and its albedo is ~0.106 (Fig. 2b). The ice near the lake shore usually contains a few small snow patches, and the water is shallow (the lake-bottom sediment is visible). Therefore, the albedo is obviously high (0.155) (Fig. 2c). When the ice is covered with dust and the cracks are obvious, the albedo (0.119) is higher than that of clean blue ice (Fig. 2d). Part of the ice surface is full of tiny wavy wrinkles, and sand or sediment is easily gathered. Its albedo is ~0.135 (Fig. 2e). Note that the viewing angle of the downward-looking shortwave radiation sensor is up to 150°, and the observation radius below the sensor can reach 5.97 m when the sensor height is 1.60 m. This range is significantly greater than that of the sediment patches, although the upward shortwave radiation from the area directly below the sensor has a stronger effect than the marginal area. By the same token, the albedo of the ice surface covered with snow patches is only 0.212 (Fig. 2f), which is much lower than that of snow.
3.3. MODIS albedo products evaluation
A wider range of lake ice albedos can only be acquired via remote sensing. However, it is also difficult to match the locations in the MODIS data due to many missing values. Therefore, all available MODIS data over Ngoring Lake are collected. From the EOSDIS Worldview image, the snow-covered area gradually decreases from 5 February to 18 February. For MOD10A1/MYD10A (Fig. 7a, b), only the data with snow coverage ratio of <15% per pixel are used, which is approximatively considered as a snow-free pixel. Based on the MCD43A2 product, the MCD43A3 data can be divided into snow-free (Fig. 7c) and snow-covered albedos (Fig. 7d).
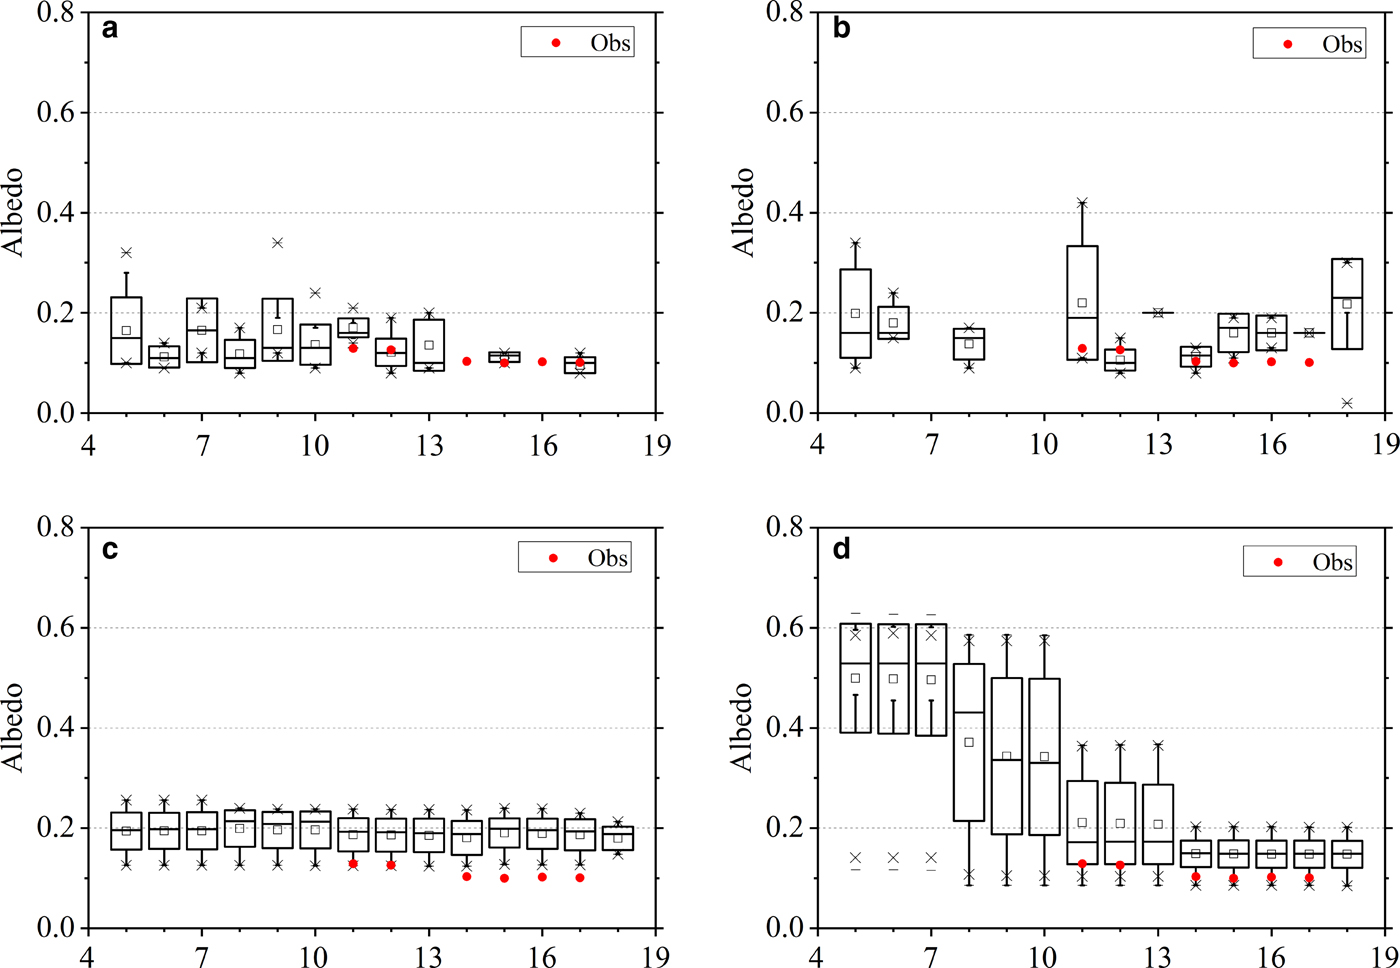
Fig. 7. The snow-free ice surface albedos (box chart) from the MOD10A1 (a), MYD10A1 (b) and MCD43A3 (c), and the ice surface albedo with snow cover from MCD43A3 (d) in February 2017 (the dates in the horizontal axis are days of February). Daily mean ice surface albedos from MOP are marked with the solid red dots.
Overall, the MOD10A1 products have the best agreement with the observations (Fig. 7a), followed by the MYD10A1 (Fig. 7b). The daily mean albedos measured by the MOP range from 0.10 to 0.13, and the mean values from MOD10A1 range from 0.09 to 0.17, with a maximum value of 0.28 and a minimum value of 0.08 (excluding outliers). Given that the MOD10A1 albedo may contain the effects of sporadic snow cover in some pixels, this result is appropriate. The albedos from MYD10A1 range from 0.10 to 0.22, and the data are more discrete than those of MOD10A1. For the ice with snow-free flags in MCD43A2, the corresponding albedos from MCD43A3 range from 0.18 to 0.20. The albedos during several adjacent dates are very close in the MCD43A3 because it is updated every day, but it still is a 16 d albedo product. The snow-covered ice-albedo values range from 0.15 to 0.50 and quickly reduce with decrease in snow cover (Fig. 7d). However, the albedo of ice covered with snow is lower than that of the snow-free ice from 14 February to 18 February (Fig. 7c, d), which means that the accuracy of the snow flag in MCD43A2 is not enough. This also may happen because the snow flag uses the current day snow's status, but the albedo contains information of 16 d. Their time windows are inconsistent.
3.4. Albedo parameterization schemes evaluation
Compared with MODIS products, the differences in the albedo between the parameterizations and the observations are much larger (Fig. 8). In WRF and LAKE 2.0, the lake ice albedos are fixed at 0.6, respectively. The ice albedos in the other schemes generally decrease with increasing surface temperatures. The albedos from CLM4.5 for the near-infrared radiation (CLM4.5/0.4) are all <0.40 and are even <0.15 when near the freezing point, which is the closest to those observed. The second closest is the FLake model. The ice albedo from GLM 2.0 is constant (0.6) when the surface temperature is lower than −5 °C, and there is a linear relation between them when the surface temperature is −5 °C or above. The most significant deviation exists in the WRF-FLake. The ice albedo from WRF-FLake rapidly decreases with increasing surface temperature. From all the schemes, it has the largest albedo amplitude, ranging from near 0.80 at 255.37 K to 0.22 at 272.64 K. There is no significant correlation between the observed ice albedo and the surface temperature, which may be partly related to the short observation time, during which the ice thickness and albedo change very little, but the surface temperature shows an obvious daily cycle. In fact, the data employed by previous temperature-dependent albedo schemes were temporally averaged quantities as daily means or monthly means (Roesch and others, Reference Roesch, Gilgen, Wild and Ohmura1999), and spatially averaged satellite-derived albedo (Ross and Walsh, Reference Ross and Walsh1987). Therefore, rapid variations in the surface temperature were smoothed out and cannot reproduce the diurnal cycle of albedo. If the observation period were longer, the daily mean albedo and surface temperatures would be employed, and the results could be improved. However, this improvement is very slight, because the distribution of the albedo with the ice surface temperature is very scattered in the data used in parameterization development (Ross and Walsh, Reference Ross and Walsh1987). This means that the temperature alone is not sufficient to explain the albedo variability. We further checked the dependence of the ice albedo on the surface temperature in Ngoring Lake using MODIS products (MOD11/MYD11 land surface temperature product and MCD43A3 albedo product) from December 2012 to April 2015. The distribution of the ice albedo with the surface temperature is also very scattered and the correlation coefficient is −0.13. Therefore, even at long time scales, the dependence relation between the albedo and the temperature is unclear. Using the IOS, data show that the ice albedo generally decreases with rising surface temperatures, but this may be due to the solar zenith angle, which is a main factor affecting the daily cycle of the ice albedo. The ice albedo is concentrated at <0.15 when the solar zenith angle is <60°. This means that the times selected for the MOP were appropriate.
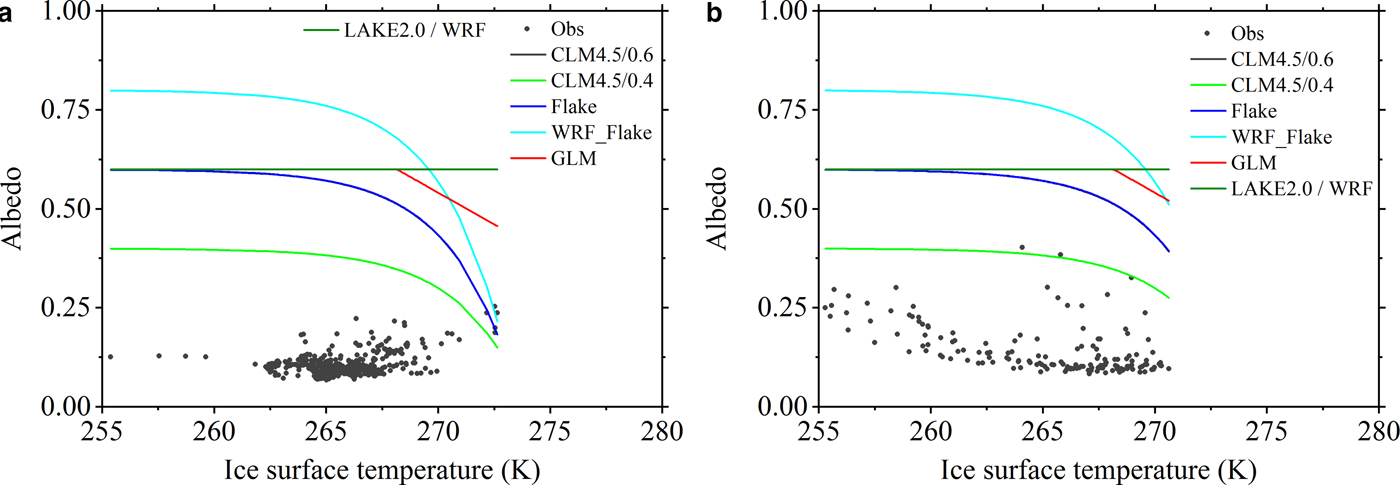
Fig. 8. The relationship between the albedo and the ice surface temperature from the different parameterization schemes using the MOP (a) and the IOS (b) data.
4. DISCUSSION
4.1. Influence of the observation scale
For the aforementioned differences between the MODIS and the ground observations, in addition to instrument error and the MODIS product algorithm, an inconsistency in their spatial scales is also a key factor. In recent years, some field experiments have tried to bridge the ground observation and remote sensing by establishing an observational network composed of many stations (Li and others, Reference Li2013; Yang and others, Reference Yang2013; Liu and others, Reference Liu2016). In this study, a mix of the IOS and MOP expands the representation of the albedo observations. However, a few differences in the view due to difference measurement heights still can be detected in aerial photographs (Fig. 3). Generally, darker surfaces have lower albedos and lighter surfaces have higher albedos (Post and others, Reference Post2000). At the 10 m height (Fig. 3a), the ice color has a significant variation and the white crack of the ice is quite conspicuous, which means that the albedos vary significantly in the same photo. When the height rises to 100 m (Fig. 3b), the ice color becomes relatively uniform. At a 500 m height (Fig. 3c), the ice crack becomes indistinct, but some patches of snow cover appear due to the expanded view. The land surface albedos range from 0.21 to 0.23 at noon. Compared with the land, the ice color is clearly darker (Fig. 3d). This means that the low ice albedo is reliable.
4.2. Representation of the albedo observations
The observations were only carried out for 8 d due to the tough observation conditions. Do the ice albedos change significantly at different stages? Is the low ice albedo universal across the TP lakes? From the EOSDIS Worldview images (Fig. 9), it can be seen that the colors of snow-free ice surfaces are very similar in Ngoring Lake at different stages of the frozen period, and are very close to the color of the unfrozen water. It is well known that water has a low albedo. A previous study based on the MODIS products also shows that the bare ice albedos vary very little in Ngoring Lake during the frozen period (Lang and others, Reference Lang, Lyu, Li, Ma and Su2018). In Nam Co Lake (a deep salt water lake), the snow-free ice is also very dark. Siling Co Lake looks white due to the snow cover and contrasts with the nearby lakes.

Fig. 9. The satellite images from the EOSDIS Worldview website at different times. From (a) to (d), the lakes are Gyaring Lake and Ngoring Lake, the lake in (e) is Nam Co Lake and the lakes in (f) are Siling Co Lake (the largest one) and its nearby lakes. Siling Co Lake and Nam Co Lake are the second and third largest lakes in the TP, respectively.
Figure 10 shows the albedo frequency distribution of the six typical TP lakes during the completely frozen period (ice cover is more than 95% of the lake area) from October 2012 to June 2015 using the MCD43A3 V005 product. Those albedos of <0.05 are likely due to unfrozen regions. As shown in Figure 10c, the albedos of 72.8% of the pixels in Ngoring Lake are <0.15 under snow-free conditions, and 94.6% of the pixels show albedos below 0.20. For Aksai Chin Lake and Nam Co Lake, the albedos of 65.6 and 70.5% of the pixels are <0.20, respectively. In Whale Lake, Zhari Namco Lake and Qinghai Lake, the albedos of 67.1, 70.8 and 96.2% of the pixels are <0.25 under snow-free conditions, respectively. The peaks of the albedo frequency distributions in these lakes are much smaller than those resulting from the parameterization schemes. Due to the influence of the snow cover, the actual lake surface albedo is inevitably higher than that of the bare ice. However, the peaks of the albedo distribution for all the available pixels are still <0.40 in Aksai Chin Lake, Qinghai Lake and Zhari Namco Lake, and the proportions of albedos lower than 0.40 account for 70.0, 88.9 and 79.9% of the total pixels, respectively. Of the six lakes, the albedo peak of Nam Co Lake is the largest (0.58), and the peak is not obvious in Ngoring Lake or Whale Lake. Therefore, this phenomenon of low ice albedo in Ngoring Lake has a certain universality across the TP lakes, especially when the error of the snow-cover flag and the scale differences between the MODIS and ground-based measurements are considered.
Fig. 10. The distributions of the surface albedos under snow-free (a–f) and all (g–l) conditions for six typical TP lakes during the completely frozen period. N is the number of the available sample. Aksai Chin Lake (35.21°N, 79.85°E, 4849 m a.m.s.l.) is located in the western TP, Nam Co Lake (30.72°N, 90.64°E, 4729 m a.m.s.l.) and Zhari Namco Lake (30.94°N, 89.45°E, 4617 m a.m.s.l.) are located in the south-central TP, Whale Lake (36.34°N, 85.61°E, 4718 m a.m.s.l.) is located in the northwestward TP, and Qinghai Lake (36.93°N, 100.16°E, 3198 m a.m.s.l.) is located in the northeastward TP.
4.3. Influence of the ice albedo on lake simulation
In order to study the effect of lake ice albedo, a group of numerical simulations with different ice albedos (from 0.10 to 0.80, with an interval of 0.10) using LAKE 2.0 model are carried out. The forcing data (01 July 2011–31 December 2016) come from the observation in Ngoring Lake, and the main input meteorological variables include air temperature, air specific humidity, air pressure, zonal and meridional wind speeds, downward shortwave and longwave radiations and precipitation rate. As the initial state for spin-up, the lake temperature profile is given based on the observed result in Ngoring Lake in early July 2012. Then the simulation is carried out ten times with the forcing data of the first year. After this spin-up run, the lake temperature reaches the seasonally repeating equilibrium state. The final state of this spin-up run is used in turn as the initial state for the respective run (only the lake ice albedos are different).
The daily average surface temperature from all simulation experiments is presented in Figure 11. During the ice-free period, especially from July to November, the difference in the surface temperature is small between the simulated and the MODIS product, and the ice albedo has little effect on the lake surface temperature. In the larger view (Fig. 11b, c), the difference in the surface temperature due to the ice albedo is mainly manifested in the period from late November to the following June. During this stage, the lower the ice albedo, the higher the simulated temperature, especially from April to June. Moreover, when the ice albedo is no more than 0.5, the difference among different tests is small. As the albedo increases, the difference in simulated surface temperature increases rapidly. This means that the ice albedo may have a significant effect on heat exchange and evaporation over the lake, especially in late spring and early summer. Taking example of sensible heat (H) and latent heat (LE) flux from 2012 to 2016, the averaged H is 29.70, 25.33 and 21.06 W m−2 in the experiments with an ice albedo of 0.10, 0.40 and 0.70, respectively. The LE is 76.63, 72.84 and 67.90 W m−2 in three experiments, respectively. When time is set in April, May and June, the decrease in the flux due to high ice albedo will be more obvious (26.68, 25.14 and 18.93 W m−2 for H; 77.73, 75.43 and 64.41 W m−2 for LE). From November 2011 to June 2012, the surface temperature from high ice-albedo experiment is closest to the observation. In the same time of next year (2012–13), the surface temperature from low ice-albedo experiment is closer to the observation. This appears to be contrary to the previous sections. This phenomenon may be related to the lack of accuracy in the snow simulation during the freezing period. Additionally, previous studies have shown that the MODIS products underestimate the surface temperature (Trigo and others, Reference Trigo, Monteiro, Olesen and Kabsch2008; Li and others, Reference Li2014), which may be expected to result in certain errors.
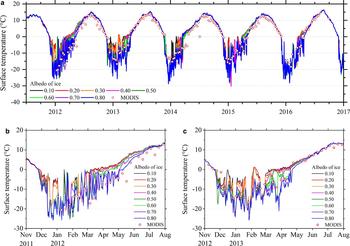
Fig. 11. The daily mean lake surface temperature from MODIS and LAKE 2.0 model using different ice albedos (a) from 20110701 to 20161231, and larger view of segmental (a) ((b) from 20111101 to 20120801 and (c) from 20121101 to 20130801).
However, opposed to the surface temperature, the difference in water temperature between simulation and observation (22 September 2015–21 September 2016) shows an opposite trend (Fig. 12). Although the simulated water temperature is underestimated systematically (bias<0), the bias and the root mean square error (RMSE) all decrease with the decrease of the ice surface albedo. In the shallow layer (3 m depth), the bias and RMSE are the smallest (0.56 and 2.05°C) when the ice albedo is 0.10. In the deep layer (15 m depth), the corresponding ice albedo is 0.20, with 0.16°C of bias and 2.22°C of RMSE. This means that, for Ngoring Lake, the low ice albedo is more appropriate for the lake temperature simulation.

Fig. 12. The bias (simulation–observation) and the root mean square error (RMSE) for lake temperature at 3 m (a) and 15 m (b) depths simulated by LAKE 2.0 using different ice albedos, compared with observations from 22 September 2015 to 21 September 2016.
5. CONCLUSION
Based on the field experiment data in Ngoring Lake, we found that the diurnal peak of the ice albedo can reach ~0.30 after sunrise and before sunset and decreases to 0.08–0.09 at noon. The ice albedos of 72.21% of the observed samples are <0.12, and 93.38% of the samples show ice albedos below 0.16. The relatively clean blue ice (0.6 m thickness) has an albedo of only 0.075, which is significantly lower than that reported by previous studies. The lake ice albedo is only 0.212 when covered with snow patches. Overall, the MOD10A1 products have the best agreement with observations, followed by the MYD10A1. The MCD43A3 products are consistently higher than observations and have a few periodicity variations. Due to the errors of the snow flags in MCD43A2 and the inconsistent time windows between MCD43A3 and MCD43A2, the albedo of the lake ice covered with snow is even less than that of snow-free ice at certain times. Apart from the influence of the solar zenith angle, there is no significant correlation between the observed ice albedo and the surface temperature. This conclusion is clearly different from the result derived from temperature-dependent albedo parameterizations. The albedo from CLM4.5 for the near-infrared radiation is the closest to that observed, and the largest deviation is seen in the WRF-FLake model. None of the listed albedo parameterizations can satisfactorily reproduce the observed relationship between the ice albedo and the surface temperature in Ngoring Lake.
ACKNOWLEDGEMENTS
This research was supported by the National Natural Science Foundation of China (No. 41605011, 91637107, 91537104, 41775016), Sino-German Research Project (GZ1259), the Science and Technology Service Network Initiative of CAREERI, CAS (651671001), and the Foundation for Excellent Youth Scholars of NIEER, CAS (Y651K51001). We thank LAADS for providing the MODIS albedo product data used in this study (https://ladsweb.modaps.eosdis.nasa.gov/). We thank Georgiy Kirillin for his valuable assistance in the water temperature observation in Ngoring Lake and anonymous reviewers for the constructive comments on the paper. Observation data of the IOS and MOP can be freely shared, contact the corresponding author for access to the data.


 Open access