


Introduction
Great Aletsch Glacier is the largest glacier of the European Alps. With a length of more than 20 km and ice thicknesses of up to 800 m it covers an area of ~80 km2 and contains more than 20% of the total ice volume present in the Swiss Alps (Bauder and others, Reference Bauder, Funk and Huss2007; Farinotti and others, Reference Farinotti, Huss, Bauder and Funk2009). Located in the UNESCO world heritage, Aletsch Glacier is one of the most important touristic nature attractions in Switzerland (Wiesmann and others, Reference Wiesmann, Liechti and Rist2005), but also its meltwaters have a considerable relevance for the hydrological cycle of the Rhône River (Verbunt and others, Reference Verbunt2003). Furthermore, the 20th century retreat of the glacier tongue has triggered a widespread but yet slow landslide movement (Kos and others, Reference Kos2016). A sustained retreat of Great Aletsch Glacier under persistent conditions of atmospheric warming would thus have a substantial impact on Swiss economy and regional landscape evolution. To anticipate the coming changes, it is necessary to apply numerical models for simulating the future evolution of Great Aletsch Glacier accounting for the most significant underlying processes, such as the accumulation of snow and firn, the melting of ice and ice flow dynamics. Due to its exceptional size and its topography (consisting of four distinct accumulation basins), the glacial motion is complex, showing ice-surface velocities up to 200 m a−1, and hence, plays an essential role in determining long-term glacier evolution. It is therefore desirable to model ice flux with the full Stokes equations, which do not rely on any mechanical simplifications. Following this approach, Jouvet and others (Reference Jouvet, Huss, Funk and Blatter2011) modelled the evolution of Great Aletsch Glacier in the 21st century according to climate scenarios available by 2009. Yet, the occurrence of extreme years in terms of glacier melt during the last decades (e.g. Thibert and others, Reference Thibert, Dkengne Sielenou, Vionnet, Eckert and Vincent2018), new data on decadal glacier mass loss and the recent release of high-resolution climate scenarios, downscaled for the Swiss Alps (CH2018 Project Team, 2018), permit an update and significant refinement of the previous assessments, and to quantify the climate-related uncertainty margins, which were not available so far. We particularly focus on the effect of different CO2-emission scenarios, and a potential stabilization of climate forcing on the evolution of Aletsch Glacier until 2100.
Methods
We present new results of a state-of-the-art three-dimensional glacier model that has formerly been applied to Aletsch Glacier in Jouvet and others (Reference Jouvet, Huss, Funk and Blatter2011). Ice flow is described with the full Stokes equations while basal sliding is described by Weertman's sliding law. The bedrock topography of Aletsch Glacier is based on radar measurements, and interpolation to the entire glacier area is supported by an ice thickness model (Farinotti and others, Reference Farinotti, Huss, Bauder and Funk2009). The ice is assumed to be isothermal, and the parameters for ice viscosity and basal friction were tuned such that the model reproduces observed surface velocities over the period 1950–1980, as well as changes in surface elevation since 1880 (see Jouvet and others, Reference Jouvet, Huss, Funk and Blatter2011, for details). Based on the most recent Digital Elevation Model (DEM) in 2017 obtained from the Swiss Federal Office of Topography, and recent velocity fields derived by template matching via the Matlab toolbox ImGRAFT (Messerli and Grinsted, Reference Messerli and Grinsted2015) using Sentinel-2A satellite images (Copernicus Sentinel data 2016–2018), we found that these parameters are still valid. Daily snow accumulation and snow/ice melt rates were calculated using a spatially distributed accumulation and temperature-index melt model (Hock, Reference Hock1999; Huss and others, Reference Huss, Bauder, Funk and Hock2008). Despite the considerable simplifications of temperature-index models, studies have shown that they are more robust for projecting long-term glacier change in comparison to complex energy-balance models given the available input data (e.g. Gabbi and others, Reference Gabbi, Carenzo, Pellicciotti, Bauder and Funk2014). While the Stokes equations were solved by finite elements, the glacier surface evolution was obtained by solving a transport equation for the volume of fluid, which proved to be a robust method to model the time evolution of complex glacier shapes (Jouvet and others, Reference Jouvet, Picasso, Rappaz and Blatter2008). Using this model, the long-term evolution of Great Aletsch Glacier has been already simulated from 1874 to 1999 and results were validated against observed changes in glacier volume and length (Bauder and others, Reference Bauder, Funk and Huss2007; Jouvet and others, Reference Jouvet, Huss, Funk and Blatter2011). For this study, the parameters of the surface mass-balance model were re-calibrated and validated by comparing computed ice volume changes with observations derived from three photogrammetrically derived DEMs of Aletsch Glacier for 1999, 2009 and 2017 (Bauder and others, Reference Bauder, Funk and Huss2007). Initializing the simulations with the DEM of 1999, we first ran the combined mass balance–ice flow model with different sets of melt parameters until 2009 until the observed volume change was matched. Using the optimal parameters, we continued the simulation until 2017. The results for this independent time period indicated a high model performance (discrepancy of 0.8, 1.4 and 0.9% in terms of volume, area and length change, respectively, see Fig. 1). Except for melt parameters, all model parameters used in Jouvet and others (Reference Jouvet, Huss, Funk and Blatter2011) remained unchanged.
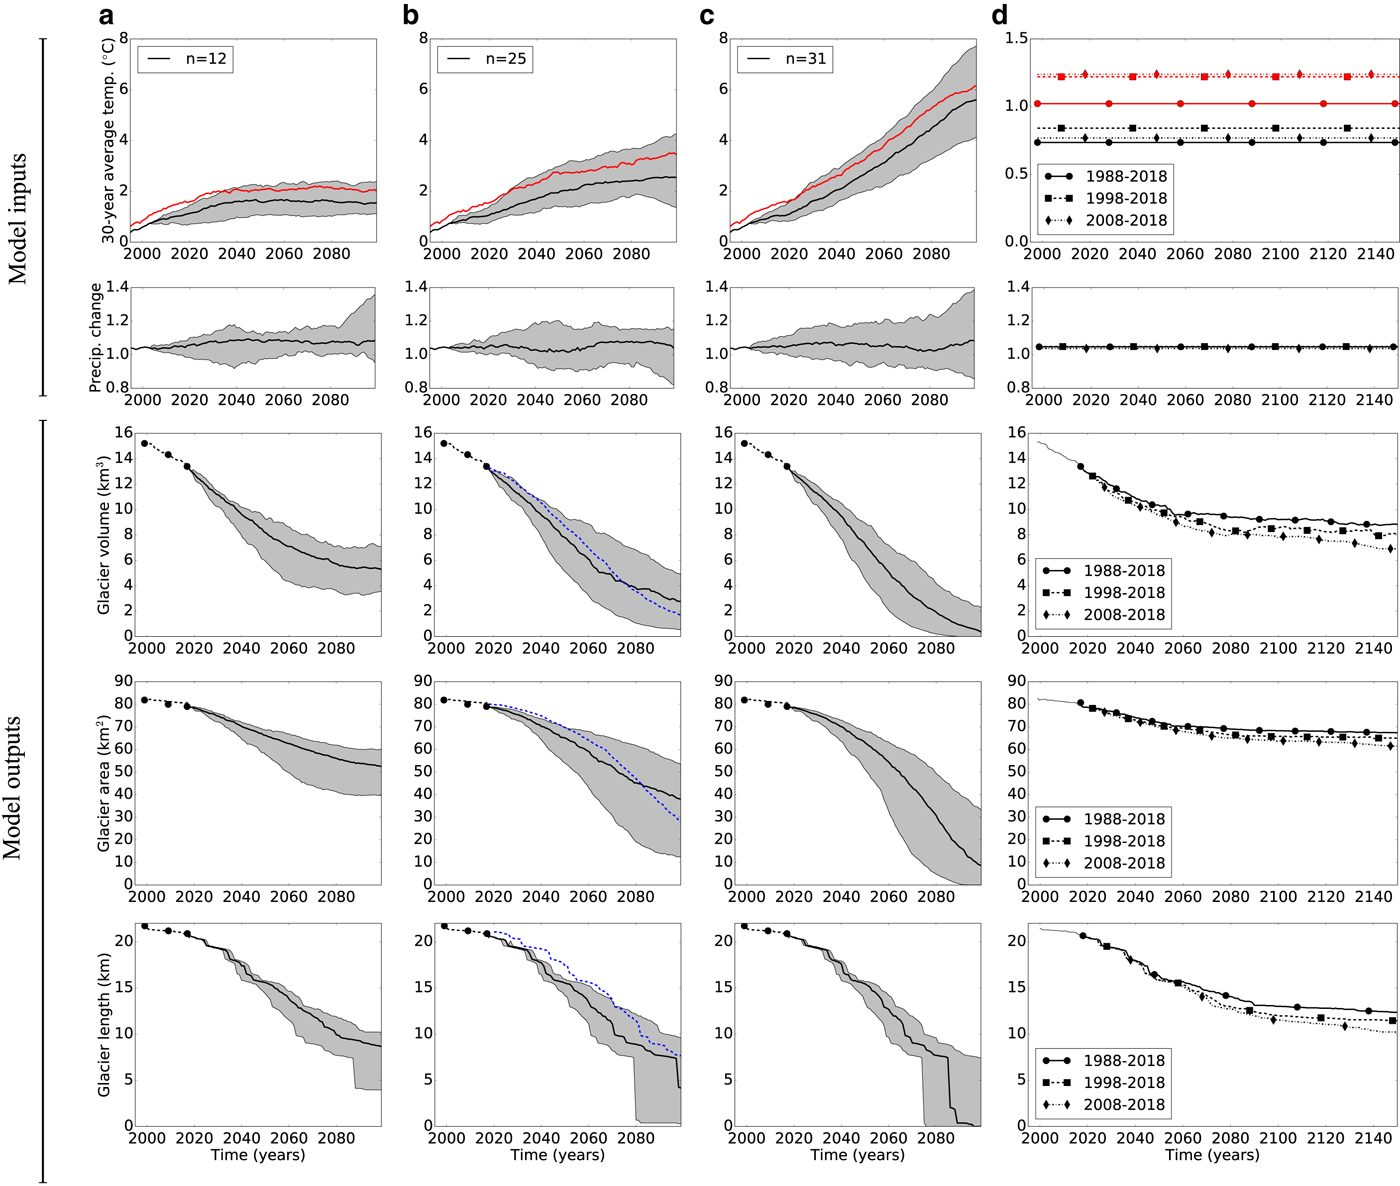
Fig. 1. Model input and output variables by forcing the model with GCM-RCM chain corresponding to the CO2-emission scenarios (a) RCP2.6, (b) RCP4.5, (c) RCP8.5 and (d) with the climate of past periods. Input variables include 30-year-average changes in annual air temperatures (black, first row), summer air temperatures (red, first row) and precipitation (black, second row) relative to the climatic reference period 1960–1990, while output variables consist of future changes in volume (third row), area (fourth row) and length (fifth row) of Great Aletsch Glacier. For each RCP scenario, the median, minimum and maximum results among the set of models is shown such that the grey area indicates the spread over all models. The results (dashed line) for the period 1999–2017 were obtained for calibration (first to second dot) and validation (second to third dot). For comparison, the results of the median scenario of our former study (Jouvet and others, Reference Jouvet, Huss, Funk and Blatter2011) are depicted with a dashed blue line along with the RCP4.5 results.
For driving the combined model over the 21st century we rely on the CH2018 scenarios (CH2018 Project Team, 2018) that represent the state-of-the-art for future climate in Switzerland. The CH2018 scenarios are based on 68 model chains consisting of different Global Circulation Models (GCMs) and Regional Climate Models (RCMs) from the EURO-CORDEX (COordinated Regional climate Downscaling Experiment applied over Europe) ensemble (Jacob and others, Reference Jacob2014; Kotlarski and others, Reference Kotlarski2014). Results of all individual GCM-RCM chains have been downscaled to the meteorological stations of Jungfraujoch (3580 m a.s.l.) and Lauterbrunnen (818 m a.s.l.) based on quantile mapping techniques (CH2018 Project Team, 2018). The downscaled transient series have subsequently been used for average daily air temperatures and precipitation sums, respectively, and were provided by CH2018 Project Team (2018). The 68 scenarios of the ensemble refer to different CO2-emissions according to the Representative Concentration Pathways (RCPs, Meinshausen and others, Reference Meinshausen2011) thus exploring future anthropogenic forcing of climate change. RCPs range from unabated emissions (RCP8.5) to an ambitious mitigation pathway to keep global warming below 2°C with respect to pre-industrial levels (RCP2.6). An intermediate case with mitigation insufficient to reach the 2°C target is also considered (RCP4.5). The CH2018 projections consist of time series derived from 12 RCP2.6, 25 RCP4.5 and 31 RCP8.5 scenarios. The corresponding 30-year running means of annual and summer air temperature and precipitation changes relative to 1960–1990 over the 21st century are shown in Figure 1. It must be stressed that summer temperatures – mainly determining the rate of glacier mass loss – show more important changes in comparison to annual averages by ~ 1°C relative to 1960–1990. On the other hand, expected changes in precipitation are mostly positive, albeit moderate (+5 to 10% by 2100 on average for all scenarios) and with a relatively high variability (±25%). We initialized the projections for Great Aletsch Glacier with the last available DEM (2017) and ran the combined mass balance–ice flow model until 2100 using all 68 downscaled climate scenarios. In additional experiments we performed model runs with meteorological conditions of three different past periods (1988–2018, 1998–2018, 2008–2018) to assess glacier response to an immediate stabilization of climate forcing. Randomly selected years within the periods were repeated until the glacier reached a steady-state geometry.
Results and discussion
Results of the simulations in terms of volume, area and length of Great Aletsch Glacier through the 21st century for the median, the most and the least glacier-friendly models of the three RCP scenarios are shown in Figure 1. The three RCPs indicate a remarkable agreement until 2050, with a median reduction of roughly 41, 17 and 26% in terms of ice volume, glacier area and length, respectively, compared to 2017 (Fig. 2). The spread of the individual GCM-RCM chains until 2100 is, however, considerable (between ±12% and ±25% according to the RCP and the variable). The differences between the RCPs are most significant considering the state of Aletsch Glacier in 2100. For RCP4.5 leading to an air temperature increase of 2–4°C by 2100 relative to 1960–1990, we find a median ice-volume reduction of roughly 75% until the end of the century compared to 2017 (Fig. 2), with a wide spread (volume change between –62% and –95% depending on the GCM-RCM chain). A complete disintegration of the 14 km long glacier tongue below Konkordiaplatz is expected under this scenario, with several remaining ice bodies only above 3000 m a.s.l. (see Fig. 3c). Even for the moderate emission scenario RCP2.6, the closest to the targets set in the Paris agreement (Sanderson and others, Reference Sanderson, O'Neill and Tebaldi2016), a major retreat of Great Aletsch Glacier by the end of the century is found with a reduction of 57, 31, 56% in volume, area and length, respectively, compared to 2017 (Fig. 2). For the extreme RCP8.5 scenario leading to an air temperature increase of 4–8°C, however, an almost complete wastage of Aletsch Glacier by 2100 is indicated with just tiny remnants of ice in the highest regions (see Figs 2, 3e).
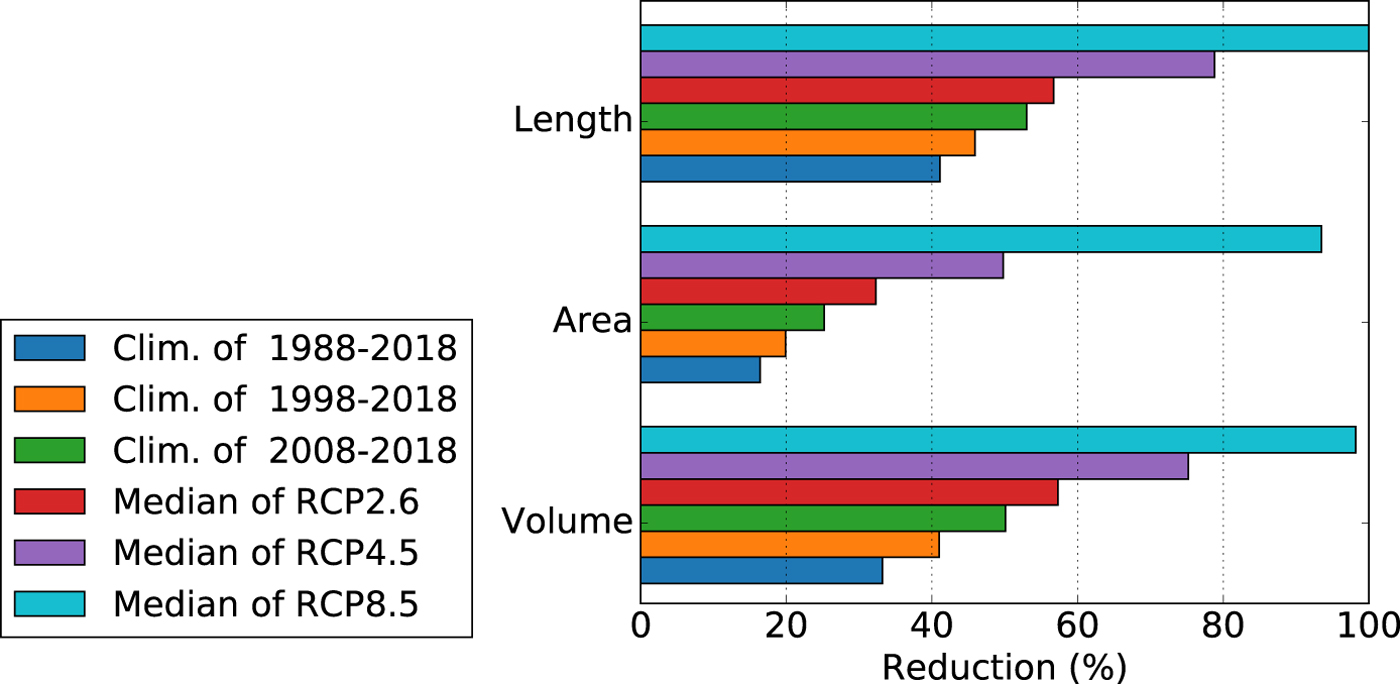
Fig. 2. Future reductions (in %) in length, area and volume of Great Aletsch Glacier by 2100 relative to 2017 for three experiments forcing the model with the climate of the past periods, and the median of the RCP2.6, RCP4.5 and RCP8.5 scenarios.
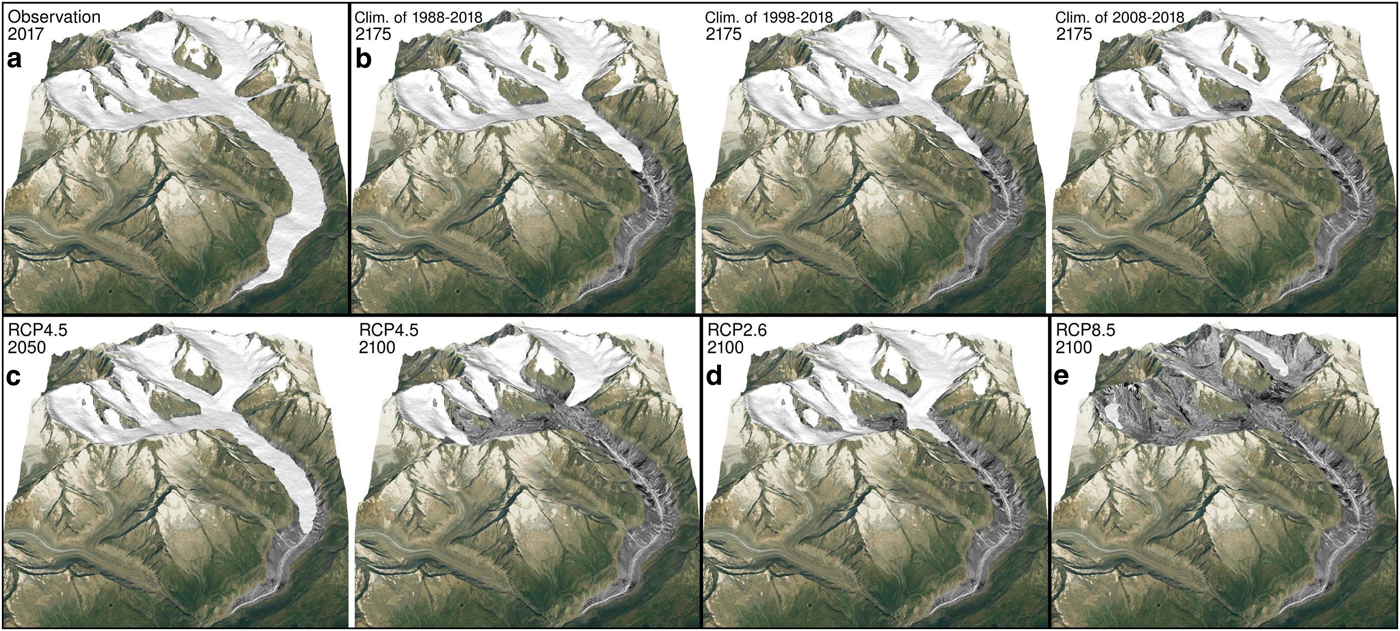
Fig. 3. (a) Great Aletsch Glacier as observed in 2017. (b) Simulated extent of Great Aletsch Glacier after reaching a steady-state shape (after about 150 years of simulation) when repeating the climate conditions of former periods. (c) Simulated extent of Great Aletsch Glacier by 2050 and 2100 according to the median of the RCP4.5-forced models, and according to the median of (d) RCP2.6-forced and (e) RCP8.5-forced models by 2100. The time evolution of the modelled glacier is included as Supplementary video material for all climate scenarios.
We also performed equilibrium experiments with repeating climate conditions of the last decades to isolate the impact of atmospheric warming observed in recent years from the one expected in the future. The three periods with a length of 10, 20 and 30 years were motivated by the important changes in temperature observed since the early 1990s (Fig. 1d). For all considered periods of recent climate, we found that Great Aletsch Glacier reaches a steady-state shape in 100–150 years from now, illustrating the glacier's substantial imbalance with today's climate forcing, and demonstrating the considerable inertia of the largest glacier of the Alps (Fig. 1d). When applying the meteorological conditions of the last 30 years (1988–2018), Aletsch Glacier is found to lose 32% of its volume and to retreat by 8.5 km compared to 2017. Losses are even more significant when restricting the climate conditions to the most recent decade, almost resulting in a halving of the present volume and length of Great Aletsch Glacier. This emphasizes the impact of the recently observed extreme years in terms of summer heat waves (see Fig. 1d) and glacier melt, and the considerable mass loss already committed under present climate conditions.
In line with our previous study (Jouvet and others, Reference Jouvet, Huss, Funk and Blatter2011), our results confirm that a substantial wastage in ice volume and length of Great Aletsch Glacier has to be expected by the end of the 21st century, regardless the considered climate scenario. Compared to the former median scenario used in Jouvet and others (Reference Jouvet, Huss, Funk and Blatter2011), the new results (median scenario for RCP4.5) show an even more pronounced shrinkage in the short term (Fig. 1b) but a moderate slowdown of volume loss after about 2070. According to the most optimist of all 68 CH2018 scenarios, the volume of Aletsch Glacier will decrease by ~50% by 2100 and the glacier tongue is expected to retreat by 12 km. This roughly corresponds to the steady state obtained by forcing the model with the meteorological conditions of the last decade, which was characterized by multiple extreme glacier melt years (GLAMOS, 2018; Zemp and others, Reference Zemp2019). Unlike in Jouvet and others (Reference Jouvet, Huss, Funk and Blatter2011), the present ensemble of simulations allows us to analyse the spread in modelled glacier evolution due to climate model forcing, thus confirming with high confidence that Great Aletsch Glacier will at least be halved in terms of volume and length by the end of the century (Fig. 2). Yet, the uncertainty of our projections remains considerable depending on
(i) the spread of future climate change as inferred by the GCM-RCM combinations,
(ii) the assumptions on future CO2-emission pathways and
(iii) simplifications in the glacier model (e.g. temporal variations in the degree-day factors).
The results for Aletsch Glacier obtained for the individual RCP scenarios are consistent with recent projections at the scale of the entire European Alps based on a regional glacier evolution model forced by the EURO-CORDEX ensemble scenarios (Zekollari and others, Reference Zekollari, Huss and Farinotti2019). However, the future retreat of Great Aletsch Glacier might be retarded by up to 5–10 years in case that supraglacial debris considerably extends on the ice surface, thus reducing melt. This estimate has been deduced from the maximum speed of the debris propagation on the two medial moraines on Aletsch Glacier observed on aerial imagery during the last 20 years, and model results accounting for the corresponding debris propagation and melt reduction (Fig. 9, Jouvet and others, Reference Jouvet, Huss, Funk and Blatter2011).
Conclusion
Our model results demonstrate that even with rapidly curbed down CO2-emissions, as well as with an immediate stabilization of air temperature forcing at the level of the last decades, a substantial retreat of the largest glacier of the European Alps cannot be mitigated. This is due to a considerable time lag of glacier response to climate. The anticipated 21st century retreat of Great Aletsch Glacier, along with other glaciers worldwide, is expected to have major impacts on water availability, hazards in a deglaciating landscape, and the perception of the Alps as recreational area. Despite the rather pessimistic perspectives on the fate of Great Aletsch Glacier, our study shows that under a strong climate mitigation scenario (RCP2.6) with a local annual temperature rise of 1–2.5°C (relative to 1960–1990) a significant ice body, with glaciers still coalescing at Konkordiaplatz, will resist climate change until 2100 (Fig. 3d). This is in sharp contrast to unabated CO2-emissions (RCP8.5, locally +4 to 8°C) for which an almost complete demise of Great Aletsch Glacier is expected.
Supplementary material
The time evolution of the modelled Great Aletsch Glacier is included as supplementary video material for the six climate scenarios presented in Figures 3b–e. The supplementary material for this article can be found at https://doi.org/10.1017/jog.2019.52
Acknowledgments
The climate scenario data CH2018 were provided by S. Kotlarski (Meteoswiss). The post-processed model data of CORDEX are provided by the Center for Climate Systems Modeling (C2SM), ETHZ (J. Rajczak, S. Soerland, U. Beyerle, C. Spirig, E. Zubler). We thank A. Bauder (ETHZ) and swisstopo for providing updated glacier surface elevations in 2009 and 2017, as well as M. Funk (ETHZ) for comments on the manuscript. J. Seguinot (ETHZ) is acknowledged for processing Sentinel-2A satellite images of Aletsch Glacier with SentinelFlow. The glacier model used in this study was developed at ASN/EPFL. We are grateful to YCOOR systems SA for providing the cfsMesh software that was used for meshing Aletsch Glacier.


 Open access