


Introduction
The firn cover of mountain glaciers is expected to undergo changes related to global warming. Net accumulation rates derived from firn cores provide information on climatic conditions in the accumulation area of glaciers (Schwikowski and others, Reference Schwikowski, Schläppi, Santibanez, Rivera and Sasassa2013) and represent amount of solid precipitation (Sold and others, Reference Sold, Huss, Eichler, Schwikowski and Hoelzle2015). Melt conditions at the glacier surface produce meltwater, which percolates through the firn column and may build ice lenses when refreezing within the firn column (Benson, Reference Benson1996). Changes in firn stratigraphy may therefore reflect varying atmospheric conditions. Furthermore, firn temperatures reflect the short- and mid-term evolution of the energy balance at the glacier surface (Hoelzle and others, Reference Hoelzle, Darms, Lüthi and Suter2011). The repeated assessment of firn characteristics thus provides information about climate change, which is especially valuable for data sparse regions such as High Mountain Asia (HMA). Moreover, Mayer and others (Reference Mayer2014) showed that in situ measurements from snow pits on a remotely located high elevation site can be related to more general meteorological information.
Processes within the firn are relevant for the overall behaviour of glaciers. Melt in the firn area affects the thermal regime of a glacier and consequently ice viscosity (Phillips and others, Reference Phillips, Rajaram and Steffen2010; Lüthi and others, Reference Lüthi2015) which in turn affects ice dynamics (Ryser and others, Reference Ryser2013). Firn processes influence the glacier mass balance, which is a key parameter in detecting global warming trends. Meltwater retention in firn can either attenuate (Haeberli and Alean, Reference Haeberli and Alean1985; Suter and others, Reference Suter, Hoelzle and Ohmura2004; Cox and others, Reference Cox, Humphrey and Harper2015) or promote glacier mass loss (Braithwaite and others, Reference Braithwaite, Laternser and Pfeffer1994; Machguth and others, Reference Machguth2016). A steepening of mass-balance gradients (Dyurgerov and Dwyer, Reference Dyurgerov and Dwyer2001) is likely to be reflected in firn changes. Firn in situ data are an asset to understand the behaviour of mountain glaciers.
Uncertainties in glacier mass-balance estimates are often related to poorly constrained firn processes. For example, Digital Elevation Models (DEMs) used for volume change calculations are prone to errors in the accumulation area (e.g. Kronenberg and others, Reference Kronenberg2016; Gardelle and others, Reference Gardelle, Berthier and Arnaud2012). This is principally because volume changes are converted into a mass change by the use of a single conversion factor which, in reality, varies with firn extent and density (Huss, Reference Huss2013).
Several studies have investigated firn on mountain glaciers (e.g. Zagorodnov and Zotikov, Reference Zagorodnov and Zotikov1980; Hoelzle and others, Reference Hoelzle, Darms, Lüthi and Suter2011; Zdanowicz and others, Reference Zdanowicz2012; Bezeau and others, Reference Bezeau, Sharp, Burgess and Gascon2013; Marchenko and others, Reference Marchenko2017; Vincent and others, Reference Vincent2020). However, available firn studies mainly focus on glaciers located in the Arctic and the Alps. In the context of this regional bias, legacy firn investigations performed on two remotely located mountain glaciers in Central Asia in the 1960s and 1970s are of great importance (Dikikh, Reference Dikikh1965; Kislov, Reference Kislov1977, Reference Kislov1982). On Gregoriev Ice Cap located in the Inner Tien Shan, firn investigations have been repeated several times and observed changes include an ongoing increase of englacial temperatures from 1962 to 2003 (Thompson and others, Reference Thompson1997; Kutuzov, Reference Kutuzov2005). The second firn study site is Abramov Glacier located in the Pamir Alay (Fig. 1). The firn measurements on Abramov Glacier, carried out during the 1970s by Soviet research programmes, have never been repeated.
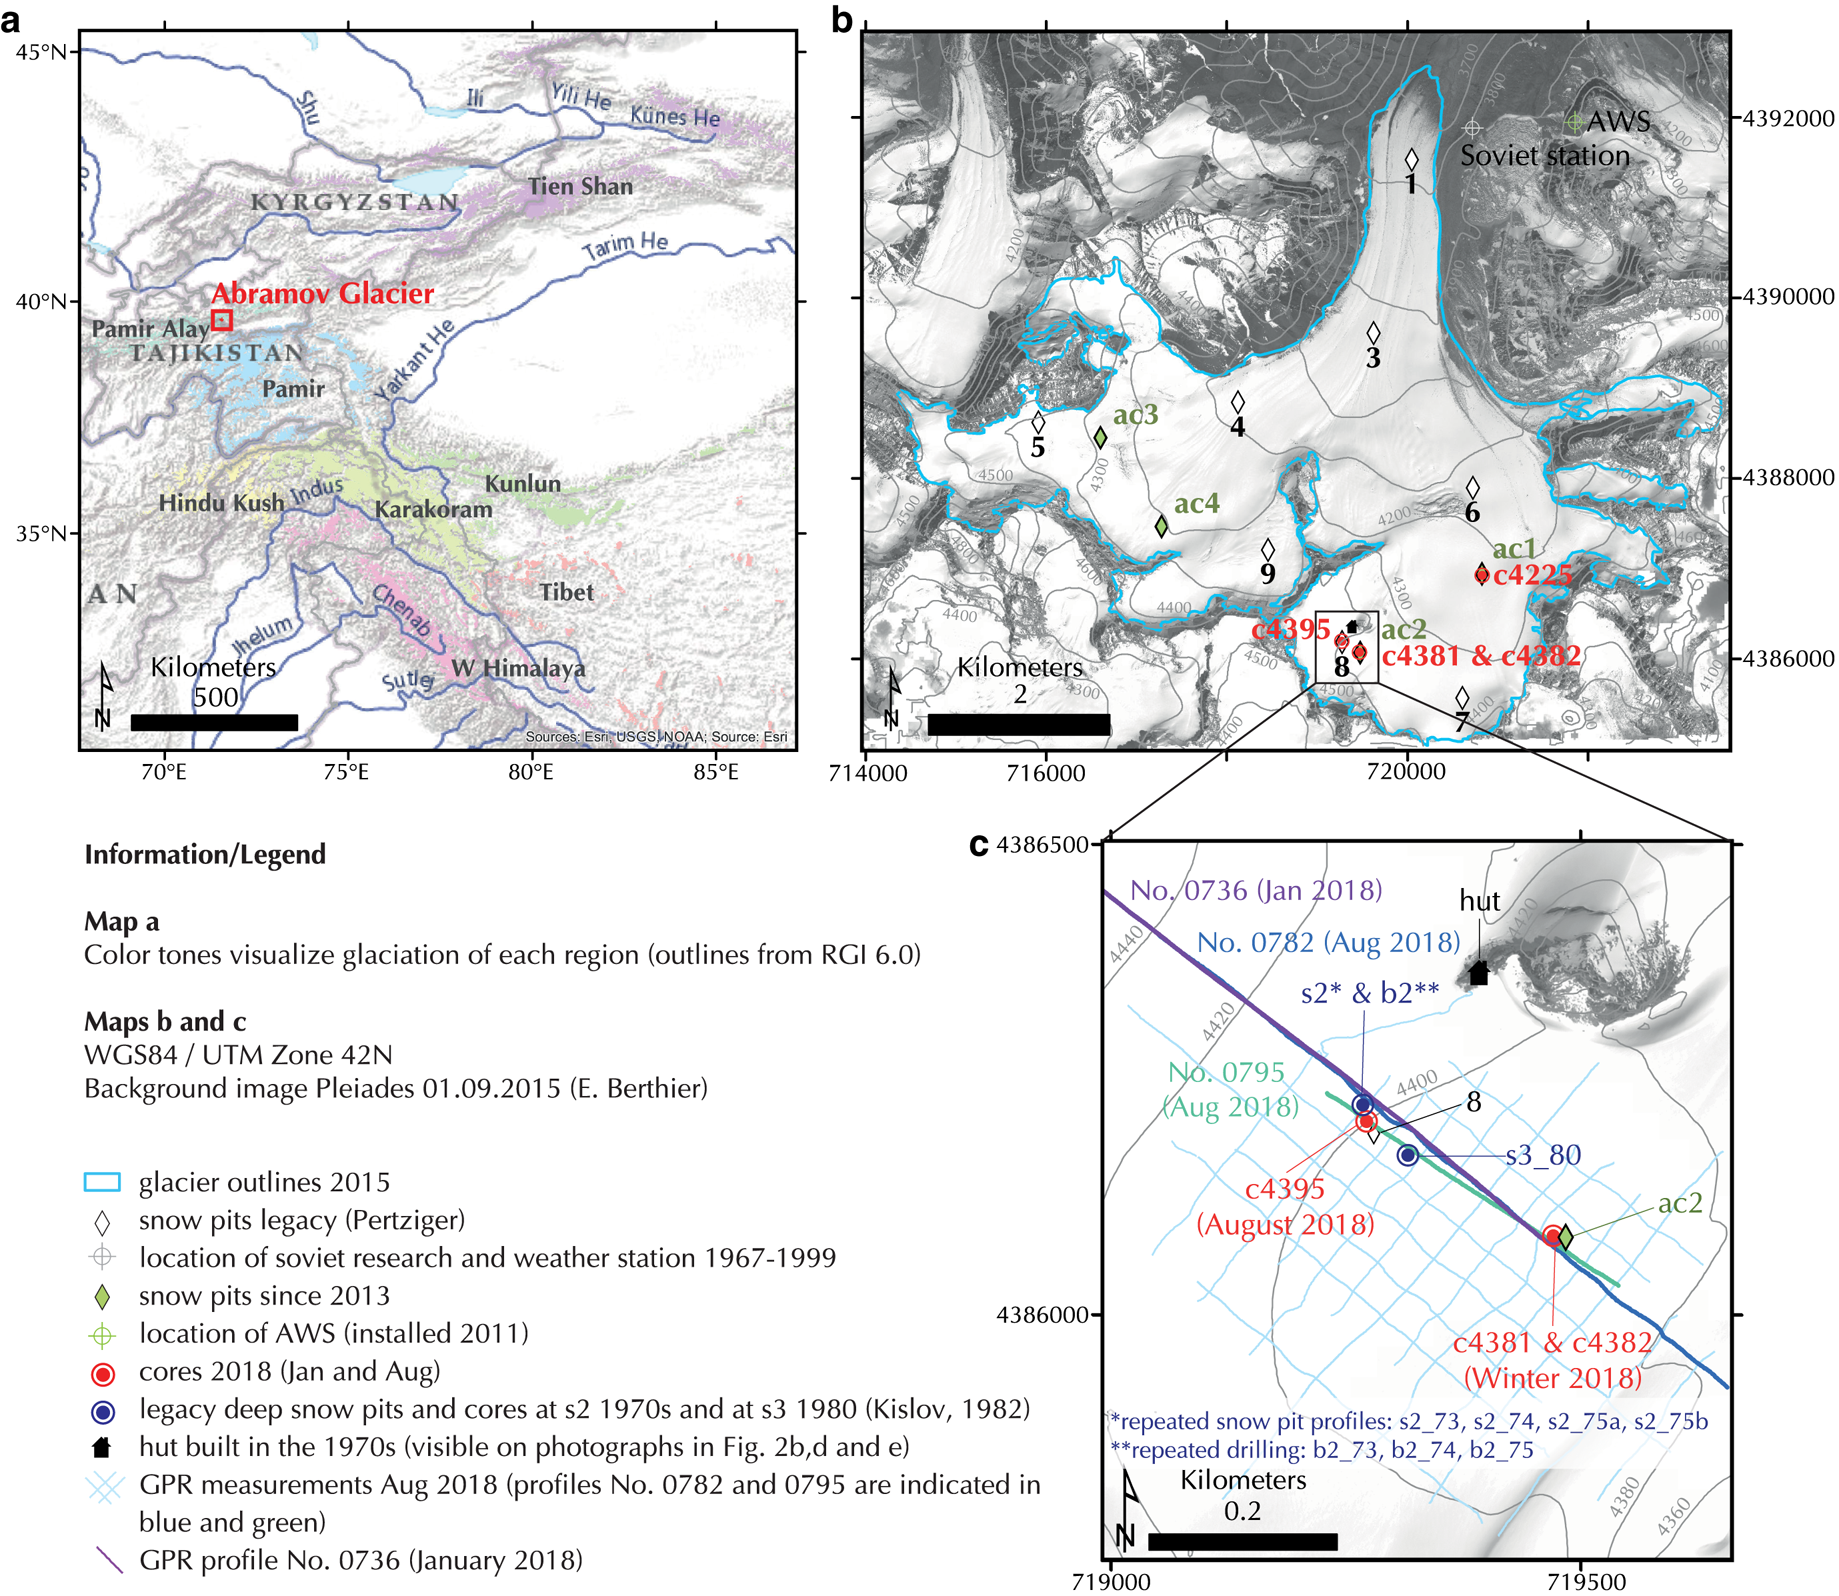
Fig. 1. (a) Overview map showing the location of Abramov Glacier in the Pamir Alay (indicated in red). (b) Map of Abramov Glacier showing the legacy and current observation network. (c) Zoom to main investigation area in the orographic right accumulation area of Abramov Glacier.
Central Asian mountain ranges including the Tien Shan, Pamir and Pamir Alay are strongly underrepresented within world-wide glacier monitoring activities (WGMS, 2017). Due to the lack of in situ measurements, glacier mass changes are mainly assessed by remote-sensing studies (e.g. Gardelle and others, Reference Gardelle, Berthier, Arnaud and Kääb2013; Holzer and others, Reference Holzer2015). In the recent past, close-to-balance region-wide mass budgets were found for the Pamir and Pamir Alay (Brun and others, Reference Brun, Berthier, Wagnon, Kääb and Treichler2017; Shean and others, Reference Shean2020). The same conclusion was reached by an investigation of changes of the snowline altitude in the Pamir from 1998 to 2013 (Zhang and Kang, Reference Zhang and Kang2017). Other regions of HMA such as the Himalaya have recently undergone accelerations in mass loss (Maurer and others, Reference Maurer, Schaefer, Rupper and Corley2019). The reasons for the mass-balance anomaly in the western HMA are far from being completely understood (Farinotti and others, Reference Farinotti, Immerzeel, de Kok, Quincey and Dehecq2020). An accumulation increase related to an increase of solid precipitation has been suggested as a potential driver for the anomaly (e.g. Yao and others, Reference Yao2012). However, uncertainties in precipitation trends are high as precipitation gauge measurements are sparse (Unger-Shayesteh and others, Reference Unger-Shayesteh2013) and prone to measurement errors when performed in alpine environments (Rasmussen and others, Reference Rasmussen2012). Due to the shortage of in situ mass-balance observations for the regions, remotely sensed mass-balance estimates lack validation data. Furthermore, in situ measurements generally centre on the ablation area which may lead to large uncertainties in glaciological mass balances over the accumulation area (Sold and others, Reference Sold2016). Complementary accumulation and firn investigations may help to address such uncertainties and to improve our understanding of accumulation area processes. Very few recent investigations focus on the accumulation area of glaciers located in the vicinity of the so-called mass-balance anomaly of HMA. Lambrecht and others (Reference Lambrecht, Mayer, Wendt, Floricioiu and Völksen2018) assess the elevation change of the upper Fedchenko Glacier, Western Pamir combining in situ and remote-sensing data. The recent accumulation history of the same glacier is reconstructed based on GPR data and the analysis of snow and firn samples in Lambrecht and others (Reference Lambrecht, Mayer, Bohleber and Aizen2020). Their results for 2008–2015 indicate relatively stable accumulation conditions compared to the results for 2002–2005 by Aizen and others (Reference Aizen2009). Moreover, firn cores were drilled on Inilchek Glacier, Central Tien Shan to investigate atmospheric circulation patterns at the end of the 1990s and beginning of 2000s (Aizen and others, Reference Aizen2004, Reference Aizen2006).
To date, the lack of observations for the western HMA has prevented comprehensive assessment of possible changes in accumulation regimes within the region. Historical firn investigations performed on Abramov Glacier, Pamir Alay (Figs 1b and c) in the 1970s provide a unique dataset of past firn characteristics and accumulation rates. This dataset, however, has not been evaluated so far. Several studies provide mass-balance estimates for Abramov Glacier: Barandun and others (Reference Barandun2015) re-analysed almost five decades of mass-balance data of Abramov Glacier (including data previously published in Pertziger (Reference Pertziger1996)) and found an overall negative mass balance of − 0.44 ± 0.10 m w.e. a−1 for the period from 1968 to 2014 with increasing melt rates on the glacier tongue. Their results of − 0.51 ± 0.17 m w.e. a−1 for 2000–11 disagree with the geodetic mass balance of − 0.03 ± 0.14 m w.e. a−1 for the same period (Gardelle and others, Reference Gardelle, Berthier, Arnaud and Kääb2013). Denzinger and others (Reference Denzingerin press) computed a geodetic mass balance of − 0.38 ± 0.12 m w.e. a−1 for 1975–2015 and their results indicate that the mass loss of Abramov Glacier has not accelerated recently.
Here, we present a reassessment of the legacy firn data in the context of new measurements. The aims of our study are:
• to determine current accumulation rates, firn stratigraphy and density profiles by drilling new cores at the same location as the measurements made in the 1970s,
• to quantify changes in firn characteristics and accumulation rates at the drill site.
Study site and field data
Abramov Glacier
Abramov Glacier (39.50°N, 71.55° E) is a north oriented valley-type glacier located in the Pamir Alay (north-western Pamir) in Central Asia (Fig. 1). Abramov Glacier is 24 km2 in surface area and spans an elevation range of 3650–5000 m a.s.l. (in 2015).
Legacy data
Glaciological investigations on Abramov Glacier started during Soviet times in 1967, when the Central Asian Hydrometeorological Institute (SANIGMI) built a research station next to the glacier tongue. Until 1999, SANIGMI operated a meteorological station and maintained a dense network of mass-balance point observations at a monthly time scale. During the 1970s, the investigators conducted a series of complementary measurements including firn studies using deep snow pits and boreholes (Kislov, Reference Kislov1982). Due to political instability, one of the most detailed and comprehensive mass-balance time series in HMA ended abruptly in 1999. In 2011, the mass-balance monitoring on Abramov Glacier was reinitiated and an automatic weather station was installed in vicinity of the glacier (Schöne and others, Reference Schöne2013; Hoelzle and others, Reference Hoelzle2017).
Monthly mass balance and meteorological data until 1994 are reported in Pertziger (Reference Pertziger1996). For this study, all measured mass balance and meteorological data until 1999 were provided by F. Pertziger. Mean annual air temperature recorded at the station at 3837 m a.s.l. (Fig. 1b; Soviet station) for the period 1968–1998 was − 4.1°C and annual precipitation was 750 mm a−1 with maximum precipitation occurring from March to May (Pertziger, Reference Pertziger1996). There was a strong vertical precipitation gradient of 1200 mm km−1 a−1 (Kislov, Reference Kislov1982). The glacier had a temperate accumulation zone (Kislov, Reference Kislov1977; Kislov and others, Reference Kislov, Nozdrukhin and Pertzinger1977a) and zones of water-saturated firn were observed (Kislov, Reference Kislov1982). The investigators measured water level changes in deep snow pits during the 1974 and 1975 melt seasons (Glazyrin and others, Reference Glazyrin, Glazyrina, Kislov and Pertzinger1977; Kislov, Reference Kislov1982). In a 13 m deep snow pit, located at 4410 m a.s.l., observed water levels relative to the bottom of the pit varied from ~0.4 to 4.5 m. During the main melt season, water levels in the snow pit rose following a delay of 24–48 hours after days with high melt rates. Glazyrin and others (Reference Glazyrin, Glazyrina, Kislov and Pertzinger1977) concluded that the water level variability in the deep snow pit was a combined signal of the meltwater availability and the percolation characteristics of the firn surrounding the pit.
The legacy firn data consist of repeated firn density measurements and stratigraphy observations acquired in deep snow pits (the maximum depth of a reported profile from snow pit s2 was 22 m in June 1973) and data from nearby boreholes (drilled with a thermal drill; maximum depth reported was 106 m) (Suslov and Krenke, Reference Suslov and Krenke1980; Kislov, Reference Kislov1982) (cf. Table 6 in Appendix A). In total, three deep snow pits which were kept open over the investigation years were investigated: s2 and s3 were located next to each other at ~4400 m a.s.l. (in vicinity of snow pit No. 8 shown in Figs 1b and c) and s1 at ~4250 m a.s.l. (in vicinity of snow pit ac1 shown in Fig. 1b). As s3 was abandoned shortly after its establishment (personal communication from F. Pertziger, 2018), only data from s1 and s2 are reported. Furthermore, there were six boreholes, of which three served to monitor englacial temperatures: b0_69 and b0_71 were situated in the ablation area and b1_72 in the vicinity of s1. The other three boreholes (b2_73, b2_74, b2_75) were located in vicinity of s2 (cf. Table 6 in Appendix A).
In this study, we mainly use data from deep snow pit s2 measured between 1973 and 1975. We primarily focus on data acquired in 1973 (b2_73), when the deep snow pit was excavated (as observations from the following years are expected to be affected by lateral effects related to the open pit). Accumulation measurements (mainly from snow pit No. 8 for 1969–99 and ac2 for 2013–18; Figs 1b and c) provide complementary information.
Firn core drilling 2018
To investigate recent firn conditions, we recovered three shallow cores from two sites in winter 2018 (Table 6 in Appendix A). C4225 is located at ac1, c4381 and c4382 are located ~10 m apart at ac2. C4381 was drilled with a FELICS-small (Fast Electromechanical Lightweight Ice Coring System) (Ginot and others, Reference Ginot, Stampfli, Stampfli, Schwikowski and Gäggeler2002) recovering cores of ~58 mm diameter. c4225 and c4382 were drilled with a KOVACS MarkII coring system recovering cores of ~90 mm diameter. The drill sites were chosen according to the location of recent mass-balance observations performed at ac1 (c4225) and ac2 (c4381 and 4382, Fig. 1b). When re-establishing the mass-balance monitoring network in 2011, the locations of ac1 and ac2 were chosen for annual accumulation measurements on the basis of legacy maps of historical firn investigations at s1 and s2, respectively. However, the analysis of data collected in winter 2018 and the assessment of complementary legacy information revealed that c4381 and c4382 were drilled ~240 m southeast of the original site of the historical firn studies (deep snow pits at s2, cores b2, snow pit No. 8). A fourth core (c4395) was therefore retrieved in August 2018 with a KOVACS MarkII coring system at the location of the historic measurements at s2 (Fig. 1 and Table 6 in Appendix A).
GPR measurements 2018
Spatially distributed subsurface information from the orographic right accumulation area of Abramov Glacier is available from a series of GPR profiles. Several GPR transects were recorded in January 2018 (Walther, Reference Walther2018). Complementary GPR measurements were performed on 2 August 2018 (Fig. 1c). We used a Malå ProEx system with an 800 MHz shielded antenna to record GPR profiles with a total length of almost 9 km. We simultaneously recorded the position with a GPS receiver (accuracy of ~5 m). The measurements were performed along a ~30 m × ~30 m grid covering the area of the drill sites c4381, c4382 and c4395. The antenna was installed on a plastic sledge and dragged by foot at a speed of ~2.5 km h−1. With a sampling interval of 0.5 s, this corresponds to a trace spacing of ~0.3 m. The sampling frequency was set to 10.5 GHz and traces were stacked 16-fold.
Methods
We first describe the homogenisation of legacy data, then we outline the firn core analysis and dating of cores drilled in 2018. One core (c4382) was dated based on chemical analysis while the other cores were only analysed in the field. The third subsection describes our GPR processing approach. Subsequently we explain how we interpret the GPR data and in the context of 2018 firn cores to relate the different datasets. Finally, we explain how we use accumulation rates and other parameters to describe legacy and 2018 firn profiles.
Homogenisation of legacy data
The preparation of historical data involved (i) the determination of the location of historical investigations and (ii) the compilation of firn data into common formats to match recent observations.
Data from the legacy investigations on Abramov Glacier are published and archived with coordinates in a local coordinate system. For some data points, only elevation information is reported and approximate locations are available from schematic maps. Local coordinates are available for each snow pit shown in Figure 1b and 165 ablation stakes as well as for a series of benchmark locations, where tripods were permanently installed (personal communications from F. Pertziger, 2018 and A. Merkushkin, 2014). We used a Topcon differential GPS (DGPS) to measure the coordinates of several points located on peaks and crests surrounding the glacier. We selected three points, located on stable terrain, clearly assignable to benchmarks described by past investigators and distributed around the glacier, to perform a coordinate transformation using the Spatial Adjustment Toolbar (affine projection) in ArcGIS.
In contrast to the mass-balance monitoring points, no coordinates were reported for the firn investigation sites of Kislov (Reference Kislov1982). Only elevation information is available. The corresponding symbols on legacy published maps provide only approximate (±500 m) locations of deep snow pits and boreholes. The deep snow pit s1 (cf. Table 6 in Appendix A) was located at an elevation of 4250 m a.s.l. next to the stake profiles connecting two legacy snow pits, approximately corresponding to ac1/c4225 (Fig. 1). The elevation of s2 (4410 m a.s.l., Table 6 in Appendix A) corresponds to the elevation reported for snow pit No. 8 (cf. Fig. 1b). According to F. Pertziger (personal communication, 2018), s2 was located in immediate vicinity of pit No. 8 and boreholes b2_73, b2_74 and b2_75 were drilled not more than 50 m away from pit No. 8. Kislov (Reference Kislov1982) stated that the distance between the pit face of s2 and b2_73, b2_74 and b2_75 was 5, 8 and 14 m. Historical photographs provided by Y. Tarasov and A. Yakovlev allowed us to determine the location of the legacy measurement site of s2/pit No. 8. We used two pictures. One picture was taken between 1973 and 1975 and shows the firn drilling at ~4400 m a.s.l. (Fig. 2a). The second photograph shows snow pit No. 8 and was taken in the 1980s (Fig. 2b). In August 2018, these photographs allowed us to determine the locations where the historical images were photographed. At these sites we took new images with a 50 mm lens on a full frame (24 by 36 mm sensor) digital camera. This camera setup was chosen as ~50 mm focal length on 35 mm film is the most likely way the historical images were recorded. The new pictures are shown in Figures 2c and d and overlaid on the legacy pictures in Figures 2e and f. The skylines of legacy and new pictures match well (Figs 2e and f). The minor discrepancies are related to the lowering of the glacier surface of ~5 m as observable on Figures 2b, d and f. The location of the historical photographs could thus be reconstructed and we estimate the legacy drill/deep snow pit location to be within <50 m of the reconstructed photographer location.
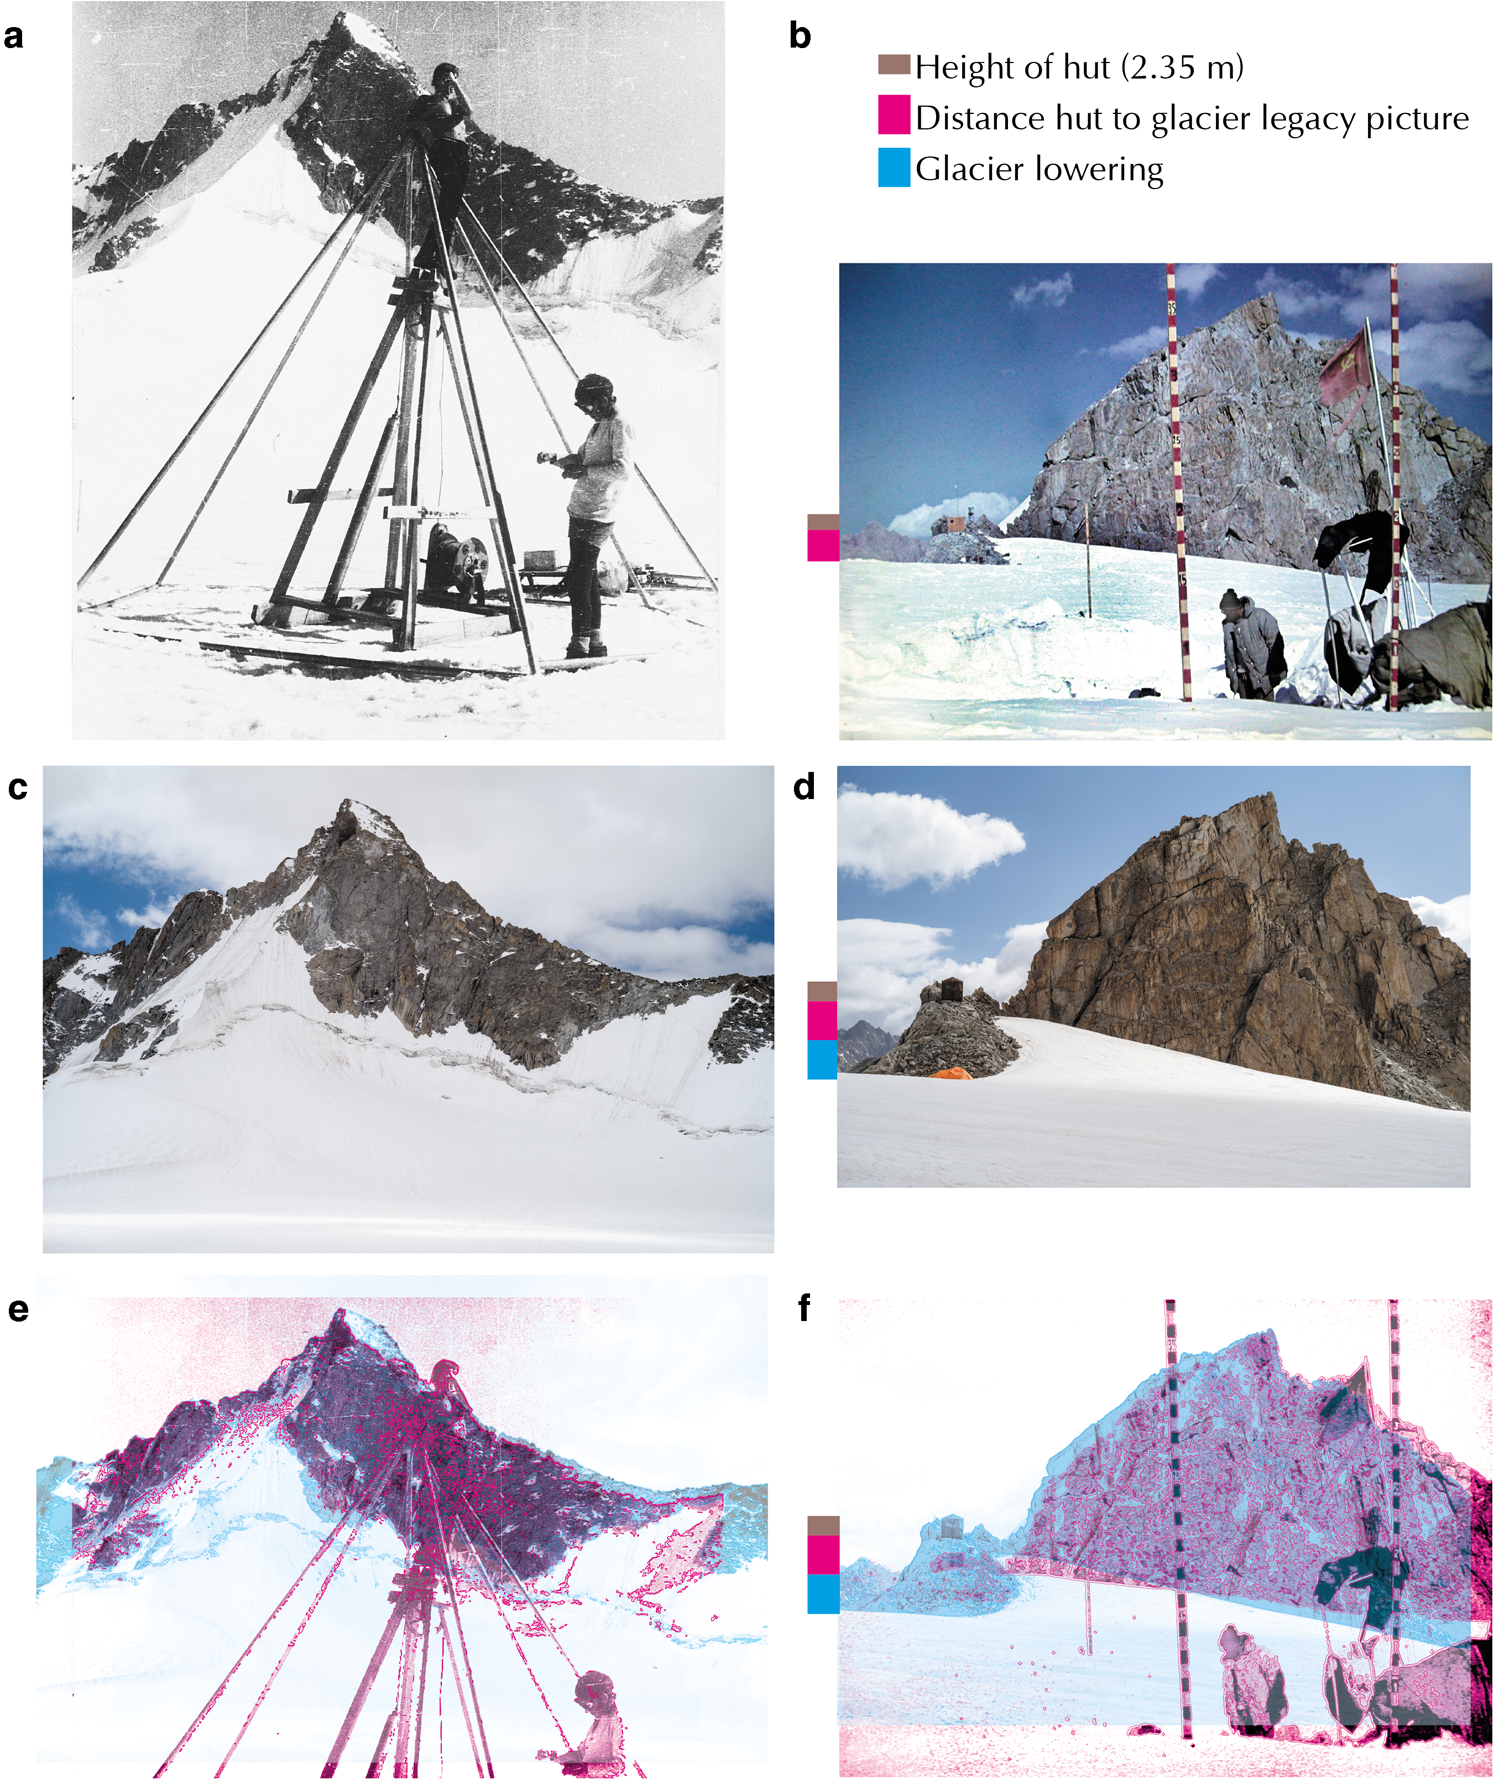
Fig. 2. Historical photographs of past investigations on Abramov Glacier. (a) Picture taken between 1973 and 1975, showing the core drilling at ~4400 m with a thermal drill (unknown photographer, picture provided by Y. Tarasov). (b) Picture from the 1980s showing regular mass-balance measurements at snow pit No. 8 (picture taken by Y. Tarasov and provided by the Centre of Hydrometeorological Service at Cabinet of Minister's of Republic of Uzbekistan (UZHYDROMET). In (c) and (d), pictures from the same locations taken in August 2018 are shown. In (e) and (f), the pictures taken in August 2018 (blue shading) are overlaid by the historical pictures (pink). A lowering of the glacier surface is visible when comparing pictures (b), (d) and (f) (indicated with blue bar to the left of the pictures).
We digitised legacy firn data from figures showing the visible stratigraphy, density, temperature and dust concentration profiles of deep pits and cores. In Kislov (Reference Kislov1982), a series of terms were used to describe the firn stratigraphy, which we summarise into three classes. When using the class snow we refer to Kislov's ‘seasonal snow’, the class firn summarises ‘medium-grained firn’, ‘coarse firn’, ‘firn’ and ‘contaminated firn’, as well as ‘firn with ice inclusions’ and ‘icy firn’ (for both an ice content of 50% is plotted); and ice stands for ‘ice layer with variable thickness’, ‘nodule/ice lens’ and ‘ice’. We only refer this simplified stratigraphy for further analysis as it is mainly based on the distinction between ice and firn, which is relatively objective.
Firn core analysis and dating
Cores c4381, c4225 and c4395 were analysed on site directly after drilling. We inspected the core stratigraphy visually and distinguished the following classes: snow, firn, firn with ice (amount of ice in %) and ice. We furthermore identified dust and visible cryoconite and took note of complementary information such as water saturated core segments. To determine the density profile, we used a steel saw to cut cores into segments of 20 cm length. We weighed the segments with a digital scale, measured the length and diameter of each sample and estimated the percentage of segment volume preserved (to account for defects caused by core catchers and/or uneven breaks).
Core c4382, excluding the uppermost 0.7 m (fresh snow), was stored in polyethylene bags in 0.4–0.7 m segments and shipped to Switzerland for chemical analysis. In a −20°C laboratory, the core segments were inspected visually and the stratigraphy was described using the same classes as for the cores analysed in the field. A picture was taken of each segment with a Nikon Coolpix 500V1.1 camera. Segment length, diameter and weight were recorded to calculate the segment density before removing outer core parts, potentially contaminated by the drilling and handling. Inner decontaminated parts were cut into samples with dimensions of ~80 mm × 18 mm × 18 mm using a modified band saw with stainless-steel blades, Teflon-covered tabletops and saw guides. For each of these inner samples, dimensions and weight were measured to calculate the sample density. Differences between densities determined for the whole core segments and the inner samples lie within $\pm10\%$ , averages of both measurements were used for further calculations. Prior to analyses, samples were melted in individual pre-cleaned 50 ml plastic tubes under inert gas (N2). We measured the concentration of major soluble cations and anions including ammonium (NH$_4^ +$
 ) by ion chromatography (Metrohm 850 Professional IC combined with an 872 Extension Module and an 858 Professional Sample Processor autosampler). The water stable isotopes δD and δ18O were determined with a wavelength-scanned cavity ring down spectrometer (Picarro WS-CRDS, L2130-i Analyzer). Additionally, we measured black carbon (BC) concentrations with a single-particle soot photometer (SP2, Droplet Measurement Technologies).
Annual layers of c4382 are determined using the seasonality of the analysed species: NH$_4^ +$ , δ18O and BC (all of them peaking in summer (Dansgaard, Reference Dansgaard1964; Eichler and others, Reference Eichler2000)) and visible dust layers. For each year, we identified one sample to obtain the depth of the annual horizon. The depth ranges between adjacent samples with increased chemical signals and/or the occurrence of dust layers are interpreted as the uncertainty of the horizon depth σhorizon.
Processing of GPR data
Several studies have used GPR measurements to quantify annual accumulation on temperate glaciers (e.g. Machguth and others, Reference Machguth, Eisen, Paul and Hoelzle2006; Sold and others, Reference Sold, Huss, Eichler, Schwikowski and Hoelzle2015). It is assumed that near the surface, each echo is produced by a single reflector (contrast in dielectric properties) and that these reflectors are ice lenses or other sharp density contrasts in the snowpack (Kohler and others, Reference Kohler, Moore, Kennett, Engeset and Elvehøy1997). Such density contrasts usually result from ice layers and crusts, which form at the snow surface during summer months. The high net accumulation rates in the investigated area are expected to prevent closely spaced reflectors and therefore, the risk of interference between closely spaced echoes is assumed to be minimal and the identification of isochronous horizons possible (Miège and others, Reference Miège2013).
To improve the visibility of reflectors and reduce noise we processed our GPR data following Sold and others (Reference Sold2013). In addition, a static correction was added to correct for the time delay of the first signal from the snow surface. We used the processing software ReflexW (Sandmeier Scientific Software). First, data are spatially interpolated to correct for varying walking speed. A linear interpolation is used to obtain traces with a regular distance of 0.5 m. Second, a frequency bandpass 500–1200 MHz is applied to filter low-frequency noise and high-frequency signal offset and bending. Third, a background removal subtracting the average from all traces in the profile reduces effects of signal ringing and the airwave. Fourth, the profile is corrected statically and fifth, we use a gain function (linear and exponential) to counteract the signal attenuation with depth.
The applied processing steps allow for the identification of a series of internal reflection horizons (IRHs) with maximum two-way travel times (TWT) of 100–165 ns, depending on the site. We identified up to seven IRHs, which are marked manually within ReflexW (cf. Fig. 3). As the IRH are continuous and clearly distinguishable, they are considered as annual layers. To extract annual accumulation layers, it is necessary that between the upper- and lowermost detected IRHs all other IRHs of summer surfaces are present and can be distinguished (Sold and others, Reference Sold, Huss, Eichler, Schwikowski and Hoelzle2015). Only considering the profile sections in which all seven IRHs are visible, the dataset is reduced to 1.9 km of GPR data. When looking at the four uppermost IRHs, 7.1 km of GPR data remain. When focussing on the uppermost reflector, which is interpreted as summer 2017, 0.5 km of GPR data need to be excluded because of some ambiguity in signal interpretation and 8.4 km are retained. The resulting dataset provides spatially distributed information about the subsurface across the study area for one to seven horizons.

Fig. 3. Processed GPR transects No. 0736 (January 2018, a), No. 0782 (August 2018, b) and No. 0795 (August 2018, c) showing IRHs within the firn in the orographic right accumulation area of Abramov Glacier. The profiles are oriented from north-west to south-east (cf. Fig. 1c). Numbered blue lines highlight the identified IRHs 1–7. The firn coring sites are indicated. The TWT time was converted into approximate depths using an average radar wave velocity of 0.2 m ns−1.
To evaluate the layer picking accuracy σGPR, the TWT at intersection points of radar transects are analysed. The average misfit of TWT picks averaged across all depths is 1 ns with lowest absolute misfits for the uppermost horizons. This corresponds to relative misfits between 0.2 and 3.2% for the different layers.
Interpretation of GPR data and in the context of 2018 firn cores
The GPR data are used to relate information from the dated core c4382 to the undated core c4395. For the interpretation of the GPR data measured in January and August 2018, we use complementary information from snow pit and core measurements including densities and firn stratigraphy. The measured density profiles ρ from cores c4381, c4382 and c4395 are used to obtain depth estimates from the radar data which are measured in the time domain. Therefore, we estimate the relative permittivity according to Frolov and Macheret (Reference Frolov and Macheret1999):
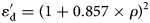
and then obtain the mean radar wave velocity u as follows:

The radar wave velocities obtained for the different horizons based on averaged annual layer densities (ranging from u1 = 0.21 m ns−1 to u7 = 0.19 m ns−1) for core c4382 were used to convert the TWT into depth at the drilling locations. An average radar wave velocity of $\overline {u} = 0.2$ m ns−1 was used to convert TWTs into approximate depths for visualisation in figures and a first interpretation. Subsequently, updated radar wave velocities for each IRH were used to definitely assign IRHs to the visible stratigraphy of c4382.
Based on the obtained depth estimates, we linked GPR transect No. 0736, recorded in January 2018 (Walther, Reference Walther2018) to c4382 drilled during the same field campaign. Next, reflectors detected in the GPR data from August 2018 were allocated to reflectors in profile No. 0736 along the same transect (No. 0782, Figs 3 and 1c). The nearby located GPR transect No. 0795, which was measured in August 2018 and directly connects both drilling sites, was visually matched with the stratigraphy of c4395. This information along with a visual matching of the stratigraphies of both cores (c4382 and c4395) was used to transfer the layer dating to core c4395. In addition, we estimated the dry firn velocity for densities measured at c4395 to range between 0.21 and 0.20 m ns−1.
Accumulation rate calculation
Net annual accumulation rates and related uncertainties were calculated for (i) legacy firn measurements at deep snow pit s2 from the 1970s, (ii) long-term glaciological measurements at snow pit No. 8 for 1969–99 and for (iii) firn cores c4381, c4382 and c4395 drilled in 2018.
Accumulation rates were calculated based on depths of annual horizons d horizon and densities ρ. The uncertainties of the accumulation rates σacc are related to uncertainties in the reported/measured densities σρ and horizon depths σhorizon. The uncertainties σρ and σhorizon were assumed to be independent and combined following Eqn (3) to obtain the accumulation rate uncertainty σacc. For averaged accumulation rates over several years, σacc was combined with the spread (standard error) of the annual accumulation rates:

For (i) the legacy firn measurements at deep snow pit s2, depth and density information were extracted from digitised figures. We assumed σρ to be within 10% of values extracted from figures. The depth range between density and facies changes above and below annual layers assignments in digitised figures was interpreted as σhorizon.
Data from snow pit No. 8 (ii), measured at the end of the ablation season in September, were used for assessing the long-term evolution of net accumulation from 1968–98. For 13 of these 31 years, only accumulation measurements performed at the end of the accumulation season in May are available. These values could not be directly compared to annual accumulation measured in cores or deep pits, which reflect net accumulation roughly over a hydrological year (autumn of year n to autumn of year n + 1). We used a multiple linear regression with two predictors to estimate end of ablation season mass balance for all years. Predictor 1 was the net accumulation in w.e. measured in May of the corresponding year and predictor 2 was the positive degree day sum from June, July and August calculated from daily average temperatures measured at 3837 m a.s.l. which we extrapolated to 4410 m a.s.l. using the reported gradient of −5°C km−1 (Kislov, Reference Kislov1982). The multiple linear regression based on 18 observations yielded an R 2 of 0.83. The root mean square error between measured and extrapolated net accumulation for September is interpreted as the extrapolation uncertainty (σextr = 0.18 m w.e.). To estimate the uncertainties of measured net accumulation rates Eqn (3) is used. We adopted the values reported by Thibert and others (Reference Thibert, Blanc, Vincent and Eckert2008) to estimate σρ and σhorizon. σρ was set to 5% of the measured density and σhorizon = 0.35 m. For the filled time series, σextr was added following the rules of Gaussian error propagation. For averaged accumulation rates over several years, we furthermore added the standard error of the annual accumulation rates to the error budget.
Annual net accumulation rates for cores drilled in 2018 (iii) were calculated based on determined layer depths and measured densities. For c4382, which was dated based on chemical measurements, the average density calculated from measured segment and sample densities was used (see section ‘Firn core analysis and dating’ for a description of these measurements). We determined σhorizon as described above. To estimate σρ, we combined the uncertainties of the core segment density measurement (related to the variations in segment length (0.5 cm) and diameter (0.1 cm) and to the accuracy of the scale of 0.2 g) and the uncertainties of the sample density measurement (related to the accuracy of the scale of 0.2 g and measured sample dimensions of 0.05, 0.1 and 0.1 cm). A further source of uncertainty is related to the potential loss of core material when transporting the core to the lab. We found that the difference of the total length of the lab analysed c4382 and the estimated borehole depth was $\lt \!5\%$ and therefore do not account for this in our uncertainty estimates.
For c4381 and c4395 accumulation rates were determined based on density measurements in the field and the transferred layer dating as described above for c4395. Uncertainties of the density measurements (σρ) performed in the field (as for cores c4225, c4381 and c4395) are related to the accuracy of the scale (0.3 g), variations in core length (0.5 cm) and diameter (0.1 cm). Short-term changes of the segment weight due to the loss of water in the case of saturated segments (only core c4395 was affected) were not taken into account. It was not possible to measure the loss of water when retrieving the core of the borehole, and dripping from the wet cores was minimal. For both cores c4382 and c4395, the depth range between ice and dust layers above and below the identified summer horizon was interpreted as σhorizon. For c4225 we did not calculate accumulation rates as we were not able to transfer the dating to this core.
Our uncertainty estimate does not account for general misinterpretations of the stratigraphy; instead, we use independent information from annual accumulation measurements to validate our interpretation. Furthermore, to reduce the impact of classification biases due to a subjective interpretation, the same observer logged the visible stratigraphy in the field and in the lab.
Firn profile metrics
In addition to net accumulation rates, we determined a series of further parameters namely (i) the simplified ice fraction, (ii) the average firn fraction density and (iii) the average thickness of annual net accumulation layers.
(i) The simplified ice fraction F i is calculated to compare whether the ice content changed over time. We calculate the F i of the different firn profiles following Koerner (Reference Koerner1977) and Fisher and others (Reference Fisher2012):
(4)$$F_{\rm i} = {\sum{T_{\rm i}}\over d} \times 100$$
where F i is a percentage calculated from the sum of the thickness of ice layers T i divided by the total profile depth d. For the ice fraction F i, only continuous ice lenses (i.e. continuous over the full width of the core) and ice layers (i.e. ice) are considered (firn layers with variable ice content i.e. firn with ice are ignored).
(ii) The average firn fraction density is the average density of the entire profile excluding the sections classified as ice.
(iii) The average thickness of annual net accumulation layers is independent from density measurements. This parameter therefore enables rough comparison of recent firn profiles to historical profiles for which density measurements are not available. For recent profiles, the thickness of dated annual net accumulation layers is averaged. For legacy profiles, the thickness of published annual net accumulation layers is averaged. We combined σhorizon and the standard error of the annual net accumulation thickness to estimate corresponding uncertainties.

Results
Location of historical firn measurements
According to the information available to us in January 2018, we believed that we were drilling c4381 and c4382 at the study site of the historical firn investigations performed in the 1970s. The subsequent analysis of GPR data revealed a subsurface heterogeneity in the orographic right accumulation area of Abramov Glacier. We therefore gathered additional data as described above. Based on these data the assessment of the location of the historical firn investigations was revised and an additional core (c4395) was drilled in August 2018.
The location of the historical firn investigation site is shown in Figure 4a. The map shows the very close vicinity of the legacy snow pit No. 8 (converted legacy coordinates) and the location of the photographer taking the drilling picture from the 1970s (picture displayed in Fig. 2a). The second historical photograph from the 1980s showing snow pit No. 8 (Fig. 2b) is ~70 m north-west from the converted coordinates of snow pit No. 8. The site identified by the coordinate conversion and confirmed by the picture of the historical drilling in the 1970s was selected for the drilling of c4395. By chance, this site almost falls onto our previously recorded GPR profile No. 0736 (Fig. 4a).
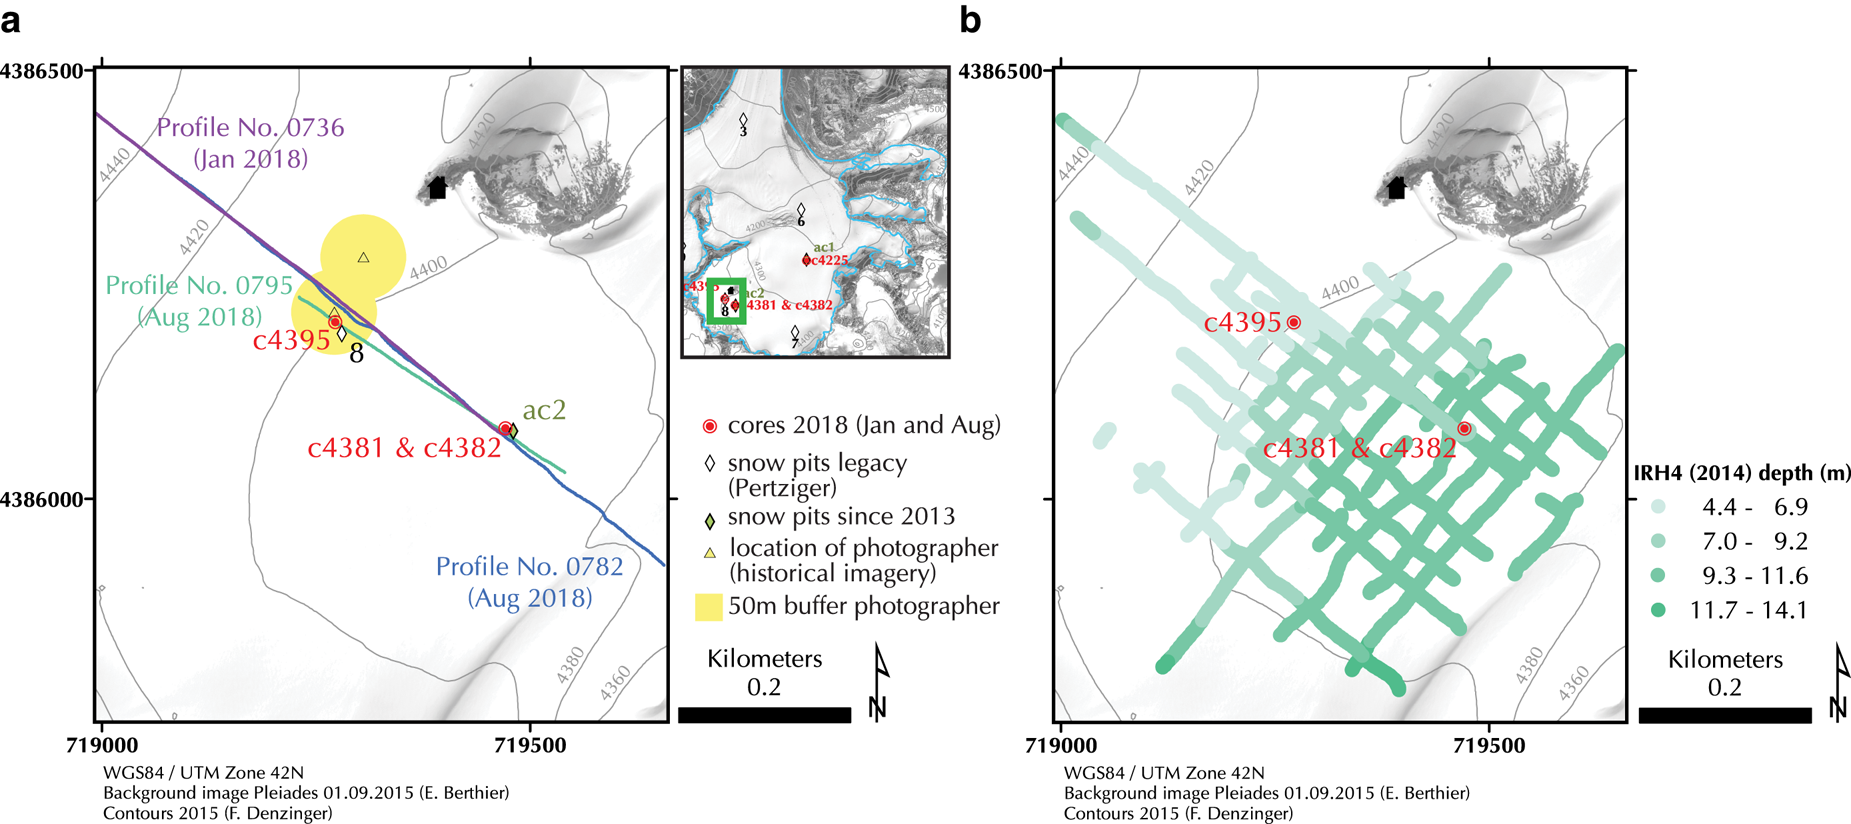
Fig. 4. (a) Map of the main study site located in the orographic right accumulation area of Abramov Glacier (see green box on the map in the upper right corner). The coordinates of recent firn profiles are indicated in red and the locations of legacy investigations based on coordinate transformation and photographer location are shown. The GPR transects shown in Figure 3 are also indicated. Map (b) shows the same area as shown in (a) and gives an overview of the accumulation heterogeneity in the investigation zone. Depth of IRH4 of the analysed GPR transects of the measurements performed in August 2018 are shown. The drill sites of recent cores are indicated with red circles.
Net accumulation rates determined in a recent core
The visible stratigraphy of c4382 is characterised by melt features including ice lenses and dust layers (Fig. 5a). The density profile shows strong fluctuations, but generally increases with depth. Highest densities occur coincident with lenses of bubble-poor ice. Dust layers are sometimes, but not always, accompanied by ice lenses. Moreover, dust layers generally coincide with peaks of one or several of the following analysed species: BC, NH$_4^ +$ and δ18O (Fig. 5b). These peaks are interpreted as annual summer horizons. The respective depths are listed in Table 1 and the uncertainty range of each horizon is indicated with grey shading in Figure 5. Summers 2017, 2016 and 2015 correspond to clear peaks of BC, NH$_4^ +$
 and δ18O and a visible dust layer occurs at each corresponding depth. For summers 2014 and 2013, the BC and NH$_4^ +$
 signals are high and peaks coincide with dust layers, whereas the δ18O signal is strongly smoothed. Summers 2012 and 2011 can be linked to peaks in BC and δ18O. Ice lenses coincide with or occur slightly below dust layers for summers 2017, 2016, 2015, 2014 and 2011. No ice was identified close to the summer surface 2013 and densities are relatively low. Summer 2012 is marked with thin ice lenses. Three additional thick ice lenses are visible in the lower part of the core: a dust-ice layer was formed below the dust horizon of summer 2013 at a depth of 11.7 m, a thick ice lens was formed below the summer surface 2012 at a depth of 13.7 m and another below the summer surface 2011 at a depth of 16.0 m (indicated by black arrows in Fig. 5).
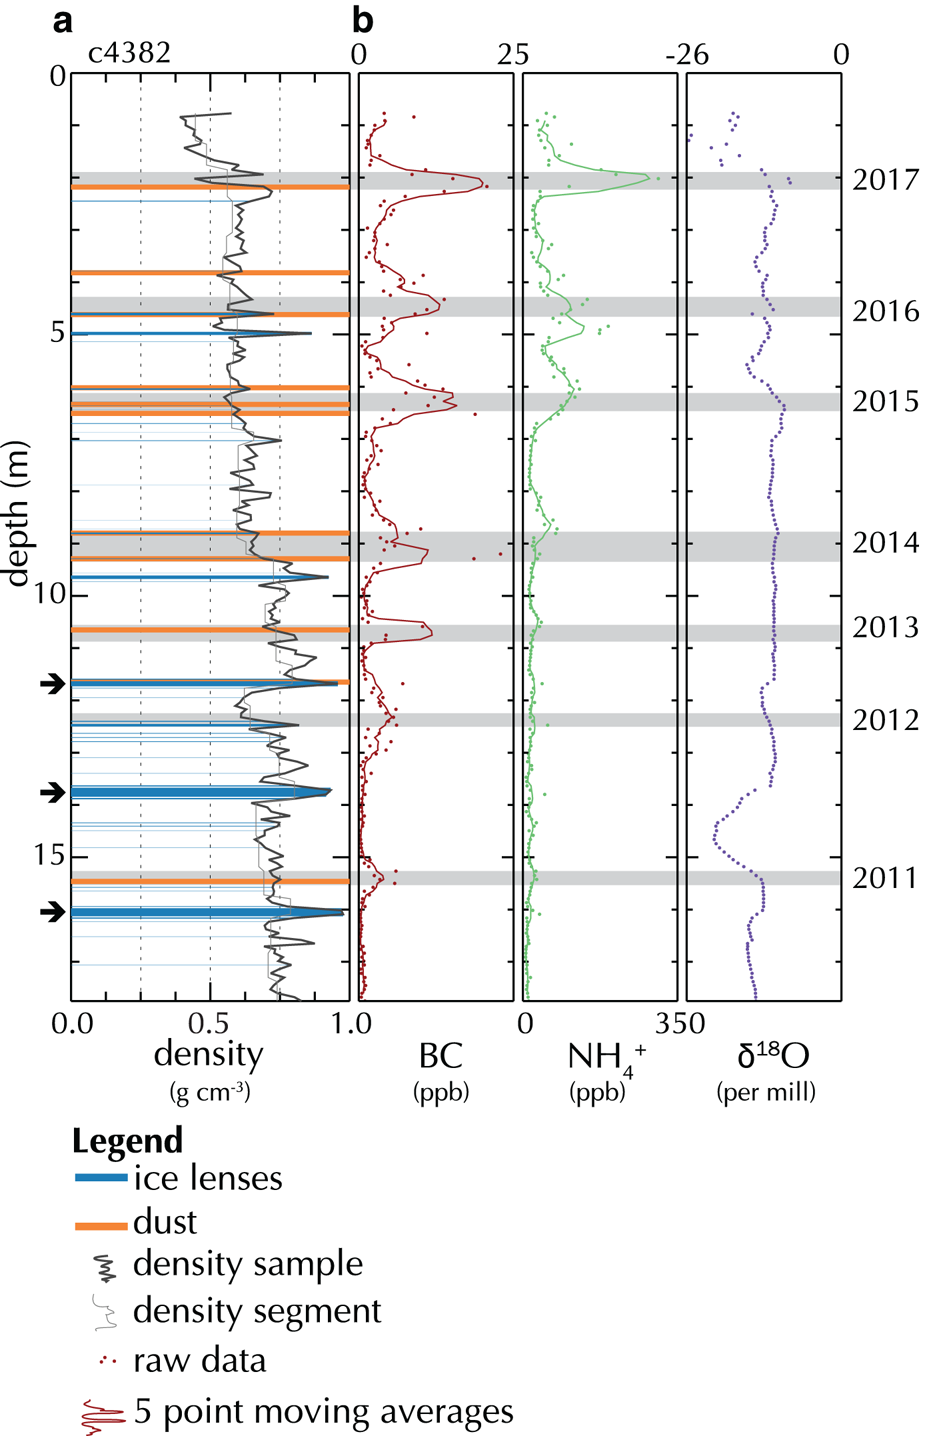
Fig. 5. Firn characteristics and chemical records of c4382 drilled at 4381 m a.s.l. on Abramov Glacier in February 2018. Plot (a) shows the firn stratigraphy (ice lenses in blue; visible dust layers in orange) and density profile (density from core segments in grey and sample densities in black). Measured BC, ammonium (NH$_4^ +$ ) and δ 18O records are plotted as lines (five point moving averages for BC and NH$_4^ +$
 , raw data for δ 18O) under (b). The uncertainty range of identified summer horizons is shaded grey and labelled with their respective year. Arrows indicate additional ice lenses between summer surfaces. The uppermost 0.7 m of the core were not analysed.
Table 1. Depths of annual horizons and net accumulation rates c net obtained from the dated core c4382
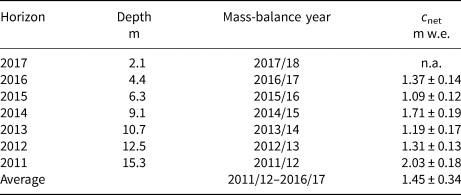
Based on the dated horizons, we determined net accumulation rates for each mass-balance year from 2011/12 to 2016/17 (Table 1). The average net accumulation rate for 2011/12–2016/17 was 1.45 ± 0.34 m w.e. Minimum net accumulation of 1.09 ± 0.12 m w.e. occurred in 2015/16 and accumulation was largest in 2011/12 with 2.03 ± 0.18 m w.e.
Spatial distribution of accumulation
The spatial distribution of accumulation can be derived from GPR data. The information available for c4382 provides local reference information. The detected IRHs are linked to the visible stratigraphy of this core (Table 2). For the four most recent summer surfaces (2014–17), IRHs can be identified and followed throughout the investigated area. In the GPR data from summer 2018, three subjacent IRHs are visible only in the north-western part of the investigated area, where they are located at shallower depths. IRH5, IRH6 and IRH7 are linked to the dated core c4382 using GPR profile No. 0736 acquired in January 2018 (Walther, Reference Walther2018). In transect No. 0736, IRH5–IRH7 are also visible at lower depths around c4382 (Fig. 3a). IRH5 is attributed to the ice lens below the dust layer of summer 2013 (at 11.7 m in c4382). IRH6 is matched with the ice lens of summer 2012 at 12.5 m depth in c4382. IRH7 matches with the ice lens located just below the dust layer of summer 2011 at a depth of 16 m (Fig. 5). Depth discrepancies between the values given in Table 2 and visible from Figure 3 are due to the constant radar wave velocity used for plotting the figure.
Table 2. Overview of picked IRHs in the GPR profiles acquired in August 2018. IRH1 to 7 are linked to the visible stratigraphy of core c4382 (Fig. 5). Depth refers to the horizon depth at core c4382. For IRH5, IRH6 and IRH7 a complementary GPR profile (No. 0736) measured in January 2018 was used to compare IRHs with c4382. Length refers to the total length of GPR transects where the corresponding horizon and the ones above were identified
aIce lens below 2016 dust horizon.
bUpper edge 2014 dust horizon.
cIce lens below 2013 dust horizon.
dIce lens below 2011 dust horizon.
Although the core analysis provides accurate knowledge of accumulation rates at point scale, the GPR measurements indicate that accumulation in the investigated area of Abramov Glacier varies strongly in space. Layer thickness generally increases from the north-east towards the south-west of the studied zone (Fig. 4b). In the north-western part, where layers are shallower, three more layers (IRH5–IRH7) can be identified and allow the accumulation distribution to be tracked back to 2011 (IRH7 in Table 2). Total thickness of the accumulation of seven years (2011/12–2017/18) varies from ~7 m to more than ~16 m.
Linking accumulation rates between two drill sites
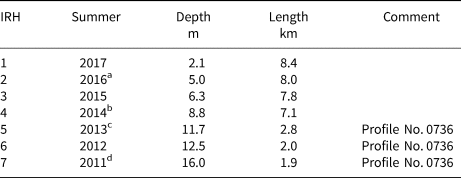
Of the cores drilled in 2018, only c4382 was shipped to Switzerland and dated based on analysed chemical species. Core c4382 was used to cross-date the later drilled c4395. Core c4395 drilled ~240 m northwest of c4382 is characterised by a higher ice content and higher densities than c4382 (Table 3 and Fig. 6). Furthermore, when drilling c4395 in August 2018, we retrieved firn segments with visible liquid water at depths of 8.5–10 m and between 12.1 and 18.4 m, corresponding to 40% of the profile length. Between the two sections with visible liquid water content, drilled firn segments appeared dry. Core c4382 and all other cores drilled in winter 2018 appeared dry.
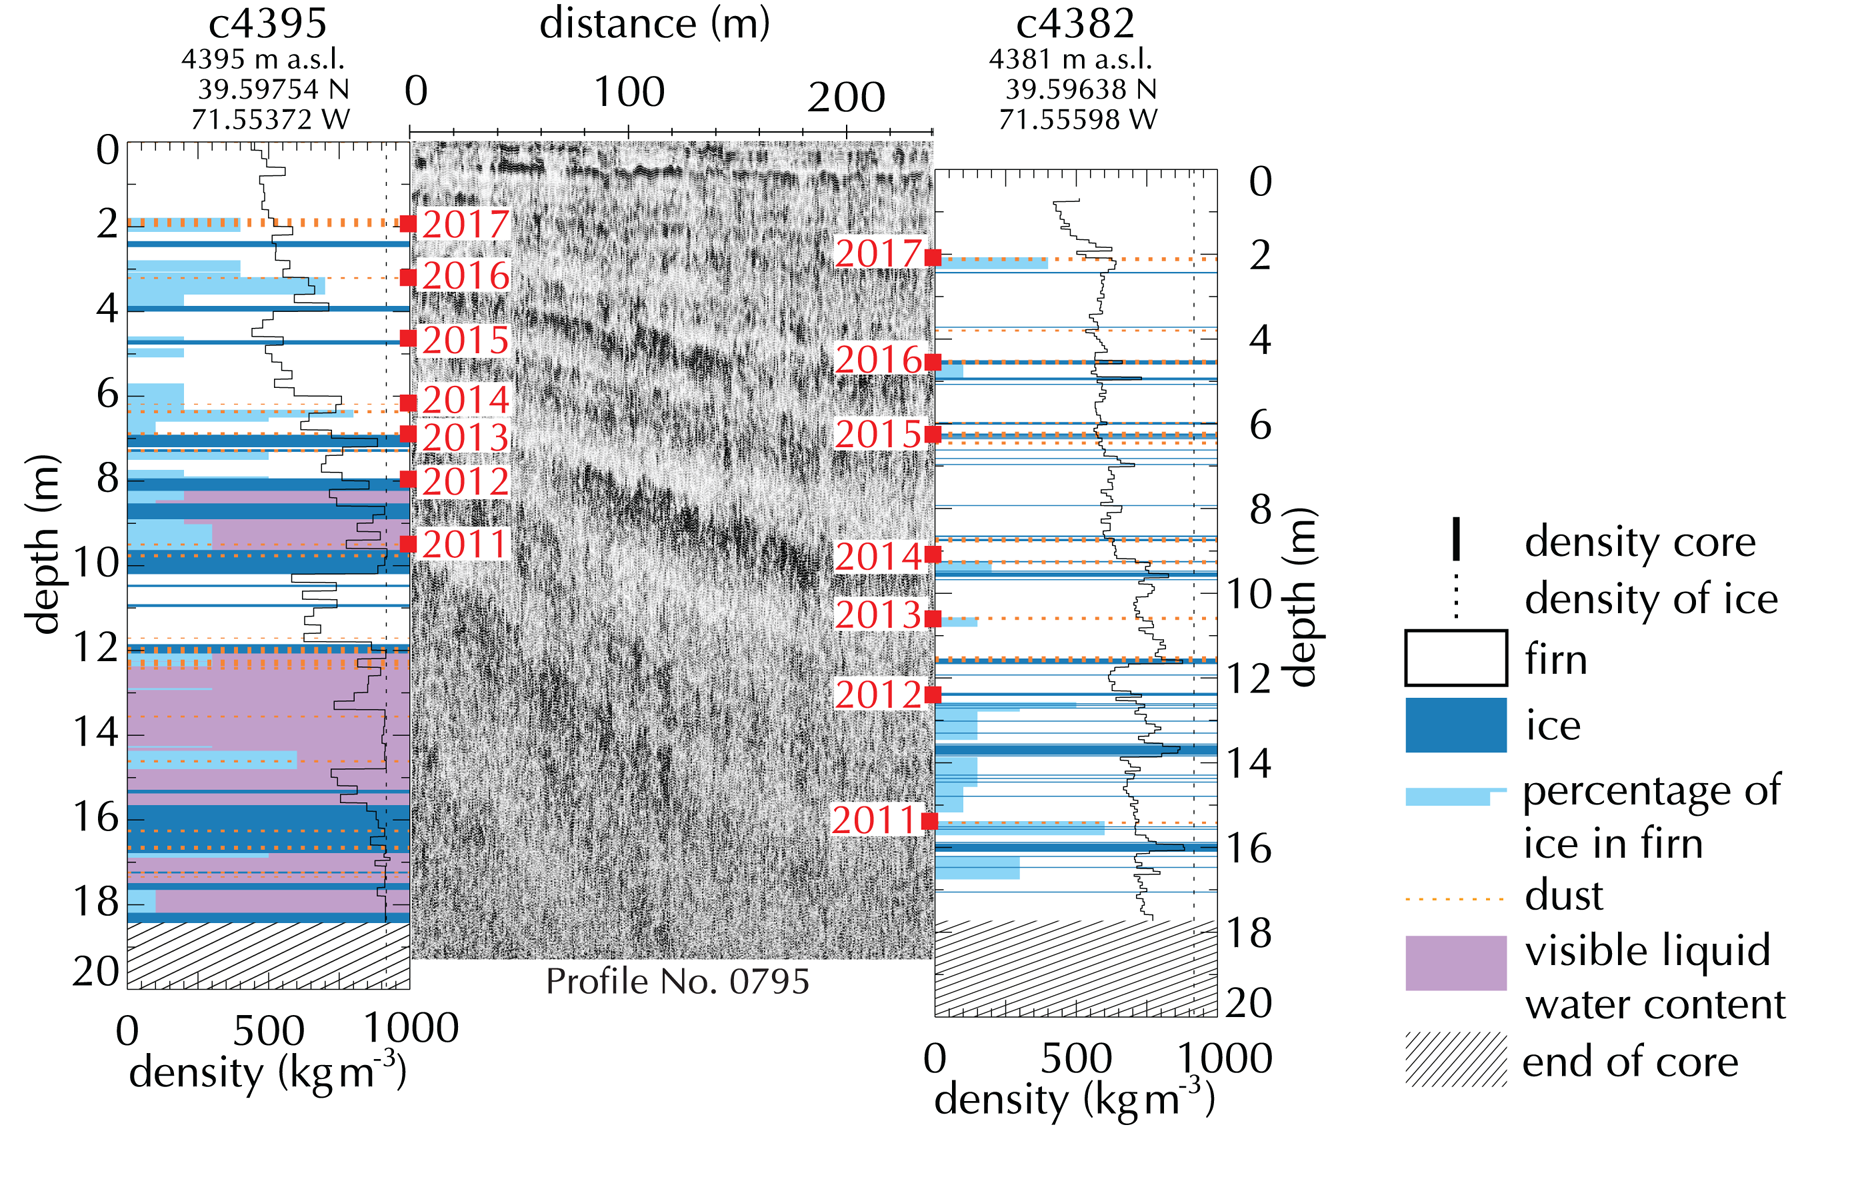
Fig. 6. Connection of information from two recent firn profiles on Abramov Glacier. The firn stratigraphy observed in the dated c4382 (drilled in February 2018, left profile) is linked to the stratigraphy of c4395 (drilled in August 2018, right profile) using a connecting GPR transect (No. 0795) from August 2018
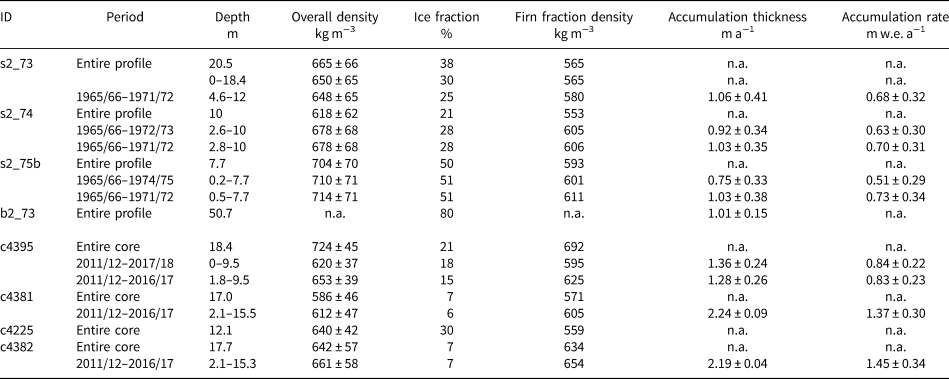
Table 3. Summary of analysed core characteristics for the entire core or respective segments as specified under period (dating is not always available for the entire profile length). Depth refers to the depth of the entire core, respectively to the depth range of the section considered (depth from surface at the corresponding investigation date). Overall density is the average density over the respective profile with the corresponding uncertainty (σρ) and ice fraction is the relative ice content considering the core sections classified as ice. Firn fraction density refers to the density excluding segments classified as ice. Accumulation thickness refers to the average thickness of annual net accumulation layers with its uncertainty σhorizon and accumulation rate to the annual averaged net accumulation rates for the investigated periods and their corresponding uncertainties (σ acc). Legacy measurements at s2 are listed first, the second part of the table contains data for the same location measured in 2018.
Comparing the visible stratigraphy of both cores, the layers in c4395 seem to be compressed indicating reduced net accumulation rates compared to the site of c4382. This is confirmed by spatial distribution of IRHs shown in Figures 3 and 4b. Core c4395 lies in a zone with shallow depths of reflectors where also the lowermost two IRHs were visible in the GPR profiles acquired in summer 2018. In c4395, the summer horizon 2011 corresponds to a depth of 9.5 m. Annual net accumulation rates 2011/12–17/18, calculated based on the transferred layer dating and locally measured densities, are 0.84 ± 0.22 m w.e. a−1 at c4395. Annual accumulation rates are listed in Table 4.
Table 4. Depths of annual horizons and net accumulation rates c net obtained from core c4395
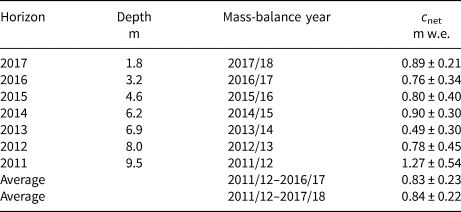
We furthermore evaluate the GPR picks of IRH7 within 50 m of c4395 and find an average depth of 9.9 m and a standard deviation of 0.7 m (u = 0.19 m ns−1 locally calibrated at c4395, see Appendix C) which is somewhat larger than the depth of IRH7 at c4395. The respective minimum and maximum depths of IRH7 within this radius were 8.7 m and 11.6 m (u = 0.19 m ns−1). We use these depths and the average density of c4395 for 2011/12–17/18 (620 kg m−3) to calculate minimum and maximum annual net accumulation rates for 2011/12–17/18 within the 50 m radius and obtain 0.77 and 1.0 m w.e. a−1.
Comparison of recent and legacy firn profiles
In the following, we analyse core c4395 drilled in summer 2018 together with repeated firn observations from the same location from the 1970s. First, we compare the visible stratigraphy, core metrics and accumulation rates of c4395 with measurements at s2_73 from 1973. Then, the comparison is extended to legacy measurements from following years at the same location (s2_74 and s2_75b).
Figure 7 shows the stratigraphy and density profiles of c4395 compared to the legacy firn profiles measured at the same site in 1973 (s2_73). Both profiles are water-saturated in the lower part. Whereas s2_73 is characterised by more ice lenses, c4395 has a higher abundance of firn with variable ice contents. In both profiles, the density increases with depth. Overall densities as well as firn fraction densities (excluding layers classified as ice) down to a depth of 18 m are higher for profile c4395, whereas the calculated ice fraction is lower for the recent profile (Table 3). Net accumulation rates at s2_73 were 0.68 ± 0.32 m w.e. a−1 for 1965/66-–1971/72, whereas a net accumulation of 0.84 ± 0.22 m w.e. a−1 is found for 2011/12–2017/18 at c4395.
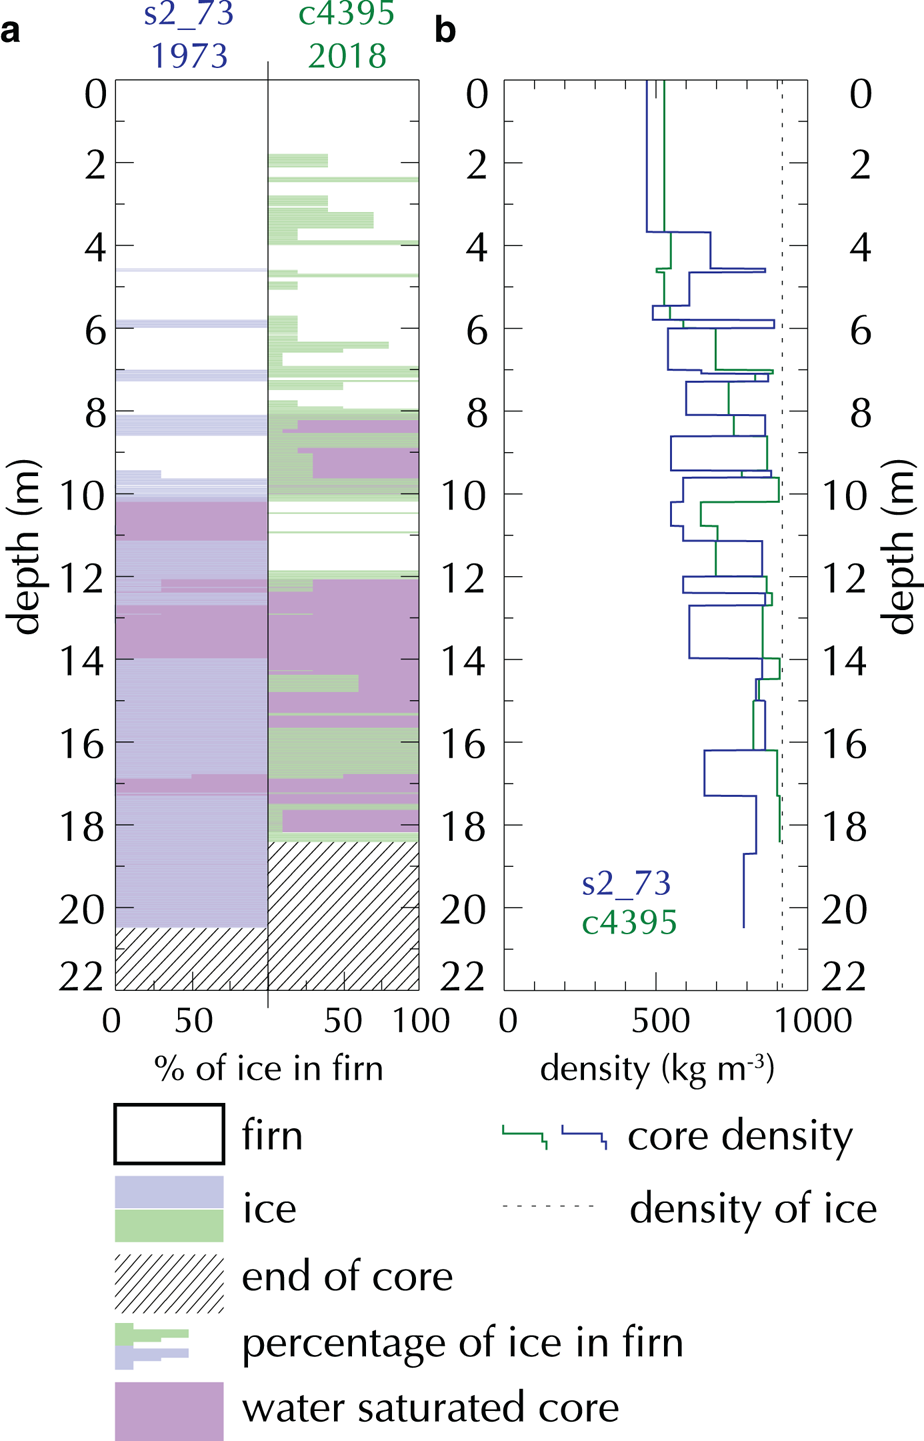
Fig. 7. Comparison of 1973 to 2018 firn stratigraphy. Legacy firn characteristics measured on Abramov Glacier at s2_73 in June 1973 (digitised from Kislov (Reference Kislov1982)) (blue) and current firn characteristics measured at c4395 drilled in August 2018 (green). The depth axes refer to the depth from surface at the corresponding investigation date. (a) Visible stratigraphy of both profiles including ice lenses, and firn with variable ice content (percentage of ice in firn) and visible liquid water content. (b) Measured densities for homogenised depth sections for both profiles.
Measurements at s2 were repeated in the two following years. The measurements from 1974 and 1975 are summarised in Table 3. For comparison, the different values are given for core sections without seasonal snow (1965/66–1971/72 for legacy profiles s2_73, s2_74 and s2_75b and 2011/12–2016/17 for c4395). For s2_73 and the period 1965/66–1971/72, overall density is 648 ± 65 kg m−3 which is similar to 653 ± 39 kg m−3 for c4395 (2011/12–2016/17). For the corresponding core sections (without fresh snow), the ice fraction remains higher and the firn fraction density lower for s2_73 compared to c4395. The firn fraction densities and overall densities as well as the ice fraction increase from 1973 to 1975. Overall densities are somewhat higher for legacy profiles s2_74 and s2_75b than for c4395 and firn fraction densities are approaching values of firn fraction densities observed for c4395. Comparably high ice contents were reported for s2_74 and especially for s2_75b (1965/66–1971/72).
Long-term changes of net accumulation rates
Average net accumulation rates determined from the 1970s for legacy profiles s2_73, s2_74 and s2_75b are lower than values determined for recent years at c4395, but the differences lie within the estimated uncertainties. In Figure 8 and Table 5 the annual net accumulation rates determined for s2_73 and c4395 are compared to averaged net accumulation rates measured at snow pit No. 8. Accumulation was not measured between 1998 and 2011. Net accumulation rates measured at snow pit No. 8 show an increase over time and highest values were measured for 2011/12–2017/18. We found a significant increasing trend (p = 0.006). Including the net accumulation rates measured at s2_73, which were higher than early measurements at snow pit No. 8, the increase remains significant (p = 0.04).
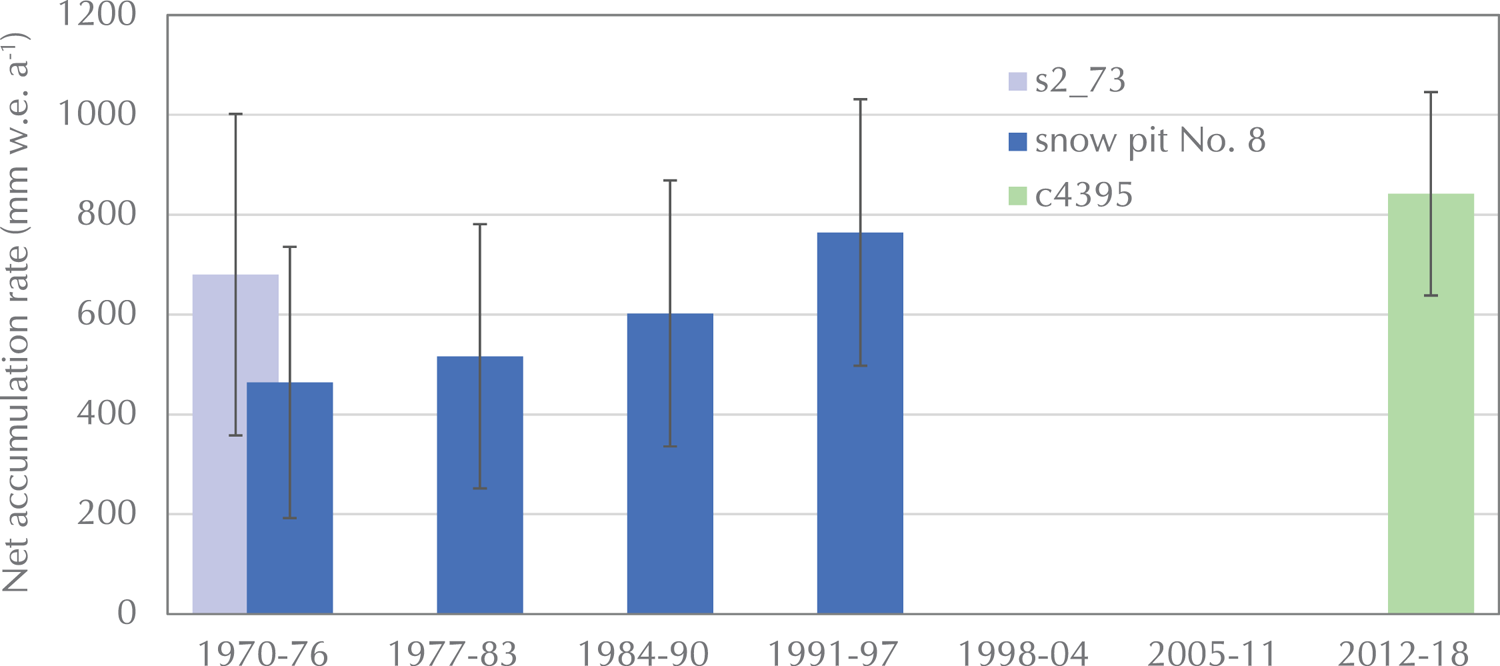
Fig. 8. Long-term net accumulation rates measured in the orographic right accumulation area Abramov Glacier at ~4400 m a.s.l. Annual net accumulation rates are averaged over seven mass-balance years. Averaged annual net accumulation for 1965/66–1971/72 determined from firn profile s2_73 (Kislov, Reference Kislov1982) (light blue). Annual net accumulation measured at snow pit No. 8 in September (provided by F. Pertziger and partly published in Pertziger (Reference Pertziger1996)) (blue). Averaged annual net accumulation for 2011/12–2017/18 determined from c4395 (green). Error bars refer to calculated uncertainties. Periods refer to time ranges of seven mass-balance years (‘1970–76’ refers to the period from 1969/70 to 1975/76).
Table 5. Net accumulation rates obtained from snow pit No. 8 averaged over seven mass-balance years compared to net accumulation rates from s2_73 and c4395
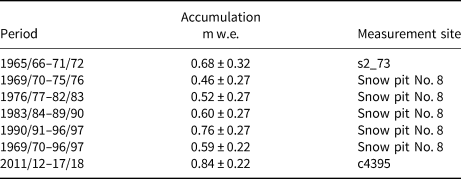
Table 6. Overview of available deep snow pit and core data. The table contains historical data from the 1970s. Type specifies whether the reported data were measured in a deep pit or from a bore hole/core drilled with an electrothermal drill. Own data including firn cores drilled in 2018 are listed in the second part of the table. Either a FELICS or a KOVACS Mark II corer were used (specified under type). The column data specifies which data are reported. ‘strat’ refers to visible stratigraphy, ‘dens’ to density, ‘temp’ to temperature, ‘dust’ to dust concentration
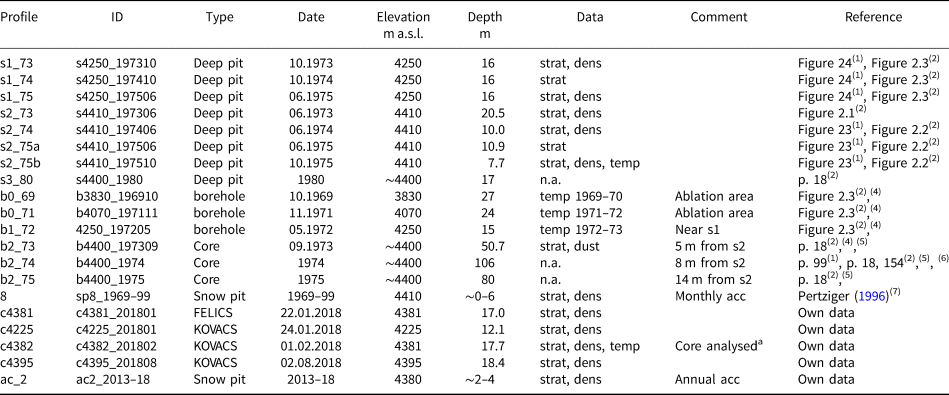
(1) Suslov and Krenke (Reference Suslov and Krenke1980), (2) Kislov (Reference Kislov1982), (3) Kislov and others (Reference Kislov, Nozdrukhin and Pertzinger1977a); (4) Kislov and Nozdrukhin (Reference Kislov and Nozdrukhin1975); (5) Anokhin and others (Reference Anokhin1978); (6) Kislov and others (Reference Kislov, Nozdrukhin and Suslov1977b); (7) annual data published in Pertziger (Reference Pertziger1996), monthly data provided by F. Pertziger.
aAnions/cations, BC, water stable isotopes.
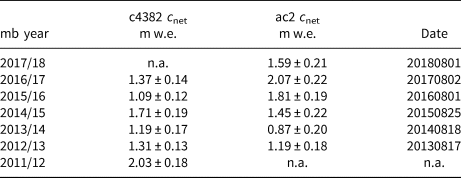
Table 7. Net accumulation rates c net obtained from core c4382 compared to annual net accumulation data from ac2, measured in a combined time system. The floating observation dates of measurements at ac2 are indicated
Discussion
Spatial and temporal representativeness of measurements and implications
Repeated melt and refreezing took place at the drilling site (e.g. ice lenses in Fig. 5). These processes can also cause relocation of chemical species. Typically, NH$_4^ +$ and δ18O are less affected by meltwater re-distribution in firn compared to other chemical species (see e.g. Eichler and others, Reference Eichler, Schwikowski and Gäggeler2001; Trachsel and others, Reference Trachsel2019). Preserved seasonality for BC has been shown in a temperate glacier (Pavlova and others, Reference Pavlova2015). Thus, accumulation rates could be determined for c4382 based on NH$_4^ +$
 , δ18O and BC seasonality as well as on visible dust layers. The comparison of the net accumulation rates determined for c4382 to annual snow pit measurements at ac2 is shown and discussed in Appendix B.
The localisation of the historical investigation site is fundamental to our comparisons. Thanks to the use of two independent inputs consisting of (i) transformed legacy coordinates and (ii) a picture showing the drilling of b2 in the 1970s (Figs 2b, d and f), uncertainties related to the location could be reduced. Core c4395 was drilled within a distance of maximum 50 m from the legacy investigations at s2. GPR profiles around c4395 show that layer depths do not vary substantially within this distance as also visible from IRH4 in Figure 4b. The assessment of IRH7 within the 50 m radius shows that (i) the average depth of IRH7 is deeper than directly at c4395 and (ii) annual net accumulation rates remain somewhat above legacy values even if the most shallow layer picks of IRH7 are used for calculation. Furthermore, comparison of firn characteristics from different profiles acquired within ~10 m distance (c4381 and c4382, not shown) reveals that the stratigraphies are representative at a local scale. Despite the investigation of manifold data, there are uncertainties related to the spatial representativeness of our comparison. The found increase of net accumulation, however, is in line with the glacier-wide mass-balance estimates by Barandun and others (Reference Barandun2015). They showed that since the 1970s net mass balance has become more positive in the accumulation area, whereas melt rates have increased in the ablation area.
The visible firn stratigraphy is not only affected by the observer but by the classification system in general. Whereas a single observer and a consistent system were used for current firn conditions, legacy data was collected in a separate setup. An important difference is the sample size considered for the stratigraphic interpretation. We analysed cores of a few centimetres in diameters while in the 1970s the stratigraphy was described for an ~1 m wide wall of a deep snow pit. Some of the observed differences between s2_73 and c4395 (more ice lenses/less firn with variable ice content in the past) may to some extent be related to different classification systems.
Net accumulation rates derived from firn cores and deep snow pits represent the climatic mass balance including internal accumulation from refreezing below the last summer horizon for the uppermost years and partially account for refreezing for subjacent annual horizons. However, net accumulation rates derived from snow pit No. 8 (and also ac2) only account for the surface mass balance. Figure 8 thus shows slightly overestimated accumulation rates for the periods 1965/66–1971/72 and 2011/12-2017/18. However, this overestimation is relatively small as only refreezing of the uppermost year of each firn profile is fully accounted for. According to Suslov and Krenke (Reference Suslov and Krenke1980), 90–93% of refreezing takes place in the uppermost 6 m of the firn column (excluding the seasonal snow pack). This means that the accumulation rates estimated for c4395 (2011/12–2017/18 down to a depth of 9.5 m) only include the entire internal accumulation for 2017/18 and reduced shares for the subjacent horizons. Therefore, the contribution of internal accumulation to net accumulation rates determined in firn profiles remains negligible for the comparison presented in Figure 8.
Data from the repeated historical investigations including overall density, firn fraction density and ice fraction at deep pit s2 (s2_73, s2_74, s3_75b in Table 3) highlight that the firn profiles at ~4400 m a.s.l. are affected by annual melt conditions. For s2_75b measured in October 1975, after a summer of extraordinary melt, overall density, firn fraction density and ice fraction are higher than for profiles s2_73 and s_74 (measured in June). Also the recent data indicate a year-to-year variation with net accumulation rates varying between 1.27 ± 0.54 and 0.49 ± 0.3 m w.e. with most positive net accumulation observed for 2011/12 (Table 4). Despite these year-to-year variations, the recent investigations are assumed to be representative for present conditions. Since the re-initialisation of mass-balance measurements on Abramov Glacier in 2011, positive net mass balances have been observed at ~4400 m a.s.l. Even if surface melt continued after the drilling of c4395 in August 2018, further refreezing and a corresponding increase in ice fraction and firn density is hampered by the fact that subsurface temperatures were already at the melting point in August 2018. The substantial data gap after the cessation of the Soviet monitoring activities reduces the temporal representativeness of the presented net accumulation time series. Based on the available data it is not possible to determine whether accumulation conditions at the investigation site have been stable since the 1990s, when net accumulation rates were similar to today's values.
Discussion of firn observations and underlying processes
There has not been a substantial change of the firn cover at ~4400 m a.s.l. on Abramov Glacier. The densities observed in 2018 remain similar to legacy values, the visible stratigraphy of c4395 and s2_73 look comparable and liquid water was observed in both firn columns. Today's ice fraction, however, is lower than the values observed in the 1970s. Furthermore, we find an increase of net accumulation rates. The decrease in ice fraction may be related to the increase of snow and firn volume with today thicker seasonal snow packs insulating the subsurface from the winter cold, thereby reducing the cold content available to refreeze meltwater. Today, melt conditions are abundant at ~4400 m a.s.l. as evident from melt features within firn cores and the persistence of firn with visible liquid water content. As described above, it is also possible that apparent differences in ice fraction may be caused to some extent by differences in classification systems and related uncertainties.
The presence of liquid water within the firn column during the melt season indicates that surface melt and subsurface water storage are lasting processes in the accumulation area of Abramov Glacier. In core c4395, we observed liquid water above and below firn segments which appeared dry (Figs 6 and 7). An ice layer at 10 m depth seemed to prevent further downward percolation of water. It is possible that the water trapped below the ice layer was transported there by lateral percolation. The reduced visibility of GPR signals at depths below ~10 m in profiles measured during summer 2018 compared to profile No. 0736 from January 2018 is possibly linked to seasonal fluctuations in firn water content (Fig. 3). Appendix B contains further discussion of the impact of firn water content upon GPR measurements. Investigations in the 1970s showed that the subsurface water table fluctuates in response to surface melt, but it was also observed that liquid water occurred below ice layers (Glazyrin and others, Reference Glazyrin, Glazyrina, Kislov and Pertzinger1977; Kislov, Reference Kislov1982). Based on this observation, Kislov (Reference Kislov1982) interpreted that subsurface water was also present during winter. Furthermore, both studies explained the presence of water below ice lenses with water transport through crevasses, locally thinner ice lenses and horizontal flow.
Although the differences of net accumulation rates at c4395 compared to s2_73 lie within calculated uncertainties, a recent increase of net accumulation rates at ~4400 m a.s.l. is significant when data measured at snow pit No. 8 from 1969 1997 are considered (Fig. 8 and Table 5). We also note that the long-term average thickness of annual net accumulation layers 1923–73 derived by dust layer counting for b2_73 was ~1 m a−1 (Kislov and Nozdrukhin, Reference Kislov and Nozdrukhin1975). Current average thickness of annual net accumulation is 1.3 times higher than this long-term value (Table 3). This even indicates that current amounts of precipitation are above long-term averages of the 20th century. According to snow pit No. 8 (Fig. 8 and Table 5), accumulation rates were lowest in the 1970s and 1980s when the glacier wide mass balance was also very negative (Barandun and others, Reference Barandun2015).
According to regional trends from the gridded data product Climatic Research Unit TS 4.01 for 1950–2016, air temperatures in Central Asia continued to increase after the 1970s and 1980s (Haag and others, Reference Haag, Jones and Samimi2019). In the context of increasing air temperatures, a recent increase of melt rates in the accumulation area of Abramov Glacier is likely. The observed net accumulation increase might thus only partly reflect a recent increase of solid precipitation. Recently increased melt rates and increased precipitation rates may compensate each other at ~4400 m a.s.l. on Abramov Glacier. Meanwhile, ablation has increased in the ablation area (Barandun and others, Reference Barandun2015). Following Dyurgerov and Dwyer (Reference Dyurgerov and Dwyer2001), this concurrent increase of net accumulation in the accumulation area and melt in the ablation area could lead to a steepening of the mass-balance gradient compared to the 1970s.
Given the trend towards increased net accumulation rates at ~4400 m a.s.l., the slight surface lowering since the 1980s detected based on legacy pictures is not self-explanatory. The observed lowering agrees with the geodetic elevation changes (1975–2015) for this part of the glacier determined by Denzinger and others (Reference Denzingerin press). The very moderate surface lowering in the accumulation area contrasts sharply with the observed surface lowering of up to 151.3 ± 5.5 m on the glacier tongue (Denzinger and others, Reference Denzingerin press). The slight surface lowering in the accumulation area may be related to glacier dynamics and/or may have happened in the 1980s or during the period without available observations.
Regional context
Our results of increased net accumulation rates for Abramov Glacier, based on in situ data, provide complementary information to local and regional studies based on remote-sensing data and modelling approaches. Whereas the glaciological mass balance of Abramov Glacier has been predominantly negative over the last years, no acceleration of mass loss has been detected (Denzinger and others, Reference Denzingerin press). No acceleration of mass loss was identified by modelling studies covering the 1999–2011 period without in situ measurements (Barandun and others, Reference Barandun2015, Reference Barandun2018). This is in contrast to the findings for the Himalaya by Maurer and others (Reference Maurer, Schaefer, Rupper and Corley2019) who found a doubling of the average mass loss from 2000–2016 compared to 1975–2000. The increased net accumulation rates on Abramov Glacier suggest that in the accumulation area the mass loss effects of atmospheric warming are potentially compensated by recent increases in solid precipitation. Abramov Glacier is located close to the Kunlun Shan and East Pamir regions for which Shean and others (Reference Shean2020) identified a positive mass change during 2000–18. An increase in solid precipitation may be the reason for this so-called mass-balance anomaly (Yao and others, Reference Yao2012; de Kok and others, Reference de Kok, Tuinenburg, Bonekamp and Immerzeel2018). Our results suggest that the accumulation area of Abramov Glacier is affected by this precipitation increase. Furthermore, Haag and others (Reference Haag, Jones and Samimi2019) show that Abramov Glacier is located on the edge of a region with positive precipitation trends for 1950–2016. The effect of a precipitation increase, however, cannot fully compensate for the increase of available melt energy at the low(er) elevation Abramov Glacier. Despite the presumed precipitation increase, the glacier-wide mass balance of Abramov Glacier is negative and ablation rates on the glacier tongue have increased over the last few decades (Barandun and others, Reference Barandun2015, Reference Barandun2018). Overall, our results in the context of glacier-wide mass balances of Abramov Glacier (Barandun and others, Reference Barandun2015, Reference Barandun2018) are in accordance with the regional mass change distribution found by Brun and others (Reference Brun, Berthier, Wagnon, Kääb and Treichler2017), who argue that the Pamir is a region of transition from positive to negative mass balances and located between regions with mass gains and losses. They found relatively low mass losses for the Pamir and Pamir Alay and state that the positive mass anomaly centres upon the Western Kunlun Shan, where glaciers are located at high elevations. Abramov Glacier, which is located at lower elevations, has a negative glacier-wide mass balance, but the net accumulation increase at ~4400 m a.s.l. indicates that the glacier is still affected by a recent precipitation increase. Conversely, Lambrecht and others (Reference Lambrecht, Mayer, Wendt, Floricioiu and Völksen2018) investigated the relatively nearby Fedchenko glacier (Western Pamir) and found an overall large glacier thickness decrease both at high elevations and in recent years. Given these differences, it is thus valuable to have in situ information from several sites to better understand patterns identified by remote-sensing and modelling studies.
Conclusions and outlook
We presented a comparison of unique in situ historical firn data from the 1970s to a current firn profile for Abramov Glacier located in a data sparse region. Our results indicate that the firn column at ~4400 m a.s.l. on Abramov Glacier has not seen substantial changes since the 1970s although the net accumulation rates have increased recently (0.84 ± 0.22 m w.e. for 2011–18 compared to 0.68 ± 0.32 m w.e. for 1965–72 and 0.59 ± 0.22 m w.e. for 1970–97). Recent net accumulation rates are characterised by high year-to-year variations. As there is no data available for more than one decade prior to the most positive of the recent mass-balance years (2011/12), we were not able to assess the exact timing of the accumulation increase.
Our results reveal a series of questions which go beyond the scope of this study. The application of a coupled subsurface and energy balance model could contribute to a better understanding of the firn evolution of Abramov Glacier and its effect on the glacier mass balance. Such an approach has the potential to (i) quantify refreezing processes within the firn column, (ii) assess compensating effects related to changes in precipitation amounts and the availability of melt energy and (iii) investigate the period from 1999 and 2011 for which no data are available. To understand the potential changes of the atmospheric drivers of glacier evolution in general and to run such a model, it is necessary to assess meteorological data. As data from weather stations are sparse for this region, use of reanalysis data is a prerequisite. Efforts to downscale regional climate data over the western edge of HMA will contribute valuable input data to increase our process understanding of glacier changes in this data sparse region.
Acknowledgments
We thank Anastasia Cheremnykh, Mukhammed Esenaman Uluu, Daniel Farinotti, Adrien Gilbert, Sven Girod, Matthias Huss, Ruslan Kenzhebaev, Mario Kummert, Anna-Lena Kopp, Ivan Lavrentiev, Andreas Linsbauer, Philipp Schuppli, Silas Walther, Firdavz Vosidov and Jonas Wicky for their efforts in the field and to Theo Jenk, Bolot Moldobekov, Azamat Ozmonov and Ryskul Usubaliev for their support with logistics. A special thanks goes to Martina Barandun and Tomas Saks for their invaluable support in coordinating diverse field activities. We thank Sabina Brütsch for the lab analysis and Leo Sold for his help with data plotting. We greatly acknowledge the valuable comments and information on legacy investigation that we received from Felix Pertziger, Alex Merkushkin, Yuri Tarasov and François Valla and Andrey Yakovlev. We thank Andrew Tedstone for edits that increased the clarity of this paper. We sincerely thank the scientific editor Dr. Carleen Reijmer, the Associate Chief Editor Dr. Hester Jiskoot and the two anonymous reviewers whose thorough comments helped us to improve this manuscript. This study was financed by the Swiss National Science Foundation (SNSF), grant 200021_169453 and the Project CICADA (Cryospheric Climate Services for improved Adaptation, contract no. 81049674 between the Swiss Agency for Development and Cooperation and the University of Fribourg).
Appendix A: Overview of available deep snow pit and core data
An overview of firn data from deep snow pits and cores is given in Table 6.
Appendix B: Comparison of net accumulation rates to annual measurements
We compared net accumulation rates determined for c4382 to independent annual accumulation measurements performed at ac2. Obtained annual layer thickness in m w.e. agree relatively well with the measurements carried out at the same site for the years 2013–2015 (see Table 7). Measurements at ac2 were performed in a combined time system (Cogley and others, Reference Cogley2011), in which the mass balance is determined based on the detection of a stratigraphic minimum on a floating observation date (corresponding dates given in Table 7). This especially affects the measurements of the years 2016 and 2017, when annual accumulation measurements were performed relatively early in the ablation season at the beginning of August. Annual layer thicknesses obtained from the core indicate that there was a mass loss of about 80 mm w.e. between the investigation date and the end of the ablation season for both years. This agrees well with a model-based temporal homogenisation of the annual layer thickness measurements following Barandun and others (Reference Barandun2015). These differences between net accumulation rates determined at the firn profile and with annual snow pit measurements thus indicate the implications of varying observation periods for glaciological mass balance time series. Equally, mass balance measurements provide valuable complementary information to reduce uncertainties in layer dating for melt-affected cores.
Appendix C: Discussion of firn with visible liquid water content with regards to GPR data
The occurrence of water-saturated firn on the one hand hampers the propagation of the GPR signal, allowing for an estimate of the spatial extent of the presence of liquid water within the firn. On the other hand, variable firn water content affects the radar wave velocity Bradford and others (Reference Bradford, Harper and Brown2009), complicating the TWT to depth conversion. The liquid water content in the accumulation area of Abramov Glacier, is however limited. No water table is visible in any of the GPR data from Abramov Glacier, whereas Lambrecht and others (Reference Lambrecht, Mayer, Bohleber and Aizen2020) observed such meltwater tables on even higher locations on Fedchenko glacier. On Abramov Glacier, meltwater seems to run off through crevasses which are abundant in the area. We were not able to measure the firn water content in the field and therefore used a dry firn assumption to estimate radar wave velocity despite the observed liquid water in c4395. The velocity of $\overline {u} = 0.2$ m ns−1 appears to be a valid estimate as Macheret and others (Reference Macheret, Moskalevsky and Vasilenko1993) reported 0.18 m ns−1 for the same site. We expect the velocities for the GPR profiles measured in 2018 (especially for profile no. 0736 measured in winter) to be higher than the published value for several reasons: (i) The value reported by Macheret and others (Reference Macheret, Moskalevsky and Vasilenko1993) was determined from radar measurements performed during summer when liquid water content is expected to be higher than during winter. (ii) The radar wave velocity was determined for a reflector depth of 32.5 m whereas the horizons of interest in our case are located at shallower depths (max. ~16 m). Average velocities are expected to be lower at greater depths. Macheret and others (Reference Macheret, Moskalevsky and Vasilenko1993) mention an overall firn density of 734 kg m−3 whereas the densities to the depths of ~9.5 m at c4395 and ~15.5 m at c4381/c4382 were lower (cf. Table 3). To further evaluate the dry firn assumption, we recalculated velocities after relating TWTs to layer depths in cores. This analysis was done for winter GPR profile no. 0736 and c4382 as well as for summer GPR profile no. 0795 and c4395. Resulting velocities at depth (IRH7) were ~0.01 m ns−1 lower than the estimates using the dry firn assumption for the respective depth for summer and winter. The overall obtained minimum velocity was u = 0.19 m ns−1.


 Open access