


1. Introduction
In the industrial context of energy conservation and emission reduction, the aerodynamics of ground vehicles has raised a lot of concern from engineers and researchers. In particular, aerodynamic drag, which is dominant for high-speed driving conditions and proportional to the square of the velocity (Hucho Reference Hucho1998), is now considered as a priority target by car manufacturers to reduce fuel consumption. Thus more research is devoted to aerodynamic drag reduction, together with specific attention paid to the presence of crosswinds, a very common feature for real driving conditions. Howell (Reference Howell2015) investigated different vehicle types, and established that at  $10^\circ$ yaw (producing a crosswind of 17 % of the car speed), the drag coefficient increase is in the range
  $0.03$–
 $0.06$ for real car geometries, corresponding to
  $10$–
$10$– $20\,\%$ of the drag coefficient at null-yaw condition. As also reported by Howell (Reference Howell2015), this increase is related to an induced drag effect associated with the aerodynamic force component perpendicular to the wind axis. It should be also considered that the vehicle clearance (distance to the ground) and pitch resulting from different mass loading are other flow conditions that also influence the drag.
Most of the fundamental research on ground vehicles aerodynamics focuses on simplified three-dimensional (3-D) bluff bodies, such as the Ahmed body (Ahmed, Ramm & Faitin Reference Ahmed, Ramm and Faitin1984). In particular, the square-back version of the Ahmed body represents those types of ground vehicles with a flat back, such as minivans, sport utility vehicles, vans or lorries for which the main source of aerodynamic drag is the base pressure, accounting for about  $70\,\%$ of the total drag (Ahmed et al. Reference Ahmed, Ramm and Faitin1984; Hucho & Sovran Reference Hucho and Sovran1993). Therefore, research works concentrate on the turbulent recirculating region or near wake aft the body base. For a square-back bluff body (Ahmed or similar bodies), three types of global dynamics have been identified experimentally (Duell & George Reference Duell and George1999; Khalighi, Chen & Laccarino Reference Khalighi, Chen and Laccarino2012; Grandemange, Gohlke & Cadot Reference Grandemange, Gohlke and Cadot2013b; Volpe, Devinant & Kourta Reference Volpe, Devinant and Kourta2015; Perry, Pavia & Passmore Reference Perry, Pavia and Passmore2016; Evrard et al. Reference Evrard, Cadot, Sicot, Herbert, Ricot and Vigneron2017; Pavia, Passmore & Sardu Reference Pavia, Passmore and Sardu2018; Schmidt et al. Reference Schmidt, Woszidlo, Nayeri and Paschereit2018; Haffner et al. Reference Haffner, Borée, Spohn and Castelain2020; Pavia et al. Reference Pavia, Passmore, Varney and Hodgson2020) and retrieved numerically (Östh et al. Reference Östh, Noack, Krajnović, Barros and Borée2014; Pasquetti & Peres Reference Pasquetti and Peres2015; Evstafyeva, Morgans & Dalla Longa Reference Evstafyeva, Morgans and Dalla Longa2017; Lucas et al. Reference Lucas, Cadot, Herbert, Parpais and Délery2017; Dalla Longa, Evstafyeva & Morgans Reference Dalla Longa, Evstafyeva and Morgans2019; Fan et al. Reference Fan, Xia, Chu, Yang and Cadot2020; Podvin et al. Reference Podvin, Pellerin, Fraigneau, Evrard and Cadot2020), namely the vortex shedding modes, the pumping motion of the recirculating region and the steady wake instability. While vortex shedding (Roshko Reference Roshko1993) and wake pumping (Berger, Scholz & Schumm Reference Berger, Scholz and Schumm1990) were already recognized as major ingredients of bluff body wake dynamics, the steady instability leading to a permanent wake asymmetry was observed only recently in the seminal work of Grandemange et al. (Reference Grandemange, Gohlke and Cadot2013b). In a crosswind, the flow gets more complex with the creation of 3-D separations along the longitudinal edges of the body, producing a system of streamwise vortices upstream of the recirculating region at the base (Hassaan, Badlani & Nazarinia Reference Hassaan, Badlani and Nazarinia2018; McArthur et al. Reference McArthur, Burton, Thompson and Sheridan2018). These vortices are associated with induced drag and interact with the recirculating region.
When the body is aligned with the wind axis, the steady instability manifests as left/right (resp. top/bottom) asymmetric mirror states of the near wake aft the base, called  $y$-instability (resp.
  $z$-instability). In this terminology,
  $y$ and
  $z$ refer to the wake asymmetry directions, where the
  $z$-direction is taken perpendicular to the ground. Grandemange, Gohlke & Cadot (Reference Grandemange, Gohlke and Cadot2013a) showed how the asymmetry direction depends on the base aspect ratio. The
  $y$-instability, which is prone to occur for a square back of base aspect ratio
  $H/W<1$, corresponds to a pure reflectional symmetry breaking, whereas the
  $z$-instability obtained with
  $H/W>1$ does not, strictly speaking, because the symmetry in that direction is already broken by the ground and the body supports. Nevertheless, the
  $y$- and
  $z$-instability origins are the same, and the asymmetry direction corresponds to the major axis of the rectangular base when the two reflectional symmetries of the geometry are respected (Legeai & Cadot Reference Legeai and Cadot2020).
The steady instability is sensitive to the distance to the ground (clearance) as well as both the yaw and pitch angles of the model. Grandemange et al. (Reference Grandemange, Gohlke and Cadot2013a) showed that ground clearances larger than  $8\,\%$ of the body width are necessary to observe the steady instability. The dependency of this critical clearance with the Reynolds number has been studied in Cadot, Evrard & Pastur (Reference Cadot, Evrard and Pastur2015). For the wake subjected to the
  $y$-instability, yaw angles as small as
  $\beta \approx 1^\circ$ are sufficient to select one of the two mirror asymmetric states involved in the bi-stable dynamics observed at zero yaw (Cadot et al. Reference Cadot, Evrard and Pastur2015; Volpe et al. Reference Volpe, Devinant and Kourta2015; Brackston et al. Reference Brackston, García De La Cruz, Wynn, Rigas and Morrison2016; Perry et al. Reference Perry, Pavia and Passmore2016; Bonnavion & Cadot Reference Bonnavion and Cadot2018). Similarly, the ground, the body supports, the pitch and also the yaw are able to select either bi-stable dynamics or a single state in the case of the
  $z$-instability (Bonnavion & Cadot Reference Bonnavion and Cadot2018; Bonnavion et al. Reference Bonnavion, Cadot, Herbert, Parpais, Vigneron and Délery2019).
Free stream turbulent intensity is also an important factor for ground vehicles aerodynamics as it may reach up to 16 % in real driving conditions (Wordley & Saunders Reference Wordley and Saunders2008). Turbulent intensity has been investigated recently by Cadot et al. (Reference Cadot, Almarzooqi, Legeai, Parezanović and Pastur2020) and Burton et al. (Reference Burton, Wang, Smith, Scott, Crouch and Thompson2021) for an Ahmed body subjected to the  $y$-instability. It is found that the turbulent intensity magnitude does not affect the steady instability strength, and increases the switching rate of the mirror states in the bi-stable dynamics for values larger than 5 %.
Many experiments with either passive or active, open- and closed-loop control noted that cases with a symmetrized wake were often associated with the lowest drag (Grandemange, Gohlke & Cadot Reference Grandemange, Gohlke and Cadot2014; Brackston et al. Reference Brackston, García De La Cruz, Wynn, Rigas and Morrison2016; Evrard et al. Reference Evrard, Cadot, Herbert, Ricot, Vigneron and Délery2016; Li et al. Reference Li, Barros, Borée, Cadot, Noack and Cordier2016; García de la Cruz, Oxlade & Morrison Reference García de la Cruz, Oxlade and Morrison2017; Li et al. Reference Li, Borée, Noack, Cordier and Harambat2019; Lorite-Dıez et al. Reference Lorite-Dıez, Jiménez-González, Pastur, Cadot and Martınez-Bazán2020a; Urquhart et al. Reference Urquhart, Varney, Sebben and Passmore2020, Reference Urquhart, Varney, Sebben and Passmore2021; Haffner et al. Reference Haffner, Castelain, Borée and Spohn2021). However, although Hsu et al. (Reference Hsu, Pastur, Cadot and Parezanović2021) suppressed the wake asymmetry totally using a base suction technique, they found a significant drag increase. This was a consequence of the drastic reduction of the recirculation length with base suction. Actually, the drag varies inversely with this length, as shown by Lorite-Díez et al. (Reference Lorite-Díez, Jiménez-González, Pastur, Cadot and Martínez-Bazán2020b) using a base blowing technique, which is a feature common to two-dimensional bluff bodies (Bearman Reference Bearman1967) with the condition that the separation on the afterbody remains unaffected. Low drag configurations thus require a long and symmetric recirculating region that is likely achieved using a rear cavity, as shown by Evrard et al. (Reference Evrard, Cadot, Herbert, Ricot, Vigneron and Délery2016) and Lucas et al. (Reference Lucas, Cadot, Herbert, Parpais and Délery2017).
Grandemange et al. (Reference Grandemange, Gohlke and Cadot2014) and Haffner et al. (Reference Haffner, Borée, Spohn and Castelain2020) estimated the drag contribution of the steady instability at between  $4\,\%$ and
  $9\,\%$ of the total pressure drag. Grandemange et al. (Reference Grandemange, Gohlke and Cadot2014) interpreted this contribution as an induced drag effect related to the additional cross-flow body force introduced by the steady instability, and Haffner et al. (Reference Haffner, Borée, Spohn and Castelain2020) proposed a physical mechanism linking the wake asymmetry to the base suction. The numerical simulation of Podvin et al. (Reference Podvin, Pellerin, Fraigneau, Evrard and Cadot2020) confirmed that during the dynamics, increases in the base suction were found to correspond to an increase of the wake asymmetry, along with a shrinkage of the recirculation zone associated with wake pumping.
Large effects of the steady wake instability on the lateral force, i.e. lift or side force coefficient, have been reported during bi-stable dynamics. The wake subjected to the  $y$-instability produces an increase of 0.02 on the side force coefficient (Perry et al. Reference Perry, Pavia and Passmore2016; Bonnavion & Cadot Reference Bonnavion and Cadot2018; Fan et al. Reference Fan, Xia, Chu, Yang and Cadot2020), and a similar value for the lift coefficient is found for the
  $z$-instability (Bonnavion & Cadot Reference Bonnavion and Cadot2018; Bonnavion et al. Reference Bonnavion, Cadot, Herbert, Parpais, Vigneron and Délery2019).
Most of the fundamental research cited above has focused on the  $y$-instability, and only Grandemange et al. (Reference Grandemange, Gohlke and Cadot2013a), Bonnavion & Cadot (Reference Bonnavion and Cadot2018), Castelain et al. (Reference Castelain, Michard, Szmigiel, Chacaton and Juvé2018) and Schmidt et al. (Reference Schmidt, Woszidlo, Nayeri and Paschereit2018) reported studies about the
  $z$-instability. It has to be acknowledged that real ground vehicles with a square back, such as vans or lorries, are subjected to the
  $z$-instability (Bonnavion et al. Reference Bonnavion, Cadot, Évrard, Herbert, Parpais, Vigneron and Délery2017, Reference Bonnavion, Cadot, Herbert, Parpais, Vigneron and Délery2019). To address fundamentally ground vehicle aerodynamics in variable flow conditions, it is then relevant to study a simplified model subjected to the
  $z$-instability. In that context, Bonnavion & Cadot (Reference Bonnavion and Cadot2018) investigated variation of the flow conditions (clearance, pitch and yaw) for a
  $z$-unstable body. Their result indicated that the probability of each flow state is sensitive to the geometrical environment of the recirculating region, such as the ground proximity, the body supports and the body inclination. However, they considered separately the effects of three flow parameters (yaw, clearance and pitch) in inclination ranges of only a few degrees. The present work extends this study to simultaneous yaw and pitch variations likely to happen in real driving conditions.
The fundamental questions to be addressed are twofold: how does the wake evolve when both pitch and yaw are at play, and what is the corresponding wake effect on the aerodynamic performance of the body? These questions are investigated with specific attention to the steady instability in order to assess its impact over a real driving envelope. To the authors’ knowledge, there are no results in the literature for systematic and simultaneous variations of pitch, yaw and ground clearance. The experiment first explores the sensitivity of the wake properties measured through the base pressure gradient (Grandemange et al. Reference Grandemange, Gohlke and Cadot2013b) to the body attitude, and second evaluates the wake contribution to the aerodynamic force (drag, lift and side force components). The paper does not investigate specifically the 3-D separations along the longitudinal edges (McArthur et al. Reference McArthur, Burton, Thompson and Sheridan2018) that would require additional measurements. However, their effects are integrated naturally in the measured base suction and the force coefficients.
The paper is organized as follows. The experimental set-up and measurement techniques are described in § 2. In particular, § 2.4 gives the detail concerning the method of the parametric space studies. Results and discussions in § 3 are divided into seven parts. The first part, in § 3.1, focuses on the mean pressure distribution around the body for different attitudes of clearance, yaw and pitch. Then the leeward separation and the wake transitions in two parametric spaces of attitude configurations are investigated in §§ 3.2 and 3.3, respectively. The transitions leading to a fluctuation crisis of the wake are characterized further in § 3.4. The variations of the aerodynamic force components and the link with the wake transitions are studied in § 3.5. Experiments are repeated with a rear cavity in § 3.6, and the wake contribution to the aerodynamics is eventually assessed in § 3.7. Section 4 concludes and offers perspectives on future research.
2. Experimental set-up
2.1. Model geometry and wind tunnel
The geometry considered in this work is a square-back Ahmed model (see figures 1a,b) with dimensions  $L=560$ mm,
  $W=180$ mm and
  $H=200$ mm. The body is supported by four cylinders of
  $15$ mm diameter, leaving a clearance that can be adjustable from 2 mm to 35 mm. The radius of the rounding of the forebody is 70 mm. The rectangular base in figure 1(c) is taller than wide, with aspect ratio
  $H/W=1.11$. Two interchangeable afterbodies are used with exactly the same external dimensions – a flat-back version and a rear cavity. The cavity is produced by pushing the rectangular base inwards the body, to create a depth
  $d=70\ {\rm mm}=0.35H$, with four sides of thickness
  $e=5$ mm. The depth has been chosen to suppress the steady instability, as recommended in Evrard et al. (Reference Evrard, Cadot, Herbert, Ricot, Vigneron and Délery2016) and Lucas et al. (Reference Lucas, Cadot, Herbert, Parpais and Délery2017).

Figure 1. The experimental apparatus and the square-back Ahmed model with the optional rear cavity of depth  $d$ represented by the red dashed line: (a) side view, (b) top view, and (c) rear view. The blue and red points mark the pressure taps, where four (
 $T,U,R,L$) in (a,b) are used to compute the rear sides pressure gradient
  $\boldsymbol {j}$, and four (
 $A,B,C,D$) in (c) are used for calculating the base pressure gradient
  $\boldsymbol {g}$.
The model is placed on two Standa 8MVT100-25-1 motorized elevators, to control independently the clearances of the front and rear axles with precision 1  $\mathrm {\mu }$m. Thanks to this system of two degrees of freedom, the clearance
  $C$ measured at mid-distance between front and rear axles, and the pitch angle
  $\alpha$, can be set independently (see figure 1a). This assembly is mounted on a turntable driven by a motorized rotation stage (Standa 8MR190-90-59) to control the yaw angle
  $\beta$ with precision
  $0.02^\circ$. The value
  $\beta =0^\circ$ corresponds to a zero side force in the baseline configuration (
 $C=20$ mm and
  $\alpha =0^\circ$).
The local coordinate system ( $\boldsymbol {e}_x,\boldsymbol {e}_y,\boldsymbol {e}_z$) shown in figures 1(a,b) rotates with the turntable: the
  $z$-direction is normal to the ground, the
  $y$-direction is normal to the lateral sides of the body, and the
  $x$-direction completes the direct trihedral; the origin is set at the centre of the body base. It is worth mentioning that the
  $x$-direction corresponds to that of the body velocity in the equivalent road testing with crosswind. Nose-up attitude (figure 1a) corresponds to positive pitch angles. We define the ground clearance at the base lower edge as
  $C_r$, as shown in figure 1(a).
Experiments are carried out in a blowing wind tunnel having test section  $1.2$ m wide by
  $0.6$ m high and
  $2.4$ m long. The free stream turbulent intensity is
  $1\,\%$, and the blockage ratio is
  $4.9\,\%$. When the body is not in the test section, the ground boundary layer thickness based on
  $99\,\%$ of the free stream velocity is
  $\delta _{0.99}=9$ mm at the location of the front of the body. Reference pressure and dynamic pressure
  $q_\infty$ in the test section are measured with a Furness Control FCO560 precision manometer. In the following, the dynamic pressure of the uniform flow is set to
  $q_\infty =150$ Pa, corresponding to wind speed
  $U_\infty =16$ m s
 $^{-1}$ and Reynolds number
  $Re=U_\infty H/\nu \approx 2.1\times 10^5$.
The height of the body  $H$ and the free stream velocity
  $U_\infty$ are chosen as length and velocity scaling units, respectively. For the remainder of this paper, any quantity such as
  $a^*$ with an asterisk represents those non-dimensional units. For example, the non-dimensional time is defined as
  $t^*=(tU_\infty )/H$, and the non-dimensional ground clearance is
  $C^*=C/H$.
2.2. Force measurements
The six-component force balance (F/T Sensor: Gamma IP65, manufactured by ATI Industrial Automation) is supporting the two elevators and rotates with the rotary stage as shown in figure 1(a). It measures the three components  $f_x,f_y,f_z$ in the coordinate system (
 $\boldsymbol {e}_x,\boldsymbol {e}_y,\boldsymbol {e}_z$) of figure 1. Time series of the components are acquired at sample frequency 1 kHz. The model frontal area
  $S=H\times W$ is used to calculate the force coefficients
 \begin{equation} c_i=\frac{f_i}{q_\infty S} \quad (i=x,y,z). \end{equation}
The force balance resolution is 0.025 N for  $f_x,f_y$, and 0.05 N for
  $f_z$, which translates to
  $5\times 10^{-3}$ for
  $c_x,c_y$, and
  $10\times 10^{-3}$ for
  $c_z$. The force coefficient
  $c_x$ is related directly to the mechanical power necessary to maintain the velocity
  $V$ of the body (
 $V=U_\infty \cos {\beta }\approx U_\infty$) in the equivalent road condition with crosswind
  $U_{wind}=U_\infty \sin {\beta }$. The lowest eigenfrequency of the full mechanical system made of the elevators and the model fixed on the force balance is 9 Hz, corresponding to
  $f_0^*=0.11$ in non-dimensional units. No attempts have been made to extract aerodynamic force fluctuation with such a low frequency response of the force balance, and only mean force will be shown. The unsteady aerodynamics will be assessed with pressure measurements that are appropriate.
2.3. Pressure measurements
The pressure is measured at 61 locations, as shown in figure 1. There are 20 pressure taps equally spaced at the base with distances  $\delta y=53.3$ mm and
  $\delta z=45$ mm (figure 1c). There are 41 pressure taps on the four sides and the forebody in the vertical and horizontal middle planes of the geometry. The pressure is measured with a Scanivalve ZOC33/64PX pressure scanner placed inside the body. Tubes connecting taps and scanner never exceed 50 cm, leading to a natural low pass filtering having cut-off frequency approximately 50 Hz. The pressure data are low pass filtered with a moving window of duration 50 ms equivalent to
  $t_w^*=3.95$, corresponding to cut-off frequency
  $f_c=20$ Hz, i.e.
  $f_c^*= 0.25$. The sampling frequency is 1 kHz per channel. The static pressure
  $p_\infty$ of the test section is used to compute the instantaneous pressure coefficient:
 \begin{equation} c_p=\frac{p-p_\infty}{q_\infty}. \end{equation}
The base suction coefficient  $c_b$ is computed from the spatial average of the
  $N=20$ pressure taps at the base:
 \begin{equation} c_b={-}\frac{1}{N}\sum_{i=1}^{N}c_{pi}. \end{equation}
The base suction coefficient is always positive and follows trends similar to those for the force coefficient  $c_x$ of the model (Roshko Reference Roshko1993).
The pressure scanner accuracy is reported to  $\pm 3.75$ Pa by the manufacturer as 0.15 % of the full scale 2.5 kPa. To improve this value, the pressure scanner is calibrated before each measurement in the range
  $\pm 200$ Pa. The calibration is made using a calibrator and precision manometer (Furness Control FCO650) having accuracy
  $0.1\,\%$ of the reading pressure when larger than 1 Pa. The pressure scanner accuracy is estimated from the measurement of 40 Pa delivered by the calibrator, which is the typical value of the base suction in this present study. All the 64 mean pressures, computed over 10 s with sampling frequency 1 kHz, fall within the range
  $40\pm 0.5$ Pa. We thus estimate this accuracy in term of pressure or base suction coefficients to
  $\pm 0.005$.
The pressure gradient has been shown in previous research (Grandemange et al. Reference Grandemange, Gohlke and Cadot2013b; Bonnavion & Cadot Reference Bonnavion and Cadot2018) to be an appropriate indicator for the wake asymmetry. Following the same method as Bonnavion & Cadot (Reference Bonnavion and Cadot2018), the four pressure taps ( $A,B,C,D$) indicated in red in figure 1(c) are used to compute the base pressure gradient components:
 \begin{equation} \left.\begin{array}{c} g_y=\dfrac{(c_p(B)+c_p(D))-(c_p(A)+c_p(C))}{2\delta y^*},\\[6pt] g_z=\dfrac{(c_p(A)+c_p(B))-(c_p(C)+c_p(D))}{4\delta z^*}. \end{array}\right\} \end{equation}
In order to assess the rear cavity effect on the wake asymmetry, we use the four pressure taps ( $T,U,L,R$) indicated in red in figures 1(a,b) to compute the rear sides pressure gradient components:
 \begin{equation} \left.\begin{array}{c} j_y=\dfrac{c_p(R)-c_p(L)}{W^*},\\[6pt] j_z=c_p(T)-c_p(U). \end{array}\right\} \end{equation}
The advantage of using  $\boldsymbol {j}$ instead of
  $\boldsymbol {g}$ is that the gradient is measured at exactly the same location whether a rear cavity is present or not, thus making the comparison straightforward. In addition, the rear sides are capturing the wake effect that affects the lateral force whose components are the lift and the side force.
All gradient components are low pass filtered with moving window  $t_w^*=3.95$, implying that the dynamics is resolved at low frequencies such that
  $f^*< 0.25$.
2.4. Parametric studies
We investigate the flow properties for different attitudes defined by a given clearance, yaw and pitch. The attitudes are explored in two different two-dimensional parametric spaces. Variations of clearance and yaw correspond to the parametric space  $(\beta, C^*, \alpha _0)$, and variations of pitch and yaw correspond to the space
  $(\beta, C_0^*, \alpha )$, where the fixed values are
  $\alpha _0=0^\circ$, and
  $C_0^*=0.1$ and 0.125. The values of
  $C_0^*$ belong to the range of typical ground clearances of passenger cars. Two values are tested to assess the role of the pitch at a given mid-axles clearance.
Parametric spaces are explored with resolution  $\delta \beta = 0.5^\circ$,
  $\delta C^* = 2.5\times 10^{-3}$ and
  $\delta \alpha = 0.1^\circ$ within the ranges
  $\beta \in [-15.5^\circ,2^\circ ]$,
  $C^*\in [0.01,0.17]$ and
  $\alpha \in [-2.3^\circ,2.3^\circ ]$ (resp.
  $\alpha \in [-3.3^\circ,3.3^\circ ]$) when the clearance is fixed to
  $C_0^*=0.1$ (resp.
  $C_0^*=0.125$). In total, 2340 attitudes are investigated in the parametric space
  $(\beta, C^*, \alpha _0=0^\circ )$, 1692 in
 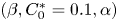 $(\beta, C_0^*=0.1, \alpha )$, and 2412 in
  $(\beta, C_0^*=0.125, \alpha )$.
For each attitude, measurements of force and pressure are performed during a 10 s acquisition. This duration has been chosen as a compromise of the shortest duration to obtain satisfactorily converged averages. The convergences of the mean force components and base suction coefficients denoted  $C_i$ (
 $i=x,y,z,b$) are shown in figure 2 for the body at the reference attitude (
 $C_{ref}^*=0.1,\alpha _{ref}=0^\circ,\beta _{ref}=-4^\circ$). Full convergences denoted
  $\bar C_i = C_i(T=60\ \textrm {s})$ are assumed to be obtained after 60 s, where
 \begin{equation} C_i(T)=\frac{1}{T}\int_0^T c_i(t) \, {\rm d} t. \end{equation}
Figure 2. Convergence of the average coefficients of the force components and base suction at the reference attitude.
Figure 2 attests that all values are converged with an accuracy better than 0.5 %. The lift coefficient is observed to have a slower convergence due to its lower resolution (see § 2.3). The completion of all the configurations in a parametric space takes several hours. However, we limit the number of configurations in a run to never exceed a total duration 3.5 hours, which means that all the sensitivity maps presented in the paper are made from two runs. During each run, the temperature increases from 22  $^\circ$C to 24
  $^\circ$C, and no correction has been applied. Such a long duration raises the issue of signal drifting since both the force balance and the pressure scanner are based on strain gauges technology. The solution is to update regularly the reference of all signals. The update time is estimated from the force balance that suffers from the most significant drift. It is obtained when the amplitude of the drift becomes larger than the high-frequency noise amplitude. This characteristic drift time is 200 s for the force balance. The reference of all signals is obtained from an acquisition of 20 s at the reference attitude chosen for its weak unsteadiness (say
  $C_{ref}^*=0.1$,
  $\alpha _{ref}=0^\circ$,
  $\beta _{ref}=-4^\circ$).
Practically, when the wind tunnel flow stabilizes after the start, the model is set to the ( $C_{ref},\alpha _{ref},\beta _{ref})$ reference attitude to take the temporal means of all signals:
  $\boldsymbol {S_{ref}}$. Then
  $\boldsymbol {S_{ref}}$ is subtracted from the measurements of the 20 subsequent attitudes, each having a 10 s acquisition time. An update of the reference
  $\boldsymbol {S_{ref}}$ is then made by resetting the model to the reference attitude. At the end of the parametric exploration, we obtain the total variation of the acquired data from the reference attitude, say
  $\boldsymbol {s}(t)-\boldsymbol {S_{ref}}$. However, the error made on the force balance measurements is due not only to drift, but also to modifications in the mass distribution (affecting the gravity loading) and to cable deformations by changing the body attitude. In order to remove these non-aerodynamic forces, the parametric exploration is repeated identically as described above but with the wind tunnel switched off (
 $U_\infty =0$). For the
  $(\beta, C^*, \alpha _0)$ plane exploration, the extreme corrections in absolute value are respectively
  $9\times 10^{-3}$,
  $5\times 10^{-3}$ and
  $25\times 10^{-3}$ for drag, side force and lift coefficients. For the
  $(\beta, C_0^*, \alpha )$ plane exploration, the extreme corrections in absolute value are respectively
  $6\times 10^{-3}$,
  $4\times 10^{-3}$ and
  $10\times 10^{-3}$ for drag, side force and lift coefficients. The main contribution to these corrections is due to the vertical axis of the force balance that is not perfectly aligned with the gravity vector. The data are then subtracted from those obtained with the wind. Eventually, the aerodynamic data for the reference attitude
  $S_{ref}$ are obtained from a separate experiment where the wind data are subtracted from the no-wind data.
3. Results and discussions
As a reminder,  $H$ and
  $U_\infty$ are chosen as length and velocity scaling units, respectively, and any quantity
  $a^*$ with an asterisk represents those non-dimensional units. We also use the following notation rule: a variable is denoted with a lowercase letter (e.g.
  $a(t)$), and temporal average is denoted with a uppercase letter, such that the mean is
  $A=\bar {a}$ and its fluctuation is
  $A'=\sqrt {\overline {(a-\bar {a})^2}}$.
In § 3.1, we first give an overview of the mean pressure distribution around the body for different attitudes of clearance, yaw and pitch. These illustrations are meant to show the main effect induced by a change of attitude and will be helpful to support the parametric maps involving simultaneous variation of yaw and clearance or pitch shown in the following subsections. The pressure distributions are used in § 3.2 to identify the attitudes having massive leeward separation. Wake transitions are then evidenced in § 3.3, leading to distinctive regions in the parametric spaces. The most unsteady transitions are characterized in § 3.4. The effects of the wake transitions on the force coefficient components are studied in § 3.5. The rear cavity case is examined in § 3.6, and the aerodynamic contribution of the steady instability is assessed in § 3.7.
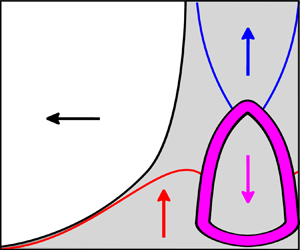
3.1. Pressure distribution
Figures 3–6 show the mean pressure distribution (red arrows and red dashed lines) at the two sections around the body. The grey dashed line in all these figures corresponds to the baseline attitude where  $\beta =\alpha =0^\circ$ and
  $C^*=0.1$.

Figure 3. Mean ( $C_p$) and fluctuating (
 $C_p'$) pressure coefficient distributions around the horizontal (top row) and vertical (bottom row) central sections of the body. The local pressure
  $C_p$ is represented by red arrows, negative when pointed outwards from the body surface;
  $C_p'$ is shown as the magenta continuous line. The grey dashed line is the
  $C_p$ distribution at the baseline attitude
  $\beta =\alpha =0^\circ$ and
  $C^*=0.1$. The three cases (a–c) depict variations with different ground clearances and body aligned with the incoming flow (
 $\beta =\alpha =0^\circ$).

Figure 4. Details as for figure 3 except that the three cases (a–c) depict variations with different yaws and no pitch,  $\alpha =0^\circ$, and
  $C^*=0.1$.

Figure 5. Details as for figure 3 except that the three cases (a–c) depict variations with different yaws with no pitch  $\alpha =0^\circ$ and
  $C^*=0.01$.

Figure 6. Details as for figure 3 except that the two cases (a,b) depict variations with different pitches with no yaw,  $\beta =0^\circ$, and
  $C^*=0.1$.
When the ground clearance  $C^*$ is increased in figure 3, with the body aligned with the incoming flow (
 $\beta =\alpha =0^\circ$), only small changes are observed in the horizontal section (top row). The slight observable increase of the negative pressure on both sides of the forebody indicates a global velocity decrease when the clearance is increased. This is the consequence of the emergence of a flow in the clearance, as shown by the large variation of the pressure distribution in the vertical section (bottom row). In figure 3(a, bottom), the lower part of the nose is at
  $C_p\approx 1$, indicating a high pressure separated region at the front of the body. It is a situation similar to that of the upstream separation of a wall-mounted obstacle (Dargahi Reference Dargahi1989). When the body is raised from the ground, the front separation is removed, leading to the emergent underbody flow in figure 3(b, bottom). From measurements of Cadot et al. (Reference Cadot, Evrard and Pastur2015), the underbody flow velocity reaches a value close to
  $0.75U_\infty$ for
  $C^*=0.04$ at
  $Re=1.5 \times 10^5$. The fluctuating pressure displayed with the magenta line is noticeably important at the forebody wherever the magnitude of the mean pressure is large. For these locations, the value
  $C_p'/C_p\approx 2\,\%$ is consistent with the wind tunnel free stream turbulent intensity
  $1\,\%$ estimated using the Bernoulli relationship. It seems that there is no noticeable front separation that can be detected. However, the presence of a separation could be missed by the poor spatial resolution of the current pressure measurements, as front separation is often reported for an Ahmed body (Grandemange et al. Reference Grandemange, Gohlke and Cadot2013b; Fan et al. Reference Fan, Xia, Chu, Yang and Cadot2020). At the rear, the pressure fluctuation is higher due to the massive separation and can reach
  $10\,\%$ of the mean pressure level, as can be seen in figure 3(c).
Yawing the body for a given clearance  $C^*=0.1$ essentially leads to an asymmetry of the pressure distribution in the horizontal section as shown in figure 4 (top row), thus producing the side force. The pressure at the base is also remarkably decreased as the yaw is made continuously larger, indicating a substantial drag increase. At large yaw, the leeward side shows a significant increase in the pressure fluctuations in figure 4(c, top), likely to be provoked by a forebody separation. The separation on the leeward side is observable for smaller yaw when the clearance is small, as can be seen in figure 5(b, top) for
  $\beta =-7.5^\circ$ and the smallest achievable clearance
  $C^*=0.01$.
The pitch variations increase the asymmetry in the vertical cross-section, as shown in figure 6 (bottom row), which affects directly the lift component. Compared to the equivalent yaw in figure 4(a, top), the proximity of the ground clearly amplifies this asymmetry especially at the nose according to a blockage effect. No noticeable separation compared to the aligned case can be distinguished at the forebody in figure 6 (bottom row) as the pressure fluctuations level remains small. This is due to the small range of pitch investigated.
3.2. Leeward separation
The leeward separation on the lateral sides as evidenced in the top rows of figures 4(c) and 5(b,c) are detected for all attitudes using the sum  $C_{pl}'=C_{pl_1}'+C_{pl_2}'$ of the pressure fluctuations at the two locations denoted
  $l_1$ and
  $l_2$ in figure 5(c). This criterion indicates the presence of a laminar to turbulent transition of the separated shear, and would be insensitive in the case of a laminar reattachment. For variations of clearance and yaw in figure 7(a), large values of
  $C'_{pl}$ indicate two distinctive regions of body separation in the parametric space: the first region is observed at low clearance
  $C^* < 0.02$ and large yaw
  $\beta <-7.5^\circ$, corresponding to cases depicted in figures 5(b,c); and the second region is observed at larger clearance
  $C^* > 0.02$ and
  $\beta <-9^\circ$, corresponding to the case in figure 4(c). For variations of pitch and yaw in figure 7(b), a single region of leeward separation is seen for
  $\beta <-9^\circ$, as depicted in figure 4(c). The regions of the parameter space for which the leeward side experiences flow separation are delimited by the dashed lines in figure 7. These lines will be superimposed when appropriate onto other results in the following subsections.

Figure 7. Regions of separation on the lateral leeward side for the variations of (a) clearance and yaw  $C_{pl}'(\beta, C^*,\alpha =0^\circ )$, and (b) pitch and yaw
  $C_{pl}'(\beta,\alpha, C_0^*=0.1)$.
3.3. Wake transitions
We turn now to the base pressure gradient components as indicators of the wake asymmetry (Grandemange et al. Reference Grandemange, Gohlke and Cadot2013b). The mean ( $G_y$ and
  $G_z$) and fluctuating (
 $G_y'$ and
  $G_z'$) components are respectively shown in figures 8 and 9 for both the clearance (panels a,b) and pitch (panels c,d) versus yaw mappings. Very clear changes of gradient orientation are observable in figure 8, as well as a large localized crisis of fluctuations in figure 9. It is striking that the gradients fluctuation is orientated exclusively in the vertical direction; i.e.
  $G_z'$ in figures 9(b,d) displays the largest fluctuation. This is a strong indication that the wake remains dominated by the
  $z$-instability even with yaw and pitch.

Figure 8. Components of the mean base pressure gradient  $G_y$ (a,c) and
  $G_z$ (b,d) for the clearance versus yaw mapping
  $G_i(\beta, C^*,\alpha =0^\circ )$ in (a,b), and the pitch versus yaw mapping
 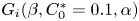 $G_i(\beta,C_0^*=0.1,\alpha )$ in (c,d). Red (resp. black) dashed lines display noticeable transitions in
  $G_y$ (resp.
  $G_z$).

Figure 9. Components of the fluctuating base pressure gradient  $G_y'$ (a,c) and
  $G_z'$ (b,d) for the clearance versus yaw mapping
  $G_i'(\beta, C^*,\alpha =0^\circ )$ in (a,b), and the pitch versus yaw mapping
 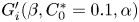 $G_i'(\beta,C_0^*=0.1,\alpha )$ in (c,d). Dashed lines for
  $G_z'$ in (b,d) are the same as for
  $G_z$ in figures 8(b,d).
We attempted to display these changes by superimposing arbitrarily on the observable transitions the dashed lines on each plot of figure 8, where the red (resp. black) dashed lines are for transitions observed for  $G_y$ (resp.
  $G_z$). All transition lines are then reported in the recap figures 10(a,b) that divide the maps into five main regions, labelled I to V. Each region is illustrated in these figures by base pressure distributions for a few configurations of the parametric study displayed as filled black circles. Both regions I in figures 10(a,b) are obtained from figures 9(b,d) where large fluctuations are observed. These large fluctuations are due to unsteady dynamics between wake states of opposite vertical gradient components (as shown by
  $G_y\approx 0$ in figures 8a,c). The most probable gradient's sign depends on the clearance: it is negative for
  $C^*<0.15$ in figure 8(b), and positive for
  $C^*>0.15$. Pitch-up configurations (
 $\alpha >0^\circ$) definitely lock the gradient on a negative value, as can be seen in figure 8(d).

Figure 10. Recap of transitions for (a) clearance and (b) pitch, versus yaw mappings deduced from figures 8 and 9. All lines are transitions in  $G_y$ and
  $G_z$ reported from figure 8, where red (resp. black) lines are transitions for
  $G_y$ (resp.
  $G_z$). Thick lines depict transitions associated with large base pressure gradient fluctuations. The colour maps show the representative base pressure distribution in different regions, with an autoscale colour bar: red (resp. blue) indicates high (low) pressure. The three blue paths in (b) denote the unsteady transitions investigated in § 3.4.
In the regions II displayed in figures 10(a,b), the vertical component of the gradient is positive. This region can be split into three subregions, denoted A, B and C, obtained by combining observations from the mean gradients maps in figure 8: II-A where the gradient is almost vertical, II-B where the gradient is orientated at  $45^\circ$, and II-C where the vertical component decreases gradually towards zero when entering region III. There is a striking similitude in II subregions between those of the clearance (figure 10a) and the pitch (figure 10b) versus yaw mappings. It points out the important role of the gap between the ground and the lower edge of the base for the base pressure gradient orientation. This gap distance
  $C_r^*$ as defined in figure 1 is now used to show the transition lines in a
  $(C_r^*,\beta )$ plane (figure 11a) instead of the
  $(\alpha,\beta )$ representation of figure 10(b). When comparing figure 11(a) to figure 10(a) (where
  $C^*=C_r^*$ as the pitch is zero for these configurations), we find good agreement in the locations of the II subregions with the values of
  $C_r^*$. Figure 11(b) recaps transitions in the pitch versus yaw map made at a higher clearance,
  $C^*=0.125$, than the
  $C^*=0.1$ of figure 10(b). For this larger clearance, larger pitch angles (
 $\alpha >1^\circ$) are necessary to transition in the region II corresponding to the rear gap of
  $C_r^*\approx 0.1$. As it is slightly larger than the
  $C_r^*\approx 0.09$ observed in figure 10(a), the region II location is also, but at a lower order than the rear clearance, sensitive to the pitch inclination.

Figure 11. Recap of all transitions for the pitch versus yaw maps represented in the  $(C_r^*,\beta )$ plane with (a)
  $C_0^*=0.1$ reported from figure 10(b), and (b)
  $C_0^*=0.125$. The pitch
  $\alpha$ equivalent to
  $C_r^*$ is displayed as a second axis on the right-hand side of each plot. Same legend for lines as in figure 10.
Region III gathers configurations with quasi-horizontal gradient, as shown by  $G_z\approx 0$ in figures 8(b,d), with values weakly dependent on the yaw (see figures 8a,c).
Regions IV in figure 10(a) are configurations in absence of flow in the gap  $C_r^*$ and correspond to situations depicted in figures 3(a) and 5(a). The base pressure gradient in region IV is almost vertical everywhere and negative (see figures 8a,b) because the lower edge of the base is a high-pressure stagnation point due to the back flow of the recirculating bubble. The emergence of the flow in the gap
  $C_r^*$ when the body is raised evacuates the stagnation point leading to equivalent separations at both the lower and upper edges of the base, but with a positive base pressure gradient. This transition is detailed in (Grandemange et al. Reference Grandemange, Gohlke and Cadot2013a) for
  $\beta =0^\circ$ only, and generalized by the parametric study to the transition line between regions II-A and IV in figure 10(a). The transition is accompanied with fluctuations of
  $g_z$ (see figure 9b) and occurs at lower clearance for larger yaw when
  $\beta <-6^\circ$ (figure 8b).
Regions V and I would have been antisymmetric in figure 10(b) if the ground and supports were absent. The gradient values in both regions in figures 8(c,d) almost retrieve this symmetry property. However, only region I is associated with large unsteady dynamics, while region V is clearly not, as shown by the lack of fluctuations for negative pitches in figure 9(d). As a result, the positive vertical pressure gradient in region V as depicted in figure 10(b) rotates steadily in region III towards a negative horizontal gradient.
For the sake of simplicity, the wake state subjected to the vertical asymmetry is denoted as  $N_z$ or
  $P_z$ with respectively negative (
 $g_z < 0$ and
  $g_y \approx 0$) or positive (
 $g_z > 0$ and
  $g_y \approx 0$) pressure gradients. Identically, a horizontal asymmetry is denoted as
  $N_y$ or
  $P_y$ with respectively negative (
 $g_y < 0$ and
  $g_z \approx 0$) or positive (
 $g_y > 0$ and
  $g_z \approx 0$) pressure gradients. As reported in figure 10(b), region I corresponds to
  $N_z$ states, regions II-A and V to
  $P_z$ states, and region III to
  $N_y$ states. Next, we study the nature of the fluctuation crisis observed when crossing the thick transition lines enclosing region I in figure 10(b).
3.4. Fluctuation crisis of the wake
From region I in figure 10(b), in which the wake presents  $N_z$ states, we can see three different possible transitions: towards II-A leading to
  $P_z$ states, towards III leading to
  $N_y$ states, and towards V leading also to
  $P_z$ states. To characterize these unsteady transitions, measurements were repeated along the three paths of attitudes
  $p_\textrm {I-IIA}$,
  $p_\textrm {I-III}$ and
  $p_\textrm {I-V}$ as denoted in figure 10(b). They have a better resolution (
 $\delta \beta =0.25^\circ$,
  $\delta \alpha =0.05^\circ$) as well as a longer recording duration (600 s). The evolutions of the probability density functions of the two gradient components
  $g_y$ and
  $g_z$ are shown on the left-hand side of figure 12 along each path. On the right-hand side, time series of the vertical gradient component are shown for the most unsteady attitude of the path, marked with a white dashed line.

Figure 12. Evolution of the base pressure gradients characteristics along the three paths as displayed in figure 10(b): (a)  $p_\textrm {I-IIA}$:
  $\alpha =1.32^\circ$,
  $C^*=0.1$; (b)
  $p_\textrm {I-III}$:
  $\alpha =0.42^\circ$,
  $C^*=0.1$; (c)
  $p_\textrm {I-V}$:
  $\beta =0^\circ$,
  $C^*=0.1$. Left and middle: normalized probability density functions of the gradient components along the path. Right: time series of vertical pressure gradient
  $g_z$ for the configuration marked by the white dashed line in the middle figure.
The wake transitions along  $p_\textrm {I-IIA}$ (figure 12a) and
  $p_\textrm {I-V}$ (figure 12c) correspond to wake reversals. They have been reported by Bonnavion & Cadot (Reference Bonnavion and Cadot2018) with a square-back bluff body subjected to the
  $z$-instability and also with real car geometries (Bonnavion et al. Reference Bonnavion, Cadot, Herbert, Parpais, Vigneron and Délery2019).
The transition along  $p_\textrm {I-III}$ has never been reported so far for a
  $z$-unstable square-back body. However, it is very similar to the transition observed in pitch for a
  $y$-unstable square-back body (Bonnavion & Cadot Reference Bonnavion and Cadot2018) or with additional passive disturbances underneath the bluff body (Barros et al. Reference Barros, Borée, Cadot, Spohn and Noack2017). In both cases, the initial horizontal asymmetry transits to a vertical asymmetry.
3.5. Aerodynamic force coefficients
We turn now to the components of the aerodynamic force coefficients  $c_x, c_y, c_z$ that we will respectively call drag, side force and lift coefficients. We recall that
  $c_x$ is the aerodynamic resistance to the body motion (
 $V=U_\infty \cos {\beta }\approx U_\infty$) in the equivalent road condition with crosswind
  $U_{wind}=U_\infty \sin {\beta }$. The coefficient
  $c_x$ is thus related directly to the fuel consumption of the engine.
The variation of the time-averaged drag coefficient  $C_x$ in the parametric spaces
  $(\beta,C^*)$ and
  $(\beta, \alpha )$ is shown in figures 13(a) and 14(a). This component is split into two contributions, the base drag
  $C_b$ (figures 13b and 14b) and all the other contributions
  $C_x-C_b$ (figures 13c and 14c), taking into account the total force exerted on the main body and the four cylindrical supports, except the base.

Figure 13. Force coefficient components for the clearance versus yaw mapping ( $\beta, C^*, \alpha _0=0^\circ$): (a) total drag coefficient
  $C_x$; (b) base suction
  $C_b$; (c) remainder drag except for the base suction
  $C_x-C_b$; (d) base suction contribution to the total drag
  $C_b/C_x$; (e) side force coefficient
  $C_y$; (f) lift coefficient
  $C_z$. Dashed lines in (a,c) are the leeward separation lines as defined in figure 7(a). All lines in (b,e,f) are reported from figure 10(a), with thick lines for transitions associated with large base pressure gradient fluctuations. Regions are labelled in (e) as defined in figure 10.

Figure 14. Force coefficient components for the pitch versus yaw mapping ( $\beta, C_0^*=0.1, \alpha$): (a) total drag coefficient
  $C_x$; (b) base suction
  $C_b$; (c) remainder drag except for the base suction
  $C_x-C_b$; (d) base suction contribution to the total drag
  $C_b/C_x$; (e) side force coefficient
  $C_y$; (f) lift coefficient
  $C_z$. Dashed lines in (a,c) are the leeward separation lines as defined in figure 7(b). All lines in (b,e,f) are reported from figure 10(b), with thick lines for transitions associated with large base pressure gradient fluctuations. Regions are labelled in (e) as defined in figure 10.
At small clearances  $C^*<0.02$ and large yaws
  $\beta <-7.5^\circ$ in figure 13(c), the increase of contribution
  $C_x-C_b$ is due to the large leeward separation reported in figure 7(a) and depicted in figures 5(b,c). The quasi-linear variation of
  $C_x-C_b$ with clearance for all yaw angles is ascribed to the cylindrical supports, for which the projected area is proportional to
  $C^*$. It is remarkable that the
  $C_x-C_b$ contribution decreases towards negative values at large yaw. This thrust must result from the pressure distribution at the forebody as shown in figures 4(b,c, top) and 5(b,c, top), similarly to a boat sail propulsion. This propulsion is not observed when the pitch is increased, since large pitches are associated with larger drag contribution in figure 14(c). This is because the force balance is not rotating in pitch as it rotates with yaw, i.e. the drag component is always parallel to the ground. To summarize, crosswind has a beneficial effect on the forebody drag contribution, while pitching the body is always detrimental.
We now focus on the base suction contribution to the total drag  ${C_b}/{C_x}$, shown in figures 13(d) and 14(d). The predominant contribution to the total drag of about
  $70\,\%$ for the aligned condition (similar to the value reported by Ahmed et al. Reference Ahmed, Ramm and Faitin1984) is increased drastically at yaw due to the thrust effect discussed above, and can even increase over
  $100\,\%$ for moderate yaws
  $\beta <-7^\circ$, depending on the clearance. For small yaw attitudes
  $|\beta |<3^\circ$, the main parameter affecting the base suction
  $C_b$ is either the ground clearance in figure 13(b) or the pitch angle in figure 14(b). With the increase of the clearance, the base drag
  $C_b$ undergoes a series of changes, which are consistent with the work of Grandemange et al. (Reference Grandemange, Gohlke and Cadot2013a) for a square-back model with aspect ratio
  $H/W=0.74$ at zero yaw. At large clearance (
 $C^*>0.07$) corresponding to typical driving conditions on the road, the base drag is independent of the clearance, and presents a linear variation with yaw for
  $|\beta |>3^\circ$.
Generally speaking, the lateral force component is obviously related to the body attitude defined by the yaw and the pitch. As shown in figures 13(e) and 14(e), the side force coefficient  $C_y$ is proportional mainly to the yaw angle
  $\beta$, independently on the pitch or the clearance. However, we can see in both figures 13(e) and 14(e) that the wake asymmetry orientation has an effect on the side force, which will be discussed below. The lift coefficient is found to increase as a quadratic law with the yaw in figures 13(f) and 14(f). A remarkable correlation with the wake orientation is observable for both parametric studies when comparing the transition lines to the coefficients variation in figures 13(b,e,f) and 14(b,e,f). While base suction
  $C_b$ is a direct measurement in the wake, the lift
  $C_z$ and side force
  $C_y$ coefficients are not, because of the large contribution of the forebody in yaw and pitch as shown in § 3.1. The use of the rear cavity in the next subsection enables us to isolate the direct contribution of the wake to both coefficients
  $C_z$ and
  $C_y$ as a function of the body attitude.
3.6. Rear cavity
We repeated the parametric study for attitudes in yaw and pitch in the space  $(\beta,C_0^*=0.1,\alpha )$ in exactly the same conditions as above but with a rear cavity of depth
  $d^*=0.35$ (as depicted in figure 1). Figure 15 shows the mean and fluctuating components of the base gradient
  $\boldsymbol {g^{cav}}$ measured at the bottom of the rear cavity that should be compared to the flat-back case in figures 8(c,d) and 9(c,d). Except for high positive pitch and large negative yaw in figure 15(b) (corresponding to subregion II-A in figure 10b), the mean gradients are considerably reduced, leading to a uniform base pressure distribution. Transitions between different orientations are still observable but much smoother than those without the cavity, while the unsteady transitions on the region I contour (as defined in figure 10(b) and discussed in § 3.4) have totally disappeared. Instead, a more homogeneous region of low-level fluctuations is observed for both components. The cavity has produced similar effects on the steady instability inhibition, as demonstrated by Evrard et al. (Reference Evrard, Cadot, Herbert, Ricot, Vigneron and Délery2016), where it was attributed to the symmetrization of the recirculation at the base.

Figure 15. Case with the rear cavity: components of the mean  $\boldsymbol {G}(\beta,C_0^*=0.1,\alpha )$ (a,b) and fluctuating
  $\boldsymbol {G'}(\beta,C_0^*=0.1,\alpha )$ (c,d) base pressure gradient for the pitch versus yaw mapping.
Figure 16 shows the pressure gradient  $\boldsymbol {j}$ (see (2.5)) measured from the lateral surfaces of the body (
 $T,U,L,R$ in figure 1), at the closest location to the rear flow separation that is the most influenced by the wake dynamics. We first discuss the flat-back case shown in figures 16(a,c,e,g). Both fluctuating component maps of
  $\boldsymbol {J'}$ in figures 16(c,g) are very similar to those of
  $\boldsymbol {G'}$ in figures 9(c,d). As the main source of fluctuations is due to the wake, we should not expect any differences between
  $\boldsymbol {J'}$ and
  $\boldsymbol {G'}$. However, their mean values
  $\boldsymbol {J}$ and
  $\boldsymbol {G}$ show differences by comparing figures 16(a,e) with figures 8(c,d). They can be explained from the contribution of the flow around the body. The wake transitions identified in figure 10(b) are still recognizable in figures 16(a,e), but the absence of changes of sign in
  $\boldsymbol {J}$ compared to
  $\boldsymbol {G}$ (
 $J_z$ is always positive, and
  $J_y$ keeps the same sign for all negative yaws) is a direct effect of the ground proximity on the flow around the body. Comparing the mean values,
  $\boldsymbol {J}$ without (figures 16a,e) and
  $\boldsymbol {J^{cav}}$ with (figures 16b,f) the rear cavity, we find similar gradient values because the dominant contribution that is the flow around the body is the same for both cases. Nevertheless, the smoother variations in figures 16(b,f) result from the inhibition of the steady instability. On the other hand, it is very striking to observe that the most significant impact of this inhibition is actually displayed by the fluctuation of the gradients in figures 16(d,h). Their distributions in the maps have changed drastically; instead of having exclusively vertical gradient fluctuations on the contour of region I as in figures 16(c,g) for the flat-back case, the rear cavity has spread homogeneously the fluctuations in both directions inside regions I and V. As a consequence, the contribution of the wake to the pressure distribution on the lateral surfaces of the body becomes more unsteady when the steady instability is removed by the presence of the cavity, except for attitudes with fluctuation crisis of the wake. This global wake fluctuation with a rear cavity has never been reported, to the authors’ knowledge. This interesting result deserves further dedicated investigation of the rear cavity effect that falls out of the scope of this paper. In the following, we study the force coefficients to assess globally the wake effect on the body.

Figure 16. Components of the mean  $\boldsymbol {J}(\beta,C_0^*=0.1,\alpha )$ (a,e) and fluctuating
  $\boldsymbol {J'}(\beta,C_0^*=0.1,\alpha )$ (c,g) pressure gradient at the rear of the body lateral surfaces. Case with the rear cavity:
  $\boldsymbol {J^{cav}}(\beta,C_0^*=0.1,\alpha )$ (b,f), and
  $\boldsymbol {{J^{cav}}'}(\beta,C_0^*=0.1,\alpha )$ (d,h). The dashed lines in (a,c,e,g) are all transition lines reported from figure 10(b), with the regions labelled as in (a). Colours are adapted for better contrast.
3.7. Wake contribution to the aerodynamics
Figure 17 shows the difference of force coefficients  ${\rm \Delta} C_i=C_i-C_i^{cav}$ (
 $i=x,y,z, yz$) between the flat-back and the rear cavity body. Since the cavity modifies the flow mainly at the rear of the model, the difference
  ${\rm \Delta} C_i$ evaluates directly the contribution of the wake on the lateral force coefficients
  $C_y$ and
  $C_z$. The striking resemblance of figures 17(a,b) to the mean base pressure gradient in figures 8(c,d) demonstrates clearly the influence of the wake orientation on the pressure loading over the four lateral sides of the body. A negative vertical (resp. horizontal) base pressure gradient produces a positive lift (resp. side force). The extreme contributions of the wake orientation to the lateral force coefficients are
  $\pm 0.02$. Similar values were obtained by Perry et al. (Reference Perry, Pavia and Passmore2016) for the Windsor model, Bonnavion & Cadot (Reference Bonnavion and Cadot2018) for two different aspect ratio Ahmed bodies, and Bonnavion et al. (Reference Bonnavion, Cadot, Herbert, Parpais, Vigneron and Délery2019) for real cars. Figures 17(a,b) also evaluate the contribution of the steady wake instability in various crosswind and pitch conditions wherever
  ${\rm \Delta} C_y$ and
  ${\rm \Delta} C_z$ are large. It is likely that for large yaw and negative pitch, the flat-back model is no longer subjected to the steady wake instability, which means that the wake asymmetry now results simply from the body attitude. However, there is still a small negative side force change that can be attributed to the flow on the interior lateral side of the cavity that does not exist for the flat-back case. For positive pitch, the instability is still dominant even for large yaw. This is due to the presence of the ground and the associated rear clearance
  $C_r^*$, as discussed above.

Figure 17. The aerodynamic force difference between the geometry with cavity and without cavity,  ${\rm \Delta} C_i=C_i-C_i^{\textrm {cav}}$ (
 $i=x,y,z$) for pitch versus yaw mapping (
 $\beta, C_0^*=0.1, \alpha$): (a) side force coefficient difference; (b) lift coefficient difference; (c) drag coefficient difference. (d) Lift coefficients
  $C_z$ and
  $C_z^{cav}$ versus the pitch for attitudes with
  $\beta =0^\circ$ and
  $C^*_0=0.1$. The dashed lines are all transition lines reported from figure 10(b).
Eventually, the drag difference in figure 17(c) is positive in the whole parametric space, indicating that the cavity always reduces drag. As reported by Evrard et al. (Reference Evrard, Cadot, Herbert, Ricot, Vigneron and Délery2016) and Lucas et al. (Reference Lucas, Cadot, Herbert, Parpais and Délery2017) at  $\beta =\alpha =0^\circ$, the drag reduction mechanism with a cavity is twofold: recirculation elongation and steady instability suppression. The steady instability contribution has been suggested by Grandemange et al. (Reference Grandemange, Gohlke and Cadot2014) to be a drag induced by the cross-flow force produced by the symmetry breaking. Lorite-Dıez et al. (Reference Lorite-Dıez, Jiménez-González, Pastur, Cadot and Martınez-Bazán2020a) showed that the drag difference
  ${\rm \Delta} C_x$ between the flat-back and the rear cavity base was decreasing monotonically with yaw for a
  $y$-unstable Ahmed body at zero pitch. We can see in figure 17(c) that the
  $z$-instability produces a new trend due to the transition between the regions I and III, where the drag difference is not monotonic with yaw but reaches a maximum at approximately
  $\beta \approx -4.5^\circ$. There are actually two main regions where the drag difference
  ${\rm \Delta} C_x$ is minimal in figure 17(c): (i) in region III where the flat-back model is no longer subjected to the steady wake instability, as discussed above; and (ii) in the whole of region I. It can be argued for (i) that in the absence of the steady instability, the drag reduction with the cavity is missing the contribution of the stabilizing effect of the wake, and the only elongation mechanism that remains plausibly explains the low value of drag reduction. For (ii), it is likely that the negative vertical pressure gradient
  $N_z$ of the
  $z$-instability present in region I is responsible for the weak cavity effect on drag.
We now attempt to relate the drag changes and the mean cross-flow force produced by the  $z$-instability with its induced drag effect. For all inclinations of the body investigated (
 $|\beta |<15^\circ$), the cross-flow force (perpendicular to the wind axis) and the lateral body force on which the following reasoning is based are quasi-identical. Figure 17(d) shows the difference of the mean lateral force coefficient
  ${\rm \Delta} C_{yz}$ between the flat-back and the rear cavity base, with
  $C_{yz}=\sqrt {C_y^2+C_z^2}$. If we assume that the large (resp. small) drag differences in figure 17(c) are associated with a large (resp. small) induced drag effect of the mean lateral force due to the
  $z$-instability of the flat-back body, then we expect to find a large (resp. small) drag difference in figure 17(c) to correspond to increased (resp. decreased) mean lateral force in figure 17(d). This correspondence is satisfied only for
  $\alpha <1.15^\circ$, where the decreased lateral force in region I in figure 17(d) corresponds to the weak drag difference in figure 17(c), and the increased lateral force in both regions V and III in figure 17(d) correspond to the large drag difference in figure 17(c). The simple idea of induced drag modified by the mean additional lateral force of the wake
  $z$-instability breaks down at
  $\alpha >1.15^\circ$, which corresponds to the sign change of the lift in region I (see figure 14f). Unfortunately, for this part, we could not find alternative interpretation with our available data. It probably shows the difficulties of the induced drag approach for a complex geometry having more than one surface generating a cross-flow force, such as a wing. Actually, local cross-flow forces over a 3-D body producing globally induced drag with a complex system of longitudinal vortices can compensate to give no net cross-flow force. In that case, there is no net cross-flow to relate the existing induced drag to. A good example is the attitude at
  $\beta =0^\circ$,
  $\alpha =1.15^\circ$ that has a zero net lateral force (see figure 17d),which does not correspond to a minimal base drag configuration (see figure 14b). At this attitude, the body inclination that has produced longitudinal vortices at the four sharp longitudinal edges of the body is somehow responsible for substantial additional induced drag.
4. Conclusion
This work explored the sensitivity of the aerodynamics of a flat-back bluff body to its attitude defined by yaw, pitch and ground clearance. The study of the base pressure gradients reveals the presence of sharp transitions, either unsteady or steady, between opposite or right-angle base pressure gradient orientations, leading to the establishment of phase diagrams in the  $(\beta, C^*, \alpha _0)$ and
  $(\beta, C_0^*, \alpha )$ parametric spaces. Figure 18 summarizes the phase diagram in the
  $(\beta, C_0^*, \alpha )$ space. An equivalent diagram can be retrieved from the other parametric study
  $(\beta, C^*>0.04, \alpha _0)$ when plotted with the same rear clearances. The unsteady transitions, comprising the wake bi-stability phenomena, are due to a fluctuation crisis of only the
  $z$-component of the base pressure gradient. Their locations have been identified in the attitude spaces as indicated in figure 18.

Figure 18. The  $z$-instability domain of the wake as a function of the body attitude (defined by yaw
  $\beta$ and pitch
  $\alpha$ or rear clearance
  $C_r^*$) deduced from the rear cavity experiment and transitions in the base pressure gradient. The orientation of the pressure gradient is indicated with arrows.
Experiments are repeated with a rear cavity that inhibits the  $z$-instability in the
  $(\beta, C_0^*, \alpha )$ parametric space. Since the flows with and without the rear cavity differ only by their wake influence, the subtraction of their aerodynamics enables the assessment of the wake steady instability contribution to the force. Thus the domain defined from all attitudes featuring a high lateral force difference is assumed to be produced by the steady instability. The obtained domain is displayed in figure 18. While the unstable domain is restricted to small yaw angles
  $|\beta |<4^\circ$ for pitch-down attitudes or large rear clearances, it extends to yaw angles up to
  $|\beta | \approx 15^\circ$ for rear clearances
  $C_r^* \approx 0.04$. The unstable domain comprises three main regions of a vertically locked base pressure gradient, illustrated in figure 18. These locked states are surely maintained by a top/down asymmetry of the flow at the base, introduced by any combination of the pitch angle, ground effect and body supports. The questions of why the wake orientates as it does, and why fluctuations crisis occurs only for pitch-up attitudes, require velocity field measurements around the base.
The rear cavity is always found to reduce the drag. Its magnitude is correlated to the regions in figure 18. In particular, the lower effectiveness of the cavity in the region of the negative base pressure gradient indicates that such gradient orientation is favourable for low drag. However, the idea that the  $z$-unstable wake reduces the mean net lateral force on the body, thereby reducing the associated induced drag, fails for all attitudes with large pitch-up values or small rear clearances.
The work focused on the base pressure distribution as a simplified way to investigate thoroughly the sensitivity of the wake to different attitudes. It is clear that the increasing complexity of 3-D separations along the body edges with non-aligned attitudes requires more information, and the nature of their interaction with the steady instability of the wake is an open question.
Finally, the  $z$-instability affects substantially the lateral force and drag for attitudes in the ranges
  $\pm 5^\circ$ in yaw and
  $\pm 1^\circ$ in pitch. This fundamental work on a unique geometry then suggests that real cars subjected to the steady instability have increased aerodynamic sensitivity to attitudes within this range. This sensitivity should have clear implications for drag optimization of vehicles when crosswinds are taken into account, but also in the case of mass loading variations modifying the car pitch. In addition, it is especially in the yaw range
  $\pm 5^\circ$ that Howell (Reference Howell2015) recommends car builders to focus for significant fuel consumption reduction in real driving conditions.
Acknowledgements
The authors would like to acknowledge the invaluable contributions of both the mechanical and electrical workshops of the University of Liverpool to set up the experiment.
Funding
This work has been supported by the Khalifa University of Science and Technology under Award no. CIRA-2019-025. Y.F. wishes to thank the China Scholarship Council (CSC no. 202006260028) for the doctoral financial support.
Declaration of interest
The authors report no conflict of interest.


 Open access