


1. Introduction
The stall of wings and blades when the angle of attack exceeds the stall angle is a viscous flow phenomenon which limits the maximum lift force that can be achieved. This is highly undesirable for fixed wings, rotorcraft and wind turbines regardless of the size and Reynolds number range in which they operate. Typically, flow separation and stall start suddenly near the leading edge for low Reynolds numbers based on the chord length  $(R{e_c} < {10^6})$ (Mueller & DeLaurier Reference Mueller and DeLaurier2003). Fully separated flows for thin aerofoil sections may also occur during high-angle-of-aircraft flight at high Reynolds numbers (Rom Reference Rom1992). In the post-stall regime, the separated shear layer from the leading-edge region contains small-scale shear layer instabilities and rolls up into large-scale wake vortices further downstream. Hence, the leading-edge region becomes a natural choice to introduce excitation for active flow control applications. In this article, we report self-excited oscillations of flags attached to the leading edge (see figure 1), resulting in the enhancement of lift force.

Figure 1. (a) Schematic of an oscillating flag attached to the leading edge of an aerofoil; (b) the main parameters of the flag.
1.1. Post-stall flow control
As flow separation and separated shear layer originate from the leading-edge region, most active flow control methods are applied near this region. These include steady (continuous) blowing or suction (Lachmann Reference Lachmann1961; Schlichting Reference Schlichting1979; Chen, Seele & Wygnanski Reference Chen, Seele and Wygnanski2013; Wang & Gursul Reference Wang and Gursul2017), periodic blowing and suction (Seifert et al. Reference Seifert, Bachar, Koss, Shepshelovich and Wygnanski1993; Seifert, Darabi & Wygnanski Reference Seifert, Darabi and Wygnanski1996; Wu et al. Reference Wu, Lu, Denny, Fan and Wu1998; Greenblatt & Wygnanski Reference Greenblatt and Wygnanski2000), plasma actuators (Corke, Enloe & Wilkinson Reference Corke, Enloe and Wilkinson2010) and mechanically oscillated flaps (Miranda et al. Reference Miranda, Vlachos, Telionis and Zeiger2005). Increased time-averaged lift force at post-stall angles of attack and delay of the stall angle have been observed in these studies. In addition to the above methods, in which the excitation is introduced locally, there are other studies that use globally introduced periodic excitation such as acoustic forcing in the test section of the wind tunnel (Zaman Reference Zaman1992) and small-amplitude plunging oscillations of aerofoils (Cleaver et al. Reference Cleaver, Wang, Gursul and Visbal2011), which also produce similar aerodynamic benefits. We note that all these are active flow control methods and require external power to achieve the aerodynamic benefits.
Generally, unsteady periodic excitation proved to be more efficient than steady actuation in the above studies. The same performance benefits could be achieved by much smaller amplitude of periodic excitation compared with steady actuation. Various instabilities with different length scales and frequencies in the stalled flow may be targeted for unsteady excitation. The dimensionless frequency  $fc/{U_\infty }$ of these instabilities varies from order of unity O(1) for the wake instability to one order of magnitude higher O(10) for the separated shear layer (here, f is the excitation frequency, c is the chord length and U∞ is the free-stream velocity). There are examples of excitation of the shear layer instability (Glezer, Amitay & Honohan Reference Glezer, Amitay and Honohan2005) and the wake instability (Wu et al. Reference Wu, Lu, Denny, Fan and Wu1998; Miranda et al. Reference Miranda, Vlachos, Telionis and Zeiger2005; Cleaver et al. Reference Cleaver, Wang, Gursul and Visbal2011) as well as the instability of the separation bubbles depending on the Reynolds number and aerofoil cross-section (Raju, Mittal & Cattafesta Reference Raju, Mittal and Cattafesta2008). In this paper we show that, for the aerofoil sections and the chord Reynolds number studied, the lift enhancement and the fluid–flag interactions are strongly coupled to the wake instability.
The excitation of the wake instability by periodic forcing appears to be effective in the studies discussed above, resulting in optimal dimensionless frequencies of the order of unity. This range of forcing frequencies produces large-scale leading-edge vortices, which significantly contribute to the increased time-averaged lift. Similar effects are observed when the stationary aerofoils and wings are placed in an unsteady free stream that has time-periodic unsteadiness. Examples include the cases of harmonic variations of free stream (Gursul & Ho Reference Gursul and Ho1992; Gursul, Lin & Ho Reference Gursul, Lin and Ho1994; Choi, Colonius & Williams Reference Choi, Colonius and Williams2015) and wings in the wakes of bluff bodies or flags (Zhang, Wang & Gursul Reference Zhang, Wang and Gursul2020, Reference Zhang, Wang and Gursul2022a,Reference Zhang, Wang and Gursulb). In the latter examples, quasi-periodic coherent vortices that exist in the turbulent wakes may promote formation of leading-edge vortices. In the above studies, the excitation frequency (in the free stream or in the wake) is similar to those optimal frequencies in the active flow control studies and is related to the wake instability of the stalled aerofoil flow. The wake of an aerofoil at post-stall angles of attack has many similarities to those of bluff bodies. The most well-known feature is the universal Strouhal number based on the wake width (Fage & Johansen Reference Fage and Johansen1927). The modified Strouhal number for an aerofoil is defined based on the projection of the aerofoil chord length  $S{t^\ast } = fc\!\sin (\alpha )/{U_\infty }$ ( $\alpha$ is angle of attack of the aerofoil), and is little affected by the cross-section or the aspect ratio of the wing (St* = 0.17 to 0.19, Abernathy (Reference Abernathy1962), Rojratsirikul et al. (Reference Rojratsirikul, Genc, Wang and Gursul2011) for α ≤ 30°). Next, we review the wake dynamics and its response to external excitation.
1.2. Wake resonance
Koch (Reference Koch1985) has been the first to suggest that self-excited vortex shedding occurs due to a resonance-like mechanism in the wakes. Subsequent studies confirmed that wake flows can support absolute instability that leads to the self-excited limit-cycle oscillations (Huerre & Monkewitz Reference Huerre and Monkewitz1990). For laminar wakes behind circular cylinders, Karniadakis & Triantafyllous (Reference Karniadakis and Triantafyllous1989) have investigated the effect of external periodic excitation on a wake by varying the amplitude and the frequency. If the excitation frequency is equal or close to the natural frequency of vortex shedding, the wake ‘locks-in’ and has periodic oscillations. If the amplitude of the excitation is increased, the lock-in behaviour can still be observed even for excitation frequencies that are not so close to the natural frequency. This means an increasing frequency band in which lock-in is possible as the excitation amplitude is increased. Outside of this band (for lower or higher frequencies) the wake can be described as in a ‘non-lock-in’ state, and both the excitation and the natural frequencies are found in the wake. The borders between the lock-in and the non-lock-in regions are referred to as ‘resonant horn’ (also called ‘Arnol'd tongue’) in the amplitude versus frequency plot. For the wake of a NACA0012 aerofoil set at angle of attack of α = 0° in plunging motion at a chord Reynolds number of 20 000, Young & Lai (Reference Young and Lai2007) have presented a similar Arnol'd diagram to describe the resonance around the natural wake frequency. In an experimental study of the near wake of a plunging aerofoil for the same angle of attack and Reynolds number, Turhan, Wang & Gursul (Reference Turhan, Wang and Gursul2022a) have found that the spanwise coherence (two-dimensionality) of the wake is significantly increased in the lock-in region reported by Young & Lai (Reference Young and Lai2007). This suggests that lock-in phenomenon is essentially two-dimensional because their simulations were two-dimensional.
Unlike wakes of a cylinder and a symmetric aerofoil at zero angle of attack, the wakes of aerofoils at non-zero angles of attack also exhibit the lock-in behaviour around the subharmonic of the natural wake frequency in addition to the resonance at the fundamental frequency. This has been predicted first by Wu et al. (Reference Wu, Lu, Denny, Fan and Wu1998), who have also showed that excitation at the subharmonic of the natural frequency may even be more effective than the excitation at the fundamental natural frequency. Later, this was experimentally confirmed for plunging aerofoils by Cleaver et al. (Reference Cleaver, Wang, Gursul and Visbal2011), who also showed more synchronised flow at the fundamental, subharmonic and first harmonic of the natural vortex shedding. Similarly, base pressure fluctuations on a bluff body become more synchronised in the spanwise direction in the lock-in conditions (Bearman Reference Bearman1984). Recently Choi et al. (Reference Choi, Colonius and Williams2015) have reported the existence of lock-in around the subharmonic and the fundamental frequency for plunging motion as well as surging motion (oscillations in the streamwise direction) of aerofoils. This results in the local maximum of the time-averaged lift force near the resonant conditions.
1.3. Fluid–structure interactions in separated wing flows
The possibility of exploiting the fluid–structure interactions to enhance aerodynamic performance has been first suggested by Gursul, Cleaver & Wang (Reference Gursul, Cleaver and Wang2014). Making use of wing flexibility may be considered a passive flow control method that relies on unsteady effects and yet requires no external power. For membrane wings, Song et al. (Reference Song, Tian, Israeli, Galavo, Bishop, Swartz and Breuer2008) reported complex membrane oscillations (with several structural modes excited) near the stall angle of attack and attributed this to the vortex shedding from the leading edge. A similar experiment on a two-dimensional membrane aerofoil has revealed that the wake in the post-stall regime is smaller due to the membrane vibrations, suggesting a smaller drag force compared with the rigid aerofoils (Rojratsirikul, Wang & Gursul Reference Rojratsirikul, Wang and Gursul2009). Flexible delta wings can have increased maximum lift coefficient and stall angle (Taylor et al. Reference Taylor, Wang, Vardaki and Gursul2007) because the self-excited vibrations of the wing surface (and the leading edge) promote the reattachment of the otherwise separated shear layer inboard on the wing surface.
Recently, Tan, Wang & Gursul (Reference Tan, Wang and Gursul2021) reported that the limit-cycle oscillations of a short compliant flag attached to the surface of an aerofoil near the leading edge can produce a remarkable 34 % increase in the maximum lift coefficient and delay the stall by approximately 8° at Reynolds numbers (based on the chord length) of Rec = 33 000 and 100 000. The quasi-periodic oscillations of the flag induce the formation of leading-edge vortices, which in turn produce increased time-averaged lift force. Reynolds numbers of Rec = 33 000 and 100 000 resulted in flag oscillations with the modified Strouhal numbers of St* = 0.13 and 0.19, raising the possibility of the oscillations being coupled to the wake instability at the fundamental frequency and its subharmonic. One of the main aims of the present paper is to understand under which conditions a coupling of flag oscillations with flow instabilities occurs and how this results in the enhanced time-averaged lift force. First, we briefly discuss oscillations of flags in a uniform free stream before presenting the results for flags attached to the aerofoil surface.
1.4. Flags in uniform free stream
The three non-dimensional parameters that govern the flag–fluid interactions are the structure-to-fluid mass ratio μ, the dimensionless bending stiffness KB and the Reynolds number based on the flag length ReL. They are defined as
 \begin{equation}\mu = \frac{{{\rho _s}h}}{{{\rho _f}L}},\quad {K_B} = \frac{{EI}}{{{\rho _f}U_\infty ^2{L^3}}},\quad R{e_L} = \frac{{{U_\infty }L}}{\nu },\end{equation}
where ρs is the density of flag structure, h is the thickness (see figure 1b), L is the length, EI is the bending stiffness of the flag; ρf is the density of fluid and ν is the kinematic viscosity of the fluid. Flag oscillations can be observed over a wide range of mass ratio (Shelley & Zhang Reference Shelley and Zhang2011), while the spectral features of the oscillations depend on all three parameters.
For flags with a fixed leading edge and free trailing edge in the free stream, Taneda (Reference Taneda1968) reported that flag oscillations become more irregular but still have a dominant frequency as the free-stream velocity is increased (decreasing dimensionless stiffness and increasing flag Reynolds number). Generally, frequency spectra become more broadband with increasing mass ratio (Connell & Yue Reference Connell and Yue2007) and decreasing dimensionless stiffness (Alben & Shelley Reference Alben and Shelley2008). We note that broadening of the spectra is attributed to the nonlinear fluid–structure interactions but may also be contributed by the three-dimensionality of the flag deformation in the experiments (Eloy et al. Reference Eloy, Lagrange, Souilliez and Schouveiler2008). We note that Tan et al. (Reference Tan, Wang and Gursul2021) have reported significant three-dimensionality of the oscillations of a flag attached to the aerofoil leading edge.
For inverted flags (free leading edge and fixed trailing edge), flow separation at the leading edge and formation of vortices can couple with the dynamics of flag motion and cause self-excited large-amplitude flag oscillations (Goza, Colonius & Sader Reference Goza, Colonius and Sader2018). In our case, the flags are fixed at the leading edge and free to move at the trailing edge. However, Tan et al. (Reference Tan, Wang and Gursul2021) have reported the formation of a strong vortex at the trailing edge of the flag due to the flag motion. We expect a coupling between the strong vortex and the flag motion; however, details remain to be understood better. The fluid–flag interactions become more complex when flags are placed in shear flows (Allen & Smits Reference Allen and Smits2001) or close to rigid walls (Shoele & Mittal Reference Shoele and Mittal2016). Both the existence of the shear flow and the proximity to rigid surfaces are highly relevant to the study reported in this paper.
1.5. Objectives
In this paper we investigate the effectiveness of short flags attached to the leading edge of aerofoils for post-stall flow control. By using measurements of lift force, flag oscillations and velocity field, we examine the mechanisms of self-excited flag oscillations, leading-edge vortex formation and increased lift force. We reveal how the self-excited flag oscillations develop in separated flows near an aerofoil surface, the nature of coupling between the flow instabilities, vortex roll-up and flag motion, the spatial and temporal characteristics of the flag oscillations as well as the effects of the main flag parameters, aerofoil angle of attack and aerofoil leading-edge shape.
2. Methodology
2.1. Experimental set-up
The experiments were conducted in a low-speed, closed-circuit, open-jet wind tunnel with a circular nozzle of 0.76 m in diameter located at the University of Bath. The maximum operating speed of the wind tunnel is 30 ms−1 and the free-stream turbulence intensity is 0.1 % at the maximum operating speed. The wind tunnel and the placement of the aerofoil models in the test section, the laser and the cameras in the set-up are shown schematically in figure 2. The aerofoils were mounted vertically to an aluminium binocular strain-gauge force balance beneath the lower endplate. The aerofoil profiles tested included a symmetric one (NACA0012), a cambered one (NACA6409), and a flat-plate aerofoil with a sharp leading edge. The cross-section of each aerofoil is shown in figure 2(c). The flat-plate aerofoil has a thickness-to-chord ratio of t/c = 0.12 and a 30° bevel at both sharp leading edge and trailing edge. Each aerofoil has a chord length of c = 100 mm and a span of b = 400 mm that runs the whole span of the test section between the two endplates. A small gap of around 2 mm was left between the aerofoil and the endplate. The free-stream velocity was fixed at U∞ = 15 ms−1 for all tests, corresponding to a Reynolds number based on the chord length of Rec = 100 000.

Figure 2. Schematics of the experimental set-up for (a) particle image velocimetry measurements, and (b) digital image correlation measurements. (c) Different aerofoil profiles tested.
The location of the fixed end of the flags is selected to be at the leading edge of the aerofoil in this study as the initial experiments proved it to be the best location for increased lift force. The flags were attached to the leading edge of the aerofoil with 10 mm of latex sheet glued to the lower surface of the aerofoil. The other end of the flags was free to move as sketched in figure 3. The flags extend along the entire span. Initially, only compliant flags made of a black latex natural rubber sheet were used in the experiments (see figure 3a). For attached flows over aerofoil, compliant flags remain attached to the surface, however, they generally exhibit oscillations between the surface and a location above the surface in the separated flow in the post-stall regime. These flags had a thickness of hm = 0.2 mm, and measured values of Young's modulus of E = 1.78 MPa (for strain ratios less than 1 %) and density of  ${\rho _m} = 940\;\textrm{kg}\;{\textrm{m}^{ - 3}}$. The length of the flag L was varied in the range of L/c = 0.05 to 1.0, although most of the flags had a small length (L/c ≤ 0.2). Combinations of length and thickness resulted in a range of structure-to-fluid mass ratio μ from 1.5 to 30.7 and bending stiffness KB from 4.3 × 10⁻⁶ to 3.4 × 10⁻² for the compliant flags in our experiments.

Figure 3. Schematic of the aerofoil–flag assembly for (a) compliant flags, and (b) nearly rigid flags.
In later stages of the investigation, we fabricated nearly rigid flags to improve the two-dimensionality of the flag oscillations and to increase the spanwise coherence. This was done by gluing plastic shims of different thicknesses to the latex sheets (see figure 3b). The length of the plastic-reinforced section was kept smaller than the length L of the flag, unavoidably introducing some inhomogeneity in the material properties. The intention was to help the flag to conform to the aerofoil surface as much as possible, although this is not entirely possible due to the stiffness of the plastic shims. The 5 mm portion of the flag without plastic reinforcement close to the fixed end (the leading edge) worked effectively as a hinge to allow free flapping motion of the flag. The plastic shims have thicknesses ranging from hp = 0.05 to 0.19 mm, and the densities vary from ρp = 1250 to 1470 kg m−3. Various combinations of plastic shims allow us to test a range of two key non-dimensional parameters: the structure-to-fluid mass ratio μ from 4.5 to 34.1, and the bending rigidity KB from 0.58 to 28.6.
2.2. Lift force measurements
The lift force measurements were conducted over a range of angles of attack α from 0° to 30° with a 2° increment. The main aim of this investigation was to study the increase of the lift force and stall angle; hence, the drag force was not measured; however, the time-averaged velocity field generally suggests accompanying drag reduction (Tan et al. Reference Tan, Wang and Gursul2021). The lift force signal from a strain-gauge force balance was amplified through an Analog Devices AD624 amplifier, and a NI6009 DAQ was used to log data to a personal computer at a sampling frequency of 1 kHz. In each measurement the force signal was recorded for 20 s which is sufficiently long for the mean and the root-mean-square (r.m.s.) of the signal to reach a steady state. The force balance used in this study is not suitable to reliably measure the fluctuations. This is because the frequency response of the force balance is not suitable for measuring the lift oscillations caused by flags that are of the order of 100 Hz, whereas it does not affect the time-averaged lift force. Nevertheless, we present typical values of the r.m.s. value of the lift coefficient to give an idea about the degree of unsteadiness as a function of angle of attack. The uncertainty in the force measurement is estimated to be δCL = ±0.03. Uncertainties are calculated based on the methods of Moffat (Reference Moffat1985).
2.3. Particle image velocimetry measurements
Two-dimensional particle image velocimetry (PIV) measurements were carried out using a TSI 2D-PIV system. A schematic diagram of the experimental set-up of the PIV measurements is shown in figure 2(a). A NewWave Solo 120-15 Hz double-pulse laser with a maximum energy of 120 mJ pulse−1 was used to illuminate the spanwise plane at the mid-span of the aerofoil and focused on the suction surface of the aerofoil. A TSI 9307-6 multi-jet atomiser was used to produce oil droplets to seed the flow. The atomiser worked best using olive oil and the mean size of the oil droplets was 1 μm. Flow fields were captured by a PowerView 8MP camera with a Nikon AF Nikkor 50 mm f/1.8D lens located above the tunnel test section. A TSI LaserPulse 610063 synchroniser was used to synchronise the laser pulses and the camera. For each measurement, 2000 instantaneous flow fields were captured at a rate of 1 Hz. The commercial software package TSI Insight4G and a Hart cross-correlation algorithm were used to analyse the images captured. The interrogation window was 32 × 32 pixels, producing velocity vectors with an effective grid size of around 1 % of the chord length. The proper orthogonal decomposition (POD) analysis of the flow fields was performed using the open-source OPENPIV POD TOOLBOX (Gurka, Liberzon & Hetsroni Reference Gurka, Liberzon and Hetsroni2006). The uncertainty for velocity measurements is estimated to be within 2 % of the free-stream velocity.
2.4. Digital image correlation measurements
Flag deformation was measured by means of the digital image correlation (DIC) method, which is based on capturing consecutive images of the speckling patterns on the flag surface and applying a correlation method to produce the surface displacement. This method has been previously used for membrane wings (Rojratsirikul et al. Reference Rojratsirikul, Genc, Wang and Gursul2011) and for a compliant flag attached to an aerofoil (Tan et al. Reference Tan, Wang and Gursul2021). The main advantage of this method is the capability to obtain time-accurate three-dimensional deformation fields. The spanwise coherence of the flag oscillations may be important for the fluid–structure interactions investigated in this paper. We note that the three-dimensionality of the flag surface also prevents the use of a much simpler method of the direct measurements of the flag deformation in a spanwise plane by illuminating the flag surface with a laser sheet. The flag three-dimensionality often does not allow the capture of the flag surface completely. In our experiments, we could only identify the complete flag surface in some images. Simultaneous use of the DIC and PIV is difficult due to the reflections from the flag surface. In some other applications it was possible to avoid the interference by taking the flow measurements away from the wing and in the wake (Bleischwitz, de Kat & Ganapathisubramani Reference Bleischwitz, de Kat and Ganapathisubramani2018) or limiting the PIV measurements to a spanwise plane of the surface, which was made of a different translucent membrane (Bleischwitz, de Kat & Ganapathisubramani Reference Bleischwitz, de Kat and Ganapathisubramani2017). In the latter case the change of the material and gluing may cause additional challenges (such as differences in stiffness in the spanwise direction). Any intrusive change of the flag properties may result in significant effects on the frequency and the nature of the flag oscillations. Because of these concerns, we have not attempted simultaneous measurements of the flag deformation and velocity field. Instead, we used a phase-averaging method to correlate the deformation field and the velocity field, as explained later.
Two Photron FASTCAM SA3 high-speed cameras with a Nikon AF Nikkor 24–85 mm 1 : 2.8–4 D lens were mounted normal to the flag and looking from different viewing angles. A schematic diagram of the DIC arrangement is shown in figure 2(b). Two LED floodlights were used to illuminate the speckling patterns on the flag. The slave camera was synchronised with the master camera capturing images at a rate of 500 or 1000 frames per second (f.p.s.). The exposure time was set to be much shorter than 1/f.p.s. to avoid blurred images. For each measurement, about 2700 image pairs (limited by the built-in camera memory) containing the instantaneous deformation fields were recorded. The captured images were processed by the commercial software package VIC3D8, and a custom-developed MATLAB code was used to calculate the mean and the fluctuations of the flag surface displacement fields, as well as the POD modes of the deformation field. The effective grid size was around 1.6 % of the chord length of the aerofoil. We have taken DIC measurements for a smaller number of flags compared with the total number of flags for which lift measurements were carried out, due to the simplicity of the latter.
3. Results and discussion
3.1. Self-excited flag oscillations
Most of the experiments were carried out for the NACA0012 aerofoil and at the post-stall angles of attack of α = 20° at which the largest lift increases were observed. Almost all flags exhibited self-excited oscillations. Other post-stall angles of attack and aerofoil profiles also had self-excited flag oscillations and will be presented later. In figure 4(a), we present the ensemble-averaged amplitude of the flag oscillations A, which is defined as the projection of the difference between the maximum and minimum flag locations in the cross-stream direction (see the inset in the figure), for the NACA0012 aerofoil and α = 20°. We note that these are the flags for which the deformation data have been obtained and represent a smaller subset of all flags for which the lift force has been measured. The data symbols were coloured according to the magnitude of the bending stiffness KB. We note that the nearly rigid flags have larger mass ratio and several orders of magnitude larger bending stiffness compared with the compliant flags, however, both types of flags can exhibit large-amplitude oscillations depending on the length and the material properties. The normalised amplitude A/c decreases with increasing mass ratio for compliant flags whereas there is large scatter for the nearly rigid flags. This is because the flags in this graph had a range of normalised length of L/c = 0.1–0.375, which also affects the amplitude A.

Figure 4. (a) Ensemble-averaged amplitude of flag oscillations normalised by the aerofoil chord length as a function of flag bending stiffness  ${K_B}$ and structure-to-fluid mass ratio $\mu $; (b) variation of flag Strouhal number as a function of mass ratio and length L/c; for $\alpha = 20\mathrm{^\circ }$ and NACA0012.
In figure 4(b), the variation of the flag Strouhal number fA/U∞ (where f is the dominant frequency of the flag oscillations) is shown as a function of the mass ratio and normalised flag length L/c for the same parameters as in panel (a). The Strouhal number represents the ratio of the flag-tip velocity to the free-stream velocity, which can be considered as an amplitude parameter for the excitation of the separated shear layer over an aerofoil. The Strouhal number generally decreases with increasing mass ratio and is larger for the nearly rigid flags, but less than 0.1. Shorter flags can equally produce similar magnitude of intensity of excitation as longer flags.
For two flags with the same length (L/c = 0.2) and similar mass ratios (a compliant flag of μ = 7.7 and a nearly rigid flag of μ = 10.0), the power spectral density of the displacement of the flag tip (x′ = L, where x′ is the flag-chordwise distance) at mid-span (z = 0) for α = 20° are compared in figure 5. The dominant frequencies of the limit-cycle oscillations of the flags are f = 56 Hz and 78 Hz. The most noticeable difference between the spectra of the two flags is that the compliant flag has a broader dominant peak whereas there is a narrower peak for the nearly rigid flag. The dominant frequencies of the two flags correspond to the modified Strouhal numbers based on the projection distance of the aerofoil  $fc\!\sin (\alpha )/{U_\infty } = 0.13$ and 0.18. For rigid aerofoils the natural vortex shedding frequencies are approximately in the range of $fc\!\sin (\alpha )/{U_\infty } \approx 0.17\unicode{x2013} 0.19$ (Rojratsirikul et al. Reference Rojratsirikul, Genc, Wang and Gursul2011), hence there is a good possibility that the flag oscillations and the natural wake instability of the aerofoil may have been coupled. A previous study on membrane wings also suggested that membrane vibration frequencies lock-in with the wake instability (Rojratsirikul et al. Reference Rojratsirikul, Genc, Wang and Gursul2011).

Figure 5. Power spectral density of displacement of the flag tip (x′/L = 1) at mid-span (z/c = 0) as a function of frequency for  $\alpha = 20\mathrm{^\circ }$, NACA0012, and (a) compliant flag, $\mu = 7.7$, L/c = 0.2, and (b) nearly rigid flag, $\mu = 10.0$, L/c = 0.2.
Figure 6 presents the location of the ensemble-averaged maximum displacement of the flag tip for the NACA0012 aerofoil at α = 20°. The blue dashed line shows the location of the time-averaged shear layer (location of the maximum time-averaged vorticity) for the baseline case (no flag attached). It is seen that the oscillations of the compliant flags are almost bounded between the time-averaged separated shear layer and the aerofoil surface, whereas the nearly rigid flags can have excursions further into the outer flow regardless of their mass ratio.

Figure 6. Location of the ensemble-averaged maximum displacement of flag tip for  $\alpha = 20\mathrm{^\circ }$ and NACA0012 profile.
3.2. Lift enhancement
The variation of the time-averaged lift coefficient CL as a function of angle of attack α for the NACA0012 aerofoil for compliant flags and nearly rigid flags are shown in figures 7(a) and 7(b), respectively. The compliant flags have virtually no adverse effect on the mean lift force at small angles of attack if the length of the flag L is smaller than 0.5c. In the post-stall regime, significant lift enhancement and delay of stall can be achieved for 0.05 < L/c < 0.5. For the compliant flags, we used membranes with the same density and thickness. Therefore, the mass ratio is inversely proportional to the flag length L. Figure 7(a) suggests that there is a wide range of flag length (or mass ratio) that provides significant lift enhancement. However, for very short or very long flags (very large and very small mass ratios), there is some deterioration. This suggests that both the mass ratio μ and the normalised flag length L/c affect the degree of lift enhancement. The compliant flag with L/c = 0.1 and a mass ratio of μ = 15.4 has a maximum lift coefficient of CL,max = 1.29 and a stall angle of αs = 20°. The changes are extraordinary as these represent a 34 % increase in the maximum lift coefficient compared with the baseline case (equivalently a 73 % increase in the lift coefficient at the same angle of attack) and an 8° delay of the stall angle.

Figure 7. Time-averaged lift coefficient  $C_L$ for NACA0012 as a function of angle of attack $\alpha $ for (a) compliant flags, (b) nearly rigid flags, (c) r.m.s. lift coefficient versus angle of attack.
For the nearly rigid flags, we have the capability to vary the mass ratio for a fixed length of flag length by adjusting the mass of the plastic reinforcement. Most of the flags in figure 7(b) have the same length of L/c = 0.2 with varying mass ratio. The lift curves have a slightly lower gradient in the pre-stall regime than the baseline case. This is likely to be due to the large stiffness of the nearly rigid flags which modifies the aerofoil shape (see also figure 3b). In the post-stall angles of attack, again most flags were able to produce significant lift enhancement and stall delay. The highest lift coefficient recorded was for the μ = 24.6, L/c = 0.2 nearly rigid flag with CL,max = 1.51 at α = 30° (which is the largest angle of attack measured) and the stall angle is expected to be at or beyond α = 30°. These represent a 57 % increase in the CL,max and a 42 % lift enhancement at the same angle of attack. We note that there is a trend of increasing CL,max with increasing mass ratio for L/c = 0.2. Nearly rigid flags can reach to higher stall angles and larger maximum lift coefficients compared with compliant flags.
In figure 7(c), for one compliant and one nearly rigid flag with similar mass ratios, the peak-to-peak variations of the lift fluctuations are represented by adding the r.m.s. value to and subtracting the r.m.s. value from the mean value. The lift fluctuations at pre-stall angles of attack are small for both flags as well as for the baseline (clean) aerofoil. At post-stall angles of attack, the lift fluctuations are larger for all three cases. With the flags, the amplitude of the lift fluctuations is much larger compared with the clean aerofoil as strong leading-edge vortices advect over the aerofoil surface. The largest fluctuations are observed around the stall angle of the aerofoil with flags.
An example of instantaneous vorticity field is shown for the baseline NACA0012 aerofoil at α = 20° in figure 8(a). The instantaneous vorticity fields for the two flags with the same length (L/c = 0.2) and similar mass ratios (compliant flag of μ = 7.7 and nearly rigid flag of μ = 10.0) are also shown in figures 8(b) and 8(c) when the flags are close to the maximum displacement from the aerofoil surface. For these two cases, it was possible to identify the flag shapes directly in the PIV images. Note that the flag-tip spectra for the two flags were presented in figure 5. Both vorticity fields in figures 8(b) and 8(c) show that a leading-edge vortex is formed when the flag is away from the aerofoil surface. Vorticity shedding from the flag and subsequent roll-up into a coherent vortex are similar to the dynamic stall process reported for unsteady aerofoils (McCroskey Reference McCroskey1982) and unsteady free stream discussed in the Introduction.

Figure 8. Instantaneous vorticity contours for  $\alpha = 20\mathrm{^\circ }$ and NACA0012 for (a) baseline, (b) compliant flag, $\mu = 7.7$, L/c = 0.2 and (c) nearly rigid flag, $\mu = 10.0$, L/c = 0.2.
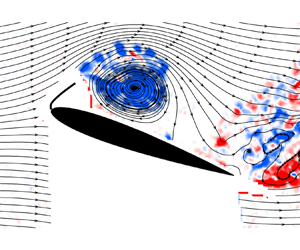
Corresponding contours of the time-averaged velocity magnitude superimposed on the streamline patterns for the three cases are shown in figure 9. For the baseline case, the mean flow is seen to separate near the leading edge, and the centre of the recirculation region is just downstream of the trailing edge. When there is a leading-edge flag attached, a large separation bubble above the aerofoil is observed, which appears to reattach near the trailing edge. The large separation bubble in the time-averaged sense produces highly curved mean streamlines over the aerofoil, resulting in the substantial increase in the mean lift. Interestingly, the nearly rigid flag produces a separation bubble that is larger than that of the compliant flag. However, the time-averaged lift of the two flags is not very different at this angle of attack (see figure 7). The instantaneous flag shapes obtained from the DIC measurements are also superimposed onto the velocity field. In both cases the flag tip appears to have excursions into the outer flow whereas the minimum tip displacement remains close to the aerofoil surface. As the self-excited oscillations of the flags are the source of the excitation of the separated shear layer at the post-stall angles of attack, we examined the unsteady characteristics of the flag oscillations next.

Figure 9. Time-averaged velocity magnitude contours for  $\alpha = 20\mathrm{^\circ }$ and NACA0012 for (a) baseline, (b) compliant flag, $\mu = 7.7$, L/c = 0.2 and (c) nearly rigid flag, $\mu = 10.0$, L/c = 0.2.
3.3. Unsteady characteristics of flag oscillations
The instantaneous displacement of the flag tip at mid-span (z = 0) (left) and the cross-stream component of the velocity of the flag tip (right, obtained by differentiating the displacement) are shown in figure 10 for the same two flags and at the same angle of attack. These flags have equal length and similar mass ratio, but very different stiffnesses, and were discussed in figures 5, 8 and 9. The displacement of the flag tip is presented as the coordinates of the flag tip in the x–y plane in figure 10 (left column). The red data points mean the flag is moving up. The tip velocity (right column) is presented as a function of the cross-stream coordinate of the flag tip in a phase plot. The compliant flag shown in figure 10(a), for μ = 7.7, L/c = 0.2, exhibits more scattered data points, indicating the less repeatable and less periodic nature of the oscillations, compared with the nearly rigid flag shown in figure 10(b), for μ = 10.0, L/c = 0.2.

Figure 10. Instantaneous displacement of the flag tip at mid-span (z = 0) (left) and the cross-stream component of the velocity of the flag tip (right) for (a) compliant flag,  $\mu = 7.7$, L/c = 0.2, and (b) nearly rigid flag, $\mu = 10.0$, L/c = 0.2; NACA0012 aerofoil at $\alpha = 20\mathrm{^\circ }$.
The phase plot for the tip velocity of the compliant flag (top right) indicates that the maximum upward and downward tip velocities are similar in magnitude, but the tip trajectory and velocity are much less periodic compared with the nearly rigid flag. The maximum magnitudes of the tip velocity during the upward and downward parts of the cycle are different for the nearly rigid flag. It moves up slowly but comes down very rapidly. The trajectory of the flag tip is more repeatable and periodic, and reveals some hysteresis. The less repeatable nature of the flag-tip oscillations for the compliant flag is mostly caused by the three-dimensional nature of the flag oscillations as demonstrated next.
Figure 11 presents the results of the POD analysis of the flag displacement for the compliant flag μ = 7.7, L/c = 0.2 and the nearly rigid flag μ = 10.0, L/c = 0.2 at α = 20° for the NACA0012 aerofoil. The fraction of energy of the POD modes is shown as a function of mode number in figure 11(a). For mode numbers larger than three, the energy of each mode becomes very small. For the nearly rigid flag the energy of the first mode alone exceeds 80 %. The sum of the first three modes is around 96 % of the total energy. In contrast, the first mode has an energy fraction just above 40 %, and the sum of the first three modes is around 70 % for the compliant flag. For both flags, the first mode is like a ‘first beam mode’, whereas the higher modes are spanwise modes of the first beam mode. Figure 11 confirms that the nearly rigid flag has much better two-dimensionality.

Figure 11. The POD analysis of flag displacement for NACA0012 and  $\alpha = 20\mathrm{^\circ }$, (a) percentage of energy of each mode; mode shapes for the first three modes for (b) compliant flag, $\mu = 7.7$, L/c = 0.2, and (c) nearly rigid flag, $\mu = 10.0$, L/c = 0.2.
The degree of two-dimensionality can be quantified by examining the two-point cross-correlation coefficient of the flag-tip displacement as a function of spanwise distance z/c. The cross-correlation coefficient can be defined using the fluctuations at two locations (Bendat & Piersol Reference Bendat and Piersol2000). For the flag displacements in our case, it becomes
 \begin{equation}C = \frac{{\overline {{{y^{\prime}}_A}{{y^{\prime}}_B}} }}{{\sqrt {\overline {y^{\prime 2}_A} } \sqrt {\overline {y^{\prime 2}_B} } }},\end{equation}
where  ${y^{\prime}_A}$ is the fluctuating flag displacement at a reference point A, and ${y^{\prime}_B}$ is the fluctuating flag displacement at any arbitrary location B on the flag surface. In figure 12, the reference point A is chosen at z/c = 0 and at the flag tip (x′/L = 1). The two-point cross-correlation coefficient for the compliant flag decays fast in the spanwise direction to around zero at approximately 0.5c (about 2.5L) from the midspan, indicating the spanwise length scale of the flag vibrations to be less than one chord length of the aerofoil for this flag. In contrast, for the nearly rigid flag, the cross-correlation coefficient decays to around 0.9 at one chord length, indicating that the two-dimensionality of the nearly rigid flag is significantly better. The improvement of the two-dimensionality of the flag displacement in the spanwise direction may lead to a more coherent flow in the spanwise direction. It is seen in figure 7 that nearly rigid flags can produce higher maximum lift coefficient (depending on the mass ratio), which can be attributed to their improved two-dimensionality of the flag oscillations.

Figure 12. Two-point cross-correlation coefficient of the flag displacement at x′/L = 1 as a function of spanwise distance z/c for  $\alpha = 20\mathrm{^\circ }$ and NACA0012 aerofoil.
As discussed previously the nearly rigid flags have large stiffness over most of the flag length, but smaller stiffness near the fixed end (leading edge of the aerofoil). This results in some differences in the flag motion compared with the compliant flags. The comparison of the phase-averaged flag shapes is presented in figure 13 for the two flags under discussion (the compliant flag of μ = 7.7, L/c = 0.2 and the nearly rigid flag of μ = 10.0, L/c = 0.2) for the NACA0012 aerofoil at α = 20°. The phase-averaging process involves examination of the flag-tip displacement obtained by the DIC measurements, identification of the local maxima and marking them as the beginning of each cycle and then calculation of the ensemble averages at equally divided phases. In figure 13 these are presented at sixteen phases, and the flag shapes are presented in different colours and line type according to the direction of the flag movement – a red flag indicates that the flag is moving upwards, whereas a black flag indicates the flag is moving towards the aerofoil surface. The excursions into the outer flow are more evident for the nearly rigid flag. This is a more general conclusion as seen for other nearly rigid flags in figure 6. For both flags in figure 13, the maximum flag-tip velocity during the downward motion has a larger magnitude compared with the upward motion, but this is more pronounced for the nearly rigid flag. The biggest qualitative difference in the flag shapes is observed when the flag tip is close to the aerofoil surface. Unlike the compliant flag, the nearly rigid flag displays a hump near the leading-edge region of the aerofoil. This is due to the flexible hinge of the flags. At this phase of the flag oscillations the hump is likely to cause flow separation near the fixed end of the flag. The interaction of the flow with the flag as well as the mechanism of the upward motion of the flag are examined next.

Figure 13. Phase-averaged flag shapes for  $\alpha = 20\mathrm{^\circ }$ and NACA0012 aerofoil, (a) compliant flag, $\mu = 7.7$, L/c = 0.2, and (b) nearly rigid flag, $\mu = 10.0$, L/c = 0.2.
3.4. Mechanism of self-excited flag oscillations
In figure 14, three representative instantaneous vorticity contours over a magnified region near the flag are presented for (a) the compliant flag, μ = 7.7, L/c = 0.2, and (b) the nearly rigid flag, μ = 24.6, L/c = 0.2 for the NACA0012 aerofoil at α = 20°. The three instants in each case are selected to demonstrate the flow over the flag and the aerofoil. The left column is representative of the flow when the flag is closest to the aerofoil surface. For both flags, the flow is separated near the fixed end of the flag. In contrast, when the flag is at the farthest location from the aerofoil surface (right column), the flow over the flag appears nearly attached for both flags. At the maximum of the flag displacement, the flow separates from the free end of the flag and a large vortex appears to have shed from the flag. At this instant the combination of the attached flow over the upper surface of the flag and the totally separated flow below the lower surface of the flag (with negative pressure region) gives rise to the clockwise moment about the fixed end of the flag, resulting in the flag motion towards the aerofoil surface.

Figure 14. Examples of instantaneous vorticity contours of a magnified region when the flag tip is near minimum, mean and maximum displacement from the aerofoil surface (from left to right) for NACA0012 at  $\alpha = 20\mathrm{^\circ }$ for (a) compliant flag, $\mu = 7.7$, L/c = 0.2, (b) nearly rigid flag, $\mu = 24.6$, L/c = 0.2; (c) schematic of vortex–flag interaction at the minimum of the flag displacement (left image) and the maximum of the flag displacement (right image).
For both flags, the downward motion of the flag ends with totally separated flows over the flag at the minimum of the flag displacement. Around this instant, however, vorticity continues to shed, rolling into a growing vortex. The flag appears to be in totally separated flows over both the upper and lower surfaces. As a first approximation the pressure acting on both surfaces of the flag can be assumed to be roughly constant and equal. The flag starts to move up again due to the induced velocity of the growing vortex. As the flag moves away from the aerofoil surface the vortex becomes larger in size and stronger in circulation. This continues until the flag reaches the maximum displacement and the vortex sheds.
In summary, for both the compliant and the nearly rigid flags, flow over the flag and motion of the flag have similarities in spite of some details of the motion being different. We suggest two different mechanisms at play for the upward and downward motions of the flag. Schematics of the vortex–flag interaction at the extremum of the flag tip are shown in figure 14(c). When the flag tip is near its maximum, the fully separated flow at the free end of the flag and the wake of the flag have some similarities to the free-streamline theory for a flat plate inclined to the free stream (Kirchhoff Reference Kirchhoff1869; Rayleigh Reference Rayleigh1876). This flow produces a clockwise moment about the fixed end of the flag. In contrast, when the flag tip is at its minimum, the flag is immersed in mostly separated flow and the restoring force and moment can be attributed to the induced velocity of the vortex.
3.5. Phase-averaged flow over aerofoil
As explained previously, we did not attempt to measure the flow and flag shape simultaneously. The instantaneous images for which the flag is between the extrema of the flag tip (such as those in the middle column in figure 14a,b) are difficult to interpret as we do not precisely know whether the flag is moving upward or downward. We used a phase-averaging method based on the POD of the velocity field, and then we synchronised the phase-averaged flow with the phase-averaged flag deformation as explained below. Using the POD analysis we can obtain a reduced-order model of the unsteady flow (Sirovich Reference Sirovich1987; Berkooz, Holmes & Lumley Reference Berkooz, Holmes and Lumley1993). Instantaneous streamwise velocity component can be written as
 \begin{equation}u(x,y,t) = U(x,y)
+ u^{\prime}(x,y,t) = U(x,y) + \mathop \sum \limits_1^M
{a_n}{(t)\varPhi_n}(x,y),\end{equation}
\begin{equation}u(x,y,t) = U(x,y)
+ u^{\prime}(x,y,t) = U(x,y) + \mathop \sum \limits_1^M
{a_n}{(t)\varPhi_n}(x,y),\end{equation}
where U and  $u^{\prime}$ are the mean and fluctuating velocity components; $\varPhi_n$ and an are the POD modes and the corresponding time-dependent coefficients, and M is the number of snapshots. Figure 15 shows the POD analysis of the flow field over the aerofoil with the μ = 7.7, L/c = 0.2 compliant flag and the μ = 10.0, L/c = 0.2 nearly rigid flag for α = 20° and NACA0012 aerofoil. These two flags are the same ones for which deformation characteristics were discussed earlier in figures 10 and 11. The relative energy of the POD modes is shown in figure 15(a) as a function of the mode number. The total energy of the first two most energetic modes of the nearly rigid flag case has more than half of the total energy, which is almost twice the energy for the compliant flag case (59.4 % and 32.8 %, respectively). As expected, more coherent flag oscillations cause more coherent and periodic flow fields for the nearly rigid flag.

Figure 15. The POD analysis of flow field for NACA0012 and  $\alpha = 20\mathrm{^\circ }$, (a) fraction of energy as a function of mode number; the first two dominant vorticity modes for (b) compliant flag, $\mu = 7.7$, L/c = 0.2 and (c) nearly rigid flag, $\mu = 10.0$, L/c = 0.2.
Next, we use the method proposed by van Oudheusden et al. (Reference Van Oudheusden, Scarano, Van Hinsberg and Watt2005) for wake flows and vortex shedding. This method and its modified versions were successfully applied to the wakes of stationary bluff bodies (van Oudheusden et al. Reference Van Oudheusden, Scarano, Van Hinsberg and Watt2005; Zhang et al. Reference Zhang, Wang and Gursul2022a), flags in a uniform free stream (Zhang et al. Reference Zhang, Wang and Gursul2022b) and oscillating aerofoils (Turhan et al. Reference Turhan, Wang and Gursul2022a; Turhan, Wang & Gursul Reference Turhan, Wang and Gursul2022b). The method assumes that the unsteady periodic flow can be approximated by the first two POD modes and the corresponding coefficients are found as
 \begin{equation}{a_1} = \sqrt {2{\lambda _1}} \sin ({\phi _{flow}}),\quad {a_2} = \sqrt {2{\lambda _2}} \cos ({\phi _{flow}}),\end{equation}
where λ 1 and λ 2 are the eigenvalues of the two-point cross-correlation matrix,  ${\phi _{flow}}$ is the vortex shedding phase angle, which is assumed to increase linearly with time according to $\textrm{d}{\phi _{flow}}/\textrm{d}t = 2{\rm \pi} f$, where f is the fundamental frequency of vortex shedding from the flag. This method works well only if the first two modes have relatively high energy fraction (60 % or higher) as reported by van Oudheusden et al. (Reference Van Oudheusden, Scarano, Van Hinsberg and Watt2005). However, for some flags in our case, the first two modes have less energy fraction (see for example the case of the compliant flag in figure 15). In these cases, a phase-averaging method based on the POD analysis can be adapted (Zhang et al. Reference Zhang, Wang and Gursul2022a,Reference Zhang, Wang and Gursulb). In this method, a smaller PIV measurement domain just downstream of the flag is analysed by the POD method to obtain a periodic reference signal. In a smaller domain close to the oscillating flag the POD analysis provides much higher energy fraction of the first two modes as the periodicity of the flow is much higher. In the present study we used a measurement domain with a typical size of 0.5c by 0.4c just downstream of the flag tip. The sum of the first two modes had energy fraction varied between 52 % and 76 %. Once the phase information ${\phi _{flow}}$ for each instantaneous flow field is determined, this phase information is used to carry out phase averaging in the whole flow field. The instantaneous PIV data are sorted according to their phase angles in a bin size of ± 5° and then ensemble averaged to obtain the phase-averaged flow fields.
The final step is the synchronisation of the phase-averaged flow fields and the flag shapes. The phase-averaged flag shapes were obtained by ensemble averaging of oscillation cycles as explained in the discussion of figure 13. The phase of the flag oscillations was defined by taking the instant of the maximum flag-tip displacement as zero: at t′ = 0 and  ${\phi _{flag}} = 0$, yflag,tip is maximum. This is illustrated in figure 16(a), where the phase-averaged flag-tip location at mid-span is plotted as a function of ${\phi _{flag}}$ and $t^{\prime}/T$. Typically, more than 150 cycles were used to produce the phase-averaged displacement. The flow phase angle ${\phi _{flow}}$ obtained from the POD analysis of the flow field $\textrm{(d}{\phi _{flow}}/\textrm{d}t = 2{\rm \pi} f)$ is not the same but related to ${\phi _{flag}}$. The process of finding the phase angle between ${\phi _{flow}}$ and ${\phi _{flag}}$ is explained in figure 16(b), which uses the information from the measured flow fields. It is assumed that, when the flag tip reaches the maximum displacement from the aerofoil surface, the flow separates from the flag tip as shown in the example in figure 16(c). We monitored the maximum vorticity along a vertical line (dotted line in figure 16c) placed slightly downstream of the flag tip and located at 0.2c downstream of the leading edge. When the cross-stream coordinate of the location of the maximum vorticity becomes maximum, we assume that the flag tip also reaches its maximum distance from the aerofoil surface. As we do not have time-resolved PIV data, the location of the maximum vorticity was calculated for each instantaneous flow, sorted according to their phase angle ${\phi _{flow}}$, and then ensemble averaged in phase angle intervals to obtain phase-averaged location of maximum vorticity. The location of maximum vorticity is shown in figure 16(b) with the red curve. As the maximum of this curve marks the instant at which the flag reaches its maximum displacement, the phase-averaged flag-tip curve in figure 16(a) is shifted by Δt in time or $\Delta \phi $ in phase so that the peaks of the curves match in figure 16(b): at t = t′ + Δt and ${\phi _{flow}} = {\phi _{flag}} + \Delta \phi $. This assumption is validated in figure 16(c), in which the phase-averaged flag shape obtained by this approach is compared with the instantaneous flag shape identified from the PIV images when the flag is at the maximum displacement from the surface.

Figure 16. Process of synchronisation of flow field and flag displacement fields; (a) phase-averaged flag-tip displacement as a function of flag oscillation phase angle  ${\phi _{flag}}$ obtained from DIC; (b) location of ensemble-averaged maximum vorticity as a function of flow phase angle ${\phi _{flow}}$ and shifted phase-averaged flag tip; and (c) comparison between an instantaneous (obtained from PIV measurements) and phase-averaged flag shape (obtained from DIC measurements); $t = t^{\prime} + \mathrm{\Delta }t$ and ${\phi _{flow}} = {\phi _{flag}} + \Delta \phi $; at $t = \mathrm{\Delta }t$, ${y_{flag,tip}} = {y_{max}}$; the data presented are for nearly rigid flag, $\mu = 10.0$, L/c = 0.2, and NACA0012 aerofoil at $\alpha = 20\mathrm{^\circ }$.
For the compliant flag (μ = 7.7, L/c = 0.2) and the nearly rigid flag (μ = 10.0, L/c = 0.2) at α = 20° for the NACA0012 aerofoil, the phase-averaged vorticity fields are compared in figures 17 and 18. The phase-averaged vorticity fields are presented at equal intervals in the cycle starting at t′/T = 0, which corresponds to the phase when the phase-averaged flag tip reaches its maximum (see also figure 16a). For the compliant flag case, a newly formed leading-edge vortex (LEV) is first seen between t′/T = 0.25 and 0.375 as the flag moves down. The growth of the vortex continues during the rest of the period as the flag moves down and then up, reaching the maximum displacement at t′/T = 0, and then until shedding from the flag at a later instant. Mostly attached flow when the flag is away from the aerofoil surface and mostly separated flow when the flag is closer to the aerofoil surface can be identified in the phase-averaged flows.

Figure 17. Phase-averaged vorticity fields superimposed with phase-averaged flag shapes for compliant flag,  $\mu = 7.7$, L/c = 0.2, NACA0012 aerofoil at $\alpha = 20\mathrm{^\circ }$.

Figure 18. Phase-averaged vorticity fields superimposed with phase-averaged flag shapes for nearly rigid flag,  $\mu = 10.0$, L/c = 0.2, NACA0012 aerofoil at $\alpha = 20\mathrm{^\circ }$.
Similarly, for the nearly rigid flag case, vortex shedding from the flag occurs during the downward motion of the flag around t′/T = 0.25. Indications of a new vortex developing are also observed when the flag is closer to the aerofoil surface. The vortex grows during the upward motion of the flag because of continuous feeding of vorticity. The comparison of figures 17 and 18 reveals that not only the size of the vortices is different, but also the distance between two successive vortices shed from the flag and the distance of the centre of the vortex from the aerofoil surface. The vortex for the nearly rigid flag is much stronger. As discussed in figure 15, the POD analysis also confirms that the flow is more coherent for the nearly rigid flag. However, the time-averaged lift force differs little for the two flags, as noted earlier (see figure 7). For the nearly rigid flag, the reattachment line on the aerofoil surface appears to pass the trailing edge when the flag is near the aerofoil surface. In this case, there is also a clear indication of formation and shedding of a trailing-edge vortex as the flag moves up.
The circulation of the LEVs was calculated as line integral of velocity around the contours marked with dashed lines in figures 17 and 18. The LEV grows in size and strength as it advects over the aerofoil. As the vortex grows in size and advects, the circulation contours are adjusted to include all vorticity in the enclosed regions. The time history of the circulation normalised by the free-stream velocity and the chord length of the aerofoil is plotted in figure 19(a) as a function of t′/T for the two flags discussed above. There are also two other cases for different flags in the same figure, which will be discussed later. Depending on the normalised flag length L/c and the mass ratio μ, the maximum circulation differs for each case. The maximum LEV circulation occurs when the vortex detaches from the flag and before the new vortex forms (see also figures 17 and 18).

Figure 19. Time history of LEV circulation for NACA0012 aerofoil at  $\alpha = 20\mathrm{^\circ }$: (a) circulation normalised by free-stream velocity and chord length versus t′/T; (b) circulation normalised by free-stream velocity and flag oscillation frequency versus ${\phi _{flag}}$.
For each case, the magnitude of the circulation starts to increase around t′/T = 0.5 (when the flag tip is near the aerofoil surface) and almost linearly as a function of t′/T, but with different rates (figure 19 was plotted for two cycles for clarity). The linear increase of the circulation in figure 19(a) can be understood if it is assumed that all vorticity shed from the flag during the upward motion rolls into the LEV. Furthermore, we assume that the velocity of the shear layer at the separation point is proportional to the free-stream velocity U∞. Then the vorticity flux from the separated shear layer is related to the magnitude of circulation of the LEV as follows:
 \begin{equation}\frac{{\textrm{d}\varGamma }}{{\textrm{d}t}}\; \propto \; \frac{{U_\infty ^2}}{2}.\end{equation}
If we assume that the circulation starts to increase when the flag is closest to the aerofoil surface, and this instant is roughly at the middle of the cycle  $(t^{\prime} = 0.5T)$, then
 \begin{equation}\varGamma \propto U_\infty ^2(t^{\prime} - 0.5T),\end{equation}
which is consistent with the linear increase of the circulation with time. This can be rearranged as
 \begin{equation}\varGamma \propto U_\infty ^2(t^{\prime} - 0.5T) = \frac{{U_\infty ^2}}{f}\left( {\frac{{t^{\prime}}}{T} - 0.5} \right) \propto \frac{{U_\infty ^2}}{f}({\phi _{flag}} - {\rm \pi}),\end{equation}
and suggests a new non-dimensionalisation
 \begin{equation}\frac{{\varGamma f}}{{U_\infty ^2}} \propto ({\phi _{flag}} - {\rm \pi}),\end{equation}
which predicts a collapse of the data. This is confirmed in figure 19(b) by plotting the new non-dimensionalisation for different flags of varying mass ratio, length and stiffness. There is a reasonable collapse of the experimental data. This also suggests that the maximum circulation of the flag vortices is inversely proportional to the flag oscillation frequency. A curve fit in the form of a straight line suggests that the constant of the proportionality in (3.7) is approximately 0.14 rad−1, which implies that the velocity of the shear layer at the separation point is roughly 1.3U∞. There is some subjectivity in choosing the enclosed regions in the calculations of the circulation. However, when properly non-dimensionalised, the circulation data collapse well in figure 19(b) for different flags and fit the simple model developed (3.7). This suggests that the choice of the enclosed regions is reasonable.
3.6. Effect of mass ratio
The mass ratio is the main parameter affecting the frequency of the flag oscillations. The flag that produces the highest CL,max, i.e. the nearly rigid flag, μ = 24.6, L/c = 0.2 (see figure 7b), will be compared with the nearly rigid flag (μ = 10.0, L/c = 0.2) shown in figure 18. The dominant frequency of the flag oscillations is f = 39 Hz for μ = 24.6, which is half that of the μ = 10.0 nearly rigid flag. Hence, for the fixed flag length, the mass ratio can be used as a controlling parameter for the flag oscillation frequency. Equation (3.7) predicts that the maximum circulation will be larger for the heavier flag with the lower frequency of oscillations. This is confirmed in figure 19, in which the nearly rigid flag with μ = 24.6, L/c = 0.2 has the largest maximum circulation.
Figure 20 shows the phase-averaged vorticity contours superimposed with the phase-averaged flag shapes for the NACA0012 aerofoil with the nearly rigid flag, μ = 24.6, L/c = 0.2 attached to the leading edge at α = 20°. The comparison of figures 18 and 20 reveals that, for the same flag length, the flag with the larger mass ratio produces larger vortices. Unlike the case in figure 18, two consecutive LEVs cannot be seen in the same field of view at any phase in figure 20. Otherwise, the main features remain similar between the two cases. The vortex shedding occurs during the downward motion of the flag and the growth of the vortex is noticeable during the upward motion of the flag. During the upward motion of the flag the flow over the flag appears to remain totally separated, while the reattachment line on the aerofoil moves downstream. The counter-rotating trailing-edge vortex is also visible in figure 20.

Figure 20. Phase-averaged vorticity fields superimposed with phase-averaged flag shapes for nearly rigid flag,  $\mu = 24.6$, L/c = 0.2, NACA0012 aerofoil at $\alpha = 20\mathrm{^\circ }$.
The variation of the normalised lift change is shown as a function of the mass ratio and normalised flag length L/c in figure 21(a) for the NACA0012 aerofoil at  $\alpha = 20\mathrm{^\circ }$. The normalised lift change is defined as $({C_L} - {C_{L,c}})/{C_{L,c}}$, where CL,c is the lift coefficient of the clean aerofoil at a given angle of attack. For small mass ratios, there is a trend of increasing normalised lift change with increasing mass ratio, followed by a levelled increase of lift for larger mass ratios. Both the compliant and nearly rigid flags can produce high lift. For the best-performing flags, extensive deformation measurements were carried out to measure the dominant flag frequency and peak-to-peak amplitude. The variation of the normalised lift change is shown as a function of the Strouhal number in figure 21(b). For all these effective flags, the Strouhal number varies approximately between 0.02 and 0.1, yet the lift increase is roughly saturated. Even for very small values of the Strouhal number, regardless of the stiffness of the flag, high lift can be produced. Increasing the flag Strouhal number does not necessarily increase the lift. The lack of sensitivity of the lift to the magnitude of the Strouhal number can be considered as a consequence of the resonance and the lock-in of the flag with the wake.

Figure 21. Variation of normalised lift increase as a function of (a) flag mass ratio and flag length, (b) flag Strouhal number, for NACA0012 aerofoil at  $\alpha = 20\mathrm{^\circ }$.
3.7. Effect of angle of attack
The nearly rigid flag, μ = 24.6, L/c = 0.2 was investigated further at a different angle of attack of α = 30°, at which the aerofoil–flag assembly produces a remarkable 42 % increase in the lift coefficient and a stall delay of at least 18°. At α = 30°, the vibration frequency of this flag remains the same as that at α = 20°, i.e. f = 39 Hz. The phase-averaged vorticity contours superimposed with the phase-averaged streamlines and the flag shapes are presented in figure 22. The LEVs at all corresponding times are larger than those at α = 20° (compare with figure 20). The other essential aspects are similar. Like the case in figure 20, the growth of the vortex during the upward motion and subsequent shedding of the vortex during the downward motion are similar.

Figure 22. Phase-averaged vorticity fields superimposed with phase-averaged flag shapes for nearly rigid flag,  $\mu = 24.6$, L/c = 0.2, NACA0012 aerofoil at $\alpha = 30\mathrm{^\circ }$.
For α = 30°, the corresponding modified Strouhal number  $S{t^\ast } = fc\!\sin (\alpha )/{U_\infty } = 0.13$, while for α = 20° it is $S{t^\ast } = fc\!\sin (\alpha )/{U_\infty } = 0.09$ (case in figure 20). For other flags presented previously at α = 20°, the modified Strouhal number varies in a narrow range: $S{t^\ast } = fc\!\sin (\alpha )/{U_\infty } = 0.13$ (case in figure 17), 0.18 (case in figure 18) and 0.13 and 0.19 at two different Reynolds numbers (Tan et al. Reference Tan, Wang and Gursul2021). As discussed in the Introduction and proposed by Tan et al. (Reference Tan, Wang and Gursul2021), resonance of the flag oscillations with the wake instability is a possibility. To understand whether this indeed occurs at other angles of attack, we measured the flag deformation for four different flags (two compliant and two nearly rigid flags) with different mass ratio and flag length as a function of angle of attack. As the flag oscillations and the lift enhancement occur at post-stall angles of attack (see also figure 7), our measurements focussed on the post-stall regime of the clean aerofoil.
Figure 23 shows the modified Strouhal number as a function of  $(\alpha - {\alpha _{s,c}})$ for the NACA0012 aerofoil, where ${\alpha _{s,c}}$ is the stall angle of the clean aerofoil. For the clean aerofoil, the modified Strouhal number is approximately constant for varying angle of attack, St* = 0.18 ± 0.01 (Rojratsirikul et al. Reference Rojratsirikul, Genc, Wang and Gursul2011), with virtually no effect of Reynolds number in the range of 104 to 105. The dashed lines represent the fundamental and subharmonic of the natural vortex shedding frequency for the NACA0012 aerofoil, fcsin(α)/U∞ = 0.18 and 0.09, respectively. Figure 23 reveals that there is some variation of the modified Strouhal number for some flags, and little variation for some other flags. Nevertheless, most of the data points fall into a band between the fundamental and subharmonic of the natural vortex shedding frequency, suggesting there is some coupling between the flag oscillations and the natural vortex shedding of the aerofoil. Note that the degree of lift enhancement (normalised lift increase) is larger for the data points within the band as long as the post-stall angle of attack is not too small or too large.

Figure 23. Modified Strouhal number based on the projection of the aerofoil chord length as a function of  $(\alpha - {\alpha _{s,c}})$ for NACA0012 aerofoil. Dashed lines correspond to the fundamental and subharmonic of the natural vortex shedding frequency for the clean aerofoil.
3.8. Effect of leading-edge geometry
To understand the effect of the leading-edge shape, we extended the experiments to two other aerofoils: a NACA6409 and a flat plate with a sharp leading edge (see the cross-sections in figure 2c). We observed self-excited flag oscillations on the two aerofoils with similar magnitudes of amplitude for the NACA0012. As an example, figure 24 presents the phase-averaged vorticity fields superimposed with the phase-averaged streamlines and the phase-averaged flag shapes for the flat-plate aerofoil and the nearly rigid flag (μ = 10.0, L/c = 0.2) attached to the leading edge for α = 20°. This is the same flag shown in figure 18 with the NACA0012 aerofoil at the same angle of attack. The flag oscillations have a dominant frequency of f = 50 Hz (St* = 0.12) on the flat-plate aerofoil compared with f = 78 Hz (St* = 0.18) on the NACA0012 aerofoil. The main features of the flow and the flag motion are similar for both aerofoils. The strengthening of the vortex during the upward motion of the flag submerged in totally separated flow is followed by the shedding of the vortex during the downward motion. The reattachment line on the aerofoil surface moves closer to the trailing edge near t′/T = 0.75. The vortex shedding appears to start between t′/T = 0.125 and 0.25.

Figure 24. Phase-averaged vorticity fields superimposed with phase-averaged flag shapes for nearly rigid flag,  $\mu = 10.0$, L/c = 0.2 attached to the flat-plate aerofoil with a sharp leading edge at $\alpha = 20\mathrm{^\circ }$.
A direct comparison of the phase-averaged flag shapes during the upward motion (red solid) and the downward motion (black dashed) as well as the location of the time-averaged shear layer for the corresponding clean aerofoil are shown in figure 25 for the NACA0012 and the flat-plate aerofoil. The flag behaves as if it has a flexible hinge at the leading edge for the NACA0012 aerofoil and this becomes more pronounced when the flag tip is near the aerofoil surface. In contrast, the flag behaves as if it is more like a rigid plate for the flat-plate aerofoil. The flag tip does not get very close to the aerofoil surface compared with the case of the NACA0012 aerofoil. This is likely to be due to the shear layer of the flat-plate aerofoil being located further away from the surface at the same angle of attack. Nevertheless, both cases have qualitatively similar phase-averaged flows.

Figure 25. Phase-averaged flag shapes for the nearly rigid flag,  $\mu = 10.0$, L/c = 0.2 attached to the leading edge of (a) NACA0012, and (b) flat plate with a sharp leading edge, at $\alpha = 20\mathrm{^\circ }$.
Lift force measurements were carried out for the compliant and nearly rigid flags with varying mass ratio and flag length attached to the flat-plate aerofoil and the cambered NACA6409 aerofoil, resulting in plots similar to those in figure 7 for the NACA0012 aerofoil. For brevity these lift curves will not be presented here. In figure 26(a), the variation of the normalised change of maximum lift coefficient CL,max with respect to the lift coefficient of the clean aerofoil CL,c at the same stall angle of attack of  $({\alpha _s})$ is shown as a function of $({\alpha _s} - {\alpha _{s,c}})$. Here, ${\alpha _{s,c}}$ is the stall angle of the clean aerofoil. The corresponding stall angles of the clean aerofoils are ${\alpha _{s,c}} = 12\mathrm{^\circ }$ (CL,max,c = 0.96 for the NACA0012), 14° (CL,max,c = 1.35 for the NACA6409) and 8° (CLmax,c = 0.53 for the flat plate) at this Reynolds number. The data were coloured according to the flag mass ratio $\mu $. For all three aerofoils, significant lift increase (up to approximately 100 %) can be achieved. The best lift enhancement is found for the cambered aerofoil when $({\alpha _s} - {\alpha _{s,c}}) = 6\mathrm{^\circ }$ to 10°, and the mass ratio does not appear to be significant in this range. The maximum lift enhancement decreases when the stall angle with the flag becomes increasingly larger than the stall angle of the clean aerofoil.

Figure 26. (a) Variation of normalised change of maximum lift coefficient with respect to the clean aerofoil at the same angle of attack as a function of  $({\alpha _s} - {\alpha _{s,c}})$, data were coloured according to the flag mass ratio $\mu $; (b) variation of normalised change of maximum lift coefficient with respect to that of the clean aerofoil as a function of flag mass ratio $\mu $, data were coloured according to the change in stall angle $({\alpha _s} - {\alpha _{s,c}})$.
In figure 26(b), the variation of the normalised change of the maximum lift coefficient CL,max with respect to that of the clean aerofoil CL,max,c (the stall angles of the clean aerofoil and that with the flag are not the same) is shown as a function of flag mass ratio  $\mu $. The data were coloured according to the change in the stall angle $({\alpha _s} - {\alpha _{s,c}})$. For all three aerofoils, significant increase of the maximum lift coefficient (up to approximately 60 %) can be achieved. The largest increases are observed for the NACA0012 aerofoil with the nearly rigid and heavy flags, resulting in an increase in the stall angle by nearly 20°. We note that there are many more data points for the NACA0012 aerofoil than for the other two aerofoils. Nevertheless, with increasing mass ratio, there is a trend of increasing maximum lift coefficient and stall angle that can be achieved for the NACA0012 aerofoil, whereas the effect of the mass ratio is not apparent for the other aerofoils. The magnitude of the increase in the maximum lift coefficient is comparable for the flat-plate aerofoil to that of the NACA0012 aerofoil. The increase in the maximum lift coefficient is generally smaller for the cambered NACA6409 aerofoil.
We note that the leading-edge radii may have some effect on the wake evolution. This parameter also affects the flag/outer-flow interaction and the dynamics of the flag. However, the angle between the outer flow and aerofoil surface also depends on the angle of attack and the location of the fixed end of the flag in addition to the leading-edge radii. Therefore, it is difficult to isolate the effect of each parameter. However, we show in the next section that the coupling with the wake instability is the same for the three aerofoils at different angles of attack.
3.9. Coupling of flags with wake
We summarise the present data for all three aerofoils by plotting the modified Strouhal number based on the projection distance of the chord length fcsin(α)/U∞ as a function of the flag mass ratio in figure 27(a) and as a function of  $(\alpha \unicode{x2013}{\alpha _{s,c}})$ in figure 27(b). Again, the dashed lines represent the fundamental and subharmonic of the natural vortex shedding frequency for the clean aerofoils (taken from Rojratsirikul et al. Reference Rojratsirikul, Genc, Wang and Gursul2011). The data symbols were coloured according to the magnitude of the normalised lift increase. In both graphs the modified Strouhal number remains in a band between the fundamental and subharmonic frequency of the wake of the clean aerofoil. Therefore, all these data suggest that there is a coupling between the flag motion and the wake instability. This coupling or resonance with the fundamental and subharmonic of the wake instability and increased lift force are consistent with the mechanism of post-stall flow control proposed by Wu et al. (Reference Wu, Lu, Denny, Fan and Wu1998), wake resonance and lock-in (Karniadakis & Triantafyllous Reference Karniadakis and Triantafyllous1989; Young & Lai Reference Young and Lai2007) and other related investigations.

Figure 27. Modified Strouhal number based on the projection of the aerofoil chord length as a function of (a) flag mass ratio  $\mu $, and (b) $(\alpha - {\alpha _{sc}})$. The data were coloured according to the normalised lift change. Dashed lines represent the fundamental and subharmonic of the natural vortex shedding frequency.
The mass ratio of the best flags that provide the largest normalised lift increase is spread onto the whole range of the flag mass ratio tested. On the other hand, the best post-stall angles of attack that provide the largest normalised lift change are found at an optimal increment from the stall angle of the clean aerofoils. The darkest data symbols are found in the range  $6\mathrm{^\circ } < (\alpha \unicode{x2013}{\alpha _{sc}}) < 12^\circ$, which seems to be the optimum range of angles of attack. Interestingly this suggests that angle of attack is more important than flag mass ratio in producing high lift. With increasing angle of attack, one expects increasing distance between the leading-edge vortices and the aerofoil surface as well as increasing distance between the shear layer of the clean aerofoil and the surface. These factors are likely to contribute to the modifications of the flag–shear layer interaction and affect the lift produced by the leading-edge vortices. The relationship between excitation frequency, effective wake width and natural frequency of the flag in the wake reveals the lock-in mechanism that results in larger lift enhancement.
3.10. Comparison with flags in uniform free stream
The results so far suggest that wake instability acts as an excitation for the flag motion. A comparison of the measured flag frequency with the natural frequency of the flags in the free stream would be interesting. In figure 28, we plot the dimensionless frequency of the flag  $(\,f{L}/{U_\infty })$ as a function of the flag mass ratio for the flags placed in a uniform free stream with red symbols (Taneda Reference Taneda1968; Akcabay & Young Reference Akcabay and Young2012; Goza & Colonius Reference Goza and Colonius2017; Alben Reference Alben2022; Zhang et al. Reference Zhang, Wang and Gursul2022b). The data for the flags in the uniform free stream have a wide range of the bending stiffness KB, which is similar to the range of KB for the compliant flags we tested (between 8.2 × 10⁻⁵ and 3.4 × 10⁻²), however, much smaller compared with the nearly rigid flags (KB = 0.29 to 28.6) in our experiments. The data for flags in a uniform free stream show a reasonable trend with the flag mass ratio. We compare the dimensionless measured frequency of the flag $(\,f{L}/{U_\infty })$ as a function of the flag mass ratio in figure 28 for the compliant and nearly rigid flags attached to the three aerofoils. The data symbols were coloured according to the magnitude of the normalised lift increase. While some flags have closer measured frequency to the natural frequency in the free stream, some others are much further away. Those flags whose oscillation frequency is closer to the natural frequency in the free stream tend to have higher lift enhancement. This suggests that if the excitation frequency (of the wake instability) is close to the natural frequency of the flag, the resonance with the wake leads to higher lift enhancement. This implies that the flag properties, the aerofoil chord length and the angle of attack determine the degree of resonance and coupling between the wake and the flag. This will be demonstrated with a simple reduced-order model below.

Figure 28. Dimensionless flag frequency as a function of mass ratio  $\mu $. The data were coloured according to the normalised change of the lift coefficient.
The dashed red line in figure 28 represents a reduced-order model (Zhang et al. Reference Zhang, Wang and Gursul2022b) for rigid flags that are placed in the free stream and free to roll around its leading edge. The natural frequency is predicted as
 \begin{equation}{f_n}L/{U_\infty } = 0.26/\sqrt \mu .\end{equation}
The model assumes that the equation of the motion of a rigid flat plate free to roll around its leading edge can be written by considering the moment about the leading edge and equating it to the moment of inertia times the angular acceleration
 \begin{equation}({\textstyle{1 \over 3}}{\rho _{\boldsymbol{s}}}h{L^3})\ddot{\theta} = {C_M}{\textstyle{1 \over 2}}{\rho _f}U_\infty ^2{L^2},\end{equation}
where θ is the angular displacement (see figure 29a) and CM is the pitching moment coefficient. For the fully separated flow behind the rigid flag in free stream, Zhang et al. (Reference Zhang, Wang and Gursul2022b) used the free-streamline theory first proposed by Kirchhoff (Reference Kirchhoff1869) and Rayleigh (Reference Rayleigh1876). The linearised solution of (3.9) provides the natural frequency of the rigid flag as in (3.8). (We note that the  ${\mu ^{ - 1/2}}$ dependency of ${f_n}L/{U_\infty }$ was also proposed by Argentina & Mahadevan (Reference Argentina and Mahadevan2005) using the unsteady thin aerofoil theory for small flag displacements, which assumes that the flow remains attached to the flag.) Separated flows over a flag in free stream and near the aerofoil surface have some similarities. Even though flows near the fixed end of the flags are different, this appears to have smaller effect on the frequency of the flag oscillations. This is because the moment arm of the pressure near the fixed end is smaller. We conclude that, at large displacements of the flag attached to an aerofoil, the dimensionless natural frequency of the flag scales as ${\mu ^{ - 1/2}}$.

Figure 29. (a) Schematic of the Kirchhoff–Rayleigh flow; (b) conceptual model of flag and vortex for small  $\theta $; and (c) circulation normalised by free-stream velocity and flag length as a function of angular displacement $\theta $ for the upward-moving flag for compliant and nearly rigid flags attached to the leading edge of a NACA0012 aerofoil at $\alpha = 20\mathrm{^\circ }$.
In contrast, at small displacements when the flag is closest to the aerofoil surface it is fully submerged in separated flows and the restoring counter-rotating moment is due to the strengthening vortex. Hence, we propose that the coupling between the flag and the LEV determines the flag dynamics when the flag is closer to the aerofoil surface. This is conceptualised in figure 29(b) as a vortex near the wall and its image vortex. In this case the induced velocity of the vortex pair replaces the free-stream velocity in (3.9). We assume a restoring moment per unit span in the form of
 \begin{equation}({\textstyle{1 \over 3}}{\rho _s}h{L^3})\ddot{\theta} = {C_M}{\textstyle{1 \over 2}}{\rho _f}{\varGamma ^2},\end{equation}
which can be written as
 \begin{equation}\ddot{\theta} = \frac{{3{C_M}}}{{2\mu }}\left( {\frac{{U_\infty^2}}{{{L^2}}}} \right){\left( {\frac{\varGamma }{{{U_\infty }L}}} \right)^2}.\end{equation}
In figure 29(c), for our experiments, we plot the variation of the dimensionless circulation (Γ/U∞L) as a function of θ (see the definition in the inset). This graph suggests a linear variation with θ, leading to a second-order differential equation with constant coefficients if the pitching moment coefficient is assumed to be constant. It then follows that
 \begin{equation}{f_n}L/{U_\infty } \propto \; {\mu ^{ - 1/2}},\end{equation}
which is a similar functional variation to (3.8) for large deflection angles. In summary, while the natural frequency of the flag is controlled by the flag length L and the mass ratio  $\mu $, the excitation frequency of the wake instability is controlled by the effective wake width csin(α). These parameters determine the degree of resonance and coupling between the wake and the flag.
4. Conclusions
Self-excited oscillations of flags with the fixed end located at the leading edge of the aerofoils were investigated. The interaction of flags with the separated flow over the aerofoil results in quasi-periodic oscillations of flags that produce leading-edge vortices. We present evidence that the flag oscillations are coupled with the wake instability at the post-stall angles of attack for three different aerofoils tested, including one with a sharp leading edge. Previous computational and experimental studies suggest that the wakes of bluff bodies and post-stall aerofoils can resonate (or lock-in) and become more coherent and synchronised when excited at the fundamental and harmonics of the natural vortex shedding. Our findings reveal that flags of varying mass ratio and length oscillate at frequencies which fall in a narrow band, corresponding to the subharmonic and the fundamental frequency of the wake of the clean aerofoils.
For a post-stall angle of attack of α = 20° for the NACA0012 aerofoil, both compliant and nearly rigid flags can have high-amplitude oscillations. The Strouhal number, which represents the ratio of the flag-tip velocity to the free-stream velocity, generally decreases with increasing mass ratio and is larger for the nearly rigid flags. However, both types of flags can achieve similar levels of per cent increase in lift force at α = 20° for a wide range of the mass ratio and the Strouhal number. However, flags with large stiffness generally produce larger maximum lift coefficient and higher stall angle (approaching 30°) compared with the compliant flags as the spatial and temporal coherence of the flag oscillations are much better.
Regardless of the aerofoil profile and the leading-edge shape, there are common features of the coupling of the flag vortices with the flag motion. The circulation of the flag vortices increases linearly with time and becomes maximum when the flag tip is near the maximum displacement from the aerofoil surface. Around this instant flow over the flag resembles the Rayleigh–Kirchhoff flow over an inclined flat plate and provides the restoring moment for the flag. The shedding of the flag vortices also takes place around this time or soon after. When the flag is closest to the aerofoil surface, the flow over the flag is fully separated above and below the flag. Around this instant, the restoring moment is produced by the induced velocity of the growing vortex.
For all aerofoils tested, the best lift enhancement (up to approximately 100 %) was found at an optimal increment from the stall angle of the clean aerofoils,  $({\alpha _s} - {\alpha _{s,c}}) = 6\mathrm{^\circ }$ to 10°, for a wide range of the mass ratio. This is because the distance between the flag-generated vortices and the aerofoil surface increases with increasing angle of attack. An increase of the maximum lift coefficient (up to approximately 60 %) and an increase of the stall angle by nearly 20° are possible. If the excitation frequency (of the wake instability) is close to the natural frequency of the flag, the wake lock-in results in larger lift enhancement. The natural frequency of the flag mainly depends on the flag length L and the mass ratio $\mu $. The excitation frequency of the wake instability is controlled by the effective wake width csin(α). These parameters determine the degree of resonance and coupling between the wake and the flag.
Similar to any other flow control method, other aerodynamic forces and moments should be investigated. For operation in the post-stall regime, high lift is the primary objective, while minimum drag is not typically a consideration (unlike cruise conditions). The drag force was not measured in this investigation. However, as discussed previously (Tan et al. Reference Tan, Wang and Gursul2021), substantial drag reduction is expected based on the time-averaged velocity measurements that reveal smaller velocity defect in the wake. Pitching moment should be investigated in future studies. Excitation near the leading edge for other flow control methods (such as pulsed blowing or synthetic jets) produce periodic leading-edge vortices. The effect of these methods on the pitching moment is expected to be similar to that of the oscillating flags at the leading edge.
Declaration of interests
The authors report no conflict of interest.


