


1. Introduction
Climate change is taking place at an unprecedented pace and its impact is being felt across the world with rising sea levels, severe heat waves and more frequent and intense natural disasters (Letelier et al. Reference Letelier, Ulloa, Leyrer and Ortega2023; Liu et al. Reference Liu, He, Wu, Liu, Zhang, Chen, Shen and Li2023). As one of the most pressing environmental issues, climate change is broadly reported to be caused by human activities such as the burning of fossil fuels and deforestation, which lead to critical emissions and buildup of  $\text {CO}_2$ in the atmosphere (Mac Dowell et al. Reference Mac Dowell, Fennell, Shah and Maitland2017; Zhou, Jin & Luo Reference Zhou, Jin and Luo2020; Ren & Kloker Reference Ren and Kloker2022; Hu, Xu & Yang Reference Hu, Xu and Yang2023). Numerous studies have emphasized the necessity of taking immediate actions to reduce global greenhouse gas emissions (primarily $\text {CO}_2$) to meet the $1.5\,^\circ {\rm C}$ target of the Paris Agreement (Susskind et al. Reference Susskind, Chun, Goldberg, Gordon, Smith and Zaerpoor2020; Solomon Reference Solomon2023). Therefore, various carbon capture technologies have been developed to separate $\text {CO}_2$ from anthropogenic emissions, including chemical absorption, physical adsorption, membrane separation and cryogenic capture (Song et al. Reference Song, Liu, Deng, Li and Kitamura2019; Nocito & Dibenedetto Reference Nocito and Dibenedetto2020; Naquash et al. Reference Naquash, Qyyum, Haider, Bokhari, Lim and Lee2022; Lei et al. Reference Lei, Luo, Hernández Pérez, Wang, Wang, Restrepo Cano and Im2023).
Cryogenic carbon capture (CCC), as an innovative technology, cools the industrial flue gas to cryogenic temperatures (usually below  $-100\,^\circ {\rm C}$) and, thus, desublimates the $\text {CO}_2$ component. Consequently, the desublimated $\text {CO}_2$ is separated in pure from other gas components, based on the difference in their freezing points (bin Ab Halim Reference bin Ab Halim2013; Maqsood et al. Reference Maqsood, Mullick, Ali, Kargupta and Ganguly2014). This desublimation-based CCC offers several benefits, including high capture efficiency, low chemical usage and flexible application, which make it hold significant application perspectives and research interests (Babar et al. Reference Babar, Bustam, Ali and Maulud2018, Reference Babar, Mukhtar, Mubashir, Saqib, Ullah, Quddusi, Bustam and Show2021; Font-Palma, Cann & Udemu Reference Font-Palma, Cann and Udemu2021). Although CCC has been successfully tested in several pilot projects, it is still in the nascent stage of commercial applications due to some operational challenges (Pan, Clodic & Toubassy Reference Pan, Clodic and Toubassy2013; Gallucci & van Sint Annaland Reference Gallucci and van Sint Annaland2015). For example, cooling flue gas to extremely low temperatures requires a significant amount of energy, which may make CCC less cost effective than other mature technologies (i.e. chemical absorption and physical adsorption). Low temperatures also have the tendency to cause equipment corrosion. Additionally, inappropriate gas feed rates and heat exchanger units pose risks, such as gas breakthrough, flow channel plug and even premature termination of CCC. Therefore, to address these operational concerns and improve the commercial feasibility of CCC, it is essential to conduct an in-depth investigation of the multiphysics and desublimation kinetics behind CCC.
During the operation of the desublimation-based CCC, the flue gas, containing multiple components, flows unsteadily through the void channels among heat exchangers. As the flue gas is cooled and the heat exchanger is heated,  $\text {CO}_2$ is first desublimated and then partially sublimated (Debnath et al. Reference Debnath, Mukherjee, Mullick, Ghoshdastidar, Ganguly and Kargupta2019). The intensity of $\text {CO}_2$ desublimation and sublimation determines the $\text {CO}_2$ capture capacity and efficiency of CCC. Therefore, the control of these two aspects (i.e. $\text {CO}_2$ desublimation and sublimation) is vital in the development of an effective CCC. However, the problem of $\text {CO}_2$ desublimation and sublimation during CCC incorporates multiple and fully coupled physics, i.e. fluid dynamics, mass transfer mechanisms, conjugate heat transfer between the gas and solid phases, desublimation and sublimation kinetics and solid phase evolutions (Lei et al. Reference Lei, Luo, Hernández Pérez, Wang, Wang, Restrepo Cano and Im2023).
To understand such a complex problem, experiments have been designed and conducted. Tuinier et al. (Reference Tuinier, van Sint Annaland, Kramer and Kuipers2010) proposed a novel CCC system using a dynamically operated packed bed. The carbon capture capacity of the system was experimentally investigated for  $\text {N}_2/\text {CO}_2$ mixtures at atmospheric pressure. However, this system applied a single bed and worked in a discontinuous cycle of three steps: cooling, capture and recovery. To achieve the continuous capture of $\text {CO}_2$, they further created a CCC system comprising three beds to operate the three steps in parallel (Tuinier, Hamers & van Sint Annaland Reference Tuinier, Hamers and van Sint Annaland2011a; Tuinier, van Sint Annaland & Kuipers Reference Tuinier, van Sint Annaland and Kuipers2011b; Tuinier & van Sint Annaland Reference Tuinier and van Sint Annaland2012). Their experiments showed that a lower initial bed temperature and a higher $\text {CO}_2$ concentration could reduce the operating cost. For example, the 5 % $\text {CO}_2$ case yielded a cost of $95.7/ $\text {ton}_{\text {CO}_2}$, which decreased notably to $59.8/ $\text {ton}_{\text {CO}_2}$ for the 10 % $\text {CO}_2$ case. In addition, compared with two competing technologies (i.e. amine absorption and membrane separation), the improved CCC was shown to be the preferred option if a cold source was available at low costs. Nevertheless, these CCC systems were designed to purify flue gases with relatively low $\text {CO}_2$ contents (i.e. up to 30 % $\text {CO}_2$), and their operations were constrained to the atmospheric pressure. Taking this into account, Ali et al. (Reference Ali, Maqsood, Syahera, Shariff and Ganguly2014, Reference Ali, Maqsood, Redza, Hii, Shariff and Ganguly2016) used the multiple cryogenic desublimation based pipeline network to achieve the removal of $\text {H}_2\text {O}$ and $\text {CO}_2$ from the natural gas under high $\text {CO}_2$ concentrations and high pressures (i.e. up to 100 % $\text {CO}_2$ and 20 bar).
Another CCC system based on commercial Stirling coolers (SCs) was developed for gas cooling,  $\text {CO}_2$ desublimation and $\text {CO}_2$ capture, in which multiple SCs were applied to serve as heat exchangers (Song et al. Reference Song, Kitamura, Li and Ogasawara2012b; Song, Kitamura & Li Reference Song, Kitamura and Li2012a; Song et al. Reference Song, Kitamura, Li and Jiang2013; Song, Kitamura & Li Reference Song, Kitamura and Li2014). After extensive experiments on cooling fins of $15\, {\rm mm}$ length, they suggested the gas feed rate of $2\,{\rm L}\,{\rm min}^{-1}$ and the SC temperature of $-20\,^\circ {\rm C}$ for the gas cooling stage to obtain the optimal performance (i.e. 85 % $\text {CO}_2$ recovery at $3.4\,{\rm MJ}\,{\rm kg}_{\text {CO}_2}^{-1}$). Due to the cost and difficulty in achieving extremely low temperatures (i.e. below $-100\,^\circ {\rm C}$), however, optimal operating conditions for the $\text {CO}_2$ desublimation stage were not determined. In addition to these fixed-bed or fixed-SC CCC systems, the moving-bed CCC system was recently proposed (Willson et al. Reference Willson, Lychnos, Clements, Michailos, Font-Palma, Diego, Pourkashanian and Howe2019; Cann, Font-Palma & Willson Reference Cann, Font-Palma and Willson2021a,Reference Cann, Font-Palma and Willsonb; Font-Palma Reference Font-Palma2021). The packed bed applied moving packing materials to continuously remove materials covered by desublimated $\text {CO}_2$, thus realizing the continuous capture of $\text {CO}_2$ without introducing multiple packed beds. Experiments were carried out to determine an adequate bed velocity and optimize the carbon capture behaviours.
In these existing experiments, the feasibility of various CCC concepts has been validated and the  $\text {CO}_2$ capture performance has been assessed for different operating conditions. Nevertheless, due to the significant operational expenses, only a narrow range of operating parameters were examined in experiments. In light of this limitation, numerical simulations were performed at the same time to investigate the performance of CCC for extensive operating conditions. Tuinier et al. (Reference Tuinier, van Sint Annaland, Kramer and Kuipers2010, Reference Tuinier, Hamers and van Sint Annaland2011a) proposed a one-dimensional (1-D) pseudo-homogeneous model to simulate the desublimation and sublimation of $\text {CO}_2$. By comparing with experiments, they determined the mass transfer rate constant for $\text {CO}_2$ desublimation and sublimation. Their numerical results confirmed the experimental observation that the desublimation of $\text {CO}_2$ raised the bed temperature to an equilibrium level of $-(93\unicode{x2013}98)\,^\circ {\rm C}$. They also demonstrated that an initial bed temperature above the threshold of $-120\,^\circ {\rm C}$ could exponentially reduce the amount of $\text {CO}_2$ captured (Tuinier et al. Reference Tuinier, van Sint Annaland and Kuipers2011b). For instance, for a fed mixture with 10 % $\text {CO}_2$, the increased bed temperature from $-120\,^\circ {\rm C}$ to $-110\,^\circ {\rm C}$ could diminish the recovered $\text {CO}_2$ from 90 % to 12 %. By introducing a new mass transfer scheme, this 1-D model was improved to consider both the $\text {CO}_2$ desublimation on the gas–solid interface and the $\text {CO}_2$ nucleation inside the gas phase (Debnath et al. Reference Debnath, Mukherjee, Mullick, Ghoshdastidar, Ganguly and Kargupta2019). This improved model was able to evaluate the $\text {CO}_2$ capture capacity, predict operating risks (e.g. chocking), and identify the saturation point between capture and recovery steps. This 1-D model was recently extended to consider the energy balance for moving heat exchangers (Cann & Font-Palma Reference Cann and Font-Palma2023).
On the other hand, a two-dimensional (2-D) quasi-steady model was developed to solve the heat and mass transfer during the desublimation and sublimation of  $\text {CO}_2$ (Song et al. Reference Song, Kitamura, Li and Ogasawara2012b,Reference Song, Kitamura and Lia). The frosted $\text {CO}_2$ layer was found to enhance the heat resistance and increase the frost surface temperature. For instance, as the frost thickness increased from $0\, {\rm mm}$ to $3\, {\rm mm}$, the thermal conductivity of frost escalated from 0 to $0.4\, {\rm W}\,{\rm mK}^{-1}$ and the temperature rose from $-106.3\,^\circ {\rm C}$ to $-98\,^\circ {\rm C}$ (Song et al. Reference Song, Kitamura, Li and Jiang2013). This 2-D model was then advanced to consider heat integration, membrane capture, pressure recovery and cold thermal energy utilization units, showing the decreased energy consumption of these improved CCC systems (Song et al. Reference Song, Liu, Ji, Deng, Zhao and Kitamura2017a,Reference Song, Liu, Ji, Deng, Zhao, Li and Kitamurab; Sun et al. Reference Sun, Tian, Song, Deng, Shi, Kang and Shu2021). It is emphasized that the above 1-D and 2-D models were based on a unified velocity profile and ignored impacts of the unsteady gas flow. Consequently, a 1-D transient model was proposed to reveal the detailed $\text {CO}_2$ desublimation characteristics, with the unsteady gas flow, mass transfer and energy conservation being included (Wang et al. Reference Wang, Pfotenhauer, Zhi, Qiu and Li2018a). The model was validated by experimental data and exhibited improved accuracy when incorporating the desublimated solid $\text {CO}_2$ layer (SCL) in an annular tube. In addition, the lower gas feed rate and the higher $\text {CO}_2$ concentration were found to yield the higher carbon capture rate (e.g. the $\text {CO}_2$ capture rate was upgraded from 40 % for $1800\,{\rm ml}\,{\rm s}^{-1}$ to 100 % for $300\, {\rm ml}\,{\rm s}^{-1}$).
These existing models have simulated the desublimation and sublimation properties of  $\text {CO}_2$, and evaluated the carbon capture performance of CCC for a certain range of operating conditions. Despite these achievements, the limitations of either 1-D or quasi-steady assumptions make existing models inadequate in capturing the multiple physics and complex interactions behind CCC. In addition, these existing models were constructed on volume-averaged scales. As a result, intricate structures of the desublimated $\text {CO}_2$ at the pore scale were ignored, conjugate heat transfer between the gas and solid phases was simplified, the random growth and consumption of desublimated $\text {CO}_2$ were neglected, and the porous structure of the packed bed was disregarded. Furthermore, in previous numerical studies, heat and mass transfer coefficients were estimated by empirical correlations, the accuracy of which depends on a prior pore-scale knowledge base (Xu et al. Reference Xu, Long, Jiang, Ma, Zan, Ma and Shi2018a,Reference Xu, Long, Jiang, Zan, Huang, Chen and Shib, Reference Xu, Dai, Yang, Liu and Shi2022). Therefore, a pore-scale model is crucial for a comprehensive study of $\text {CO}_2$ desublimation and sublimation during CCC, which is currently missing.
Over the past three decades, the lattice Boltzmann (LB) method has been extensively developed for simulating complex fluid flows with phase change and chemical reactions at the pore scale (Li et al. Reference Li, Luo, Kang, He, Chen and Liu2016; Lei, Luo & Wu Reference Lei, Luo and Wu2019; Chen et al. Reference Chen, He, Zhao, Kang, Li, Carmeliet, Shikazono and Tao2022; Sawant, Dorschner & Karlin Reference Sawant, Dorschner and Karlin2022). Accordingly, there exist plentiful LB models for separately investigating the multiple physics behind  $\text {CO}_2$ desublimation and sublimation at the pore scale, including the unsteady fluid flow (Wang et al. Reference Wang, Sui, Salsac, Barthès-Biesel and Wang2018b; Shi, Wu & Shan Reference Shi, Wu and Shan2021; Li & Shan Reference Li and Shan2023), species transport (Sawant, Dorschner & Karlin Reference Sawant, Dorschner and Karlin2021), conjugate heat transfer (Karani & Huber Reference Karani and Huber2015; He et al. Reference He, Liu, Li and Tao2019), reactive fluid–solid interface (Zhang et al. Reference Zhang, Shi, Guo, Chai and Lu2012, Reference Zhang, Zhang, Zhang, Zhang, Yao, Sun and Yang2019) and solid structure evolution (Chen et al. Reference Chen, Kang, Carey and Tao2014, Reference Chen, Zhang, Kang and Tao2020). However, the combination and interactions of these complex physics have not been achieved by a single LB model, which is indeed challenging.
To fill this gap, we recently formulated a pore-scale CCC modelling framework based on the LB method, incorporating the unsteady gas flow, conjugate heat transfer, desublimation kinetics and solid  $\text {CO}_2$ generation (Lei et al. Reference Lei, Luo, Hernández Pérez, Wang, Wang, Restrepo Cano and Im2023). The model was successfully applied to identify different $\text {CO}_2$ desublimation regimes, albeit constrained to a single packing material and fixed packing temperatures. In this work, the LB model is extended to incorporate both $\text {CO}_2$ desublimation and sublimation in a packed bed, considering the consumption of solid $\text {CO}_2$ as the packed bed is heated. By evaluating the carbon capture performance for different operating conditions, this study aims to improve the understanding of CCC and shed light on the optimal operating conditions.
2. Physical and mathematical models
The operation of CCC in a packed bed is schematically depicted in figure 1(a), which follows a circle of three steps: cooling, capture and recovery (Tuinier et al. Reference Tuinier, van Sint Annaland and Kuipers2011b; Ali et al. Reference Ali, Maqsood, Syahera, Shariff and Ganguly2014; Babar et al. Reference Babar, Mukhtar, Mubashir, Saqib, Ullah, Quddusi, Bustam and Show2021). During the cooling step, a refrigerant (e.g. refrigerated  $\text {N}_2$, cleaned flue gas, evaporated liquified natural gas) feeds into the packed bed and cools packing materials below the freezing point of $\text {CO}_2$. The refrigerant exits the bed after the cooling process, and it can either be released into the atmosphere or recycled to the bed inlet via a cooler. Then, the CCC system enters the capture step and the feed is switched to the warm flue gas. In the cooled packed bed the component $\text {CO}_2$ is desublimated and a front of the desublimated $\text {CO}_2$ (or desublimation front, $l_d$) is formed. Meanwhile, as the packing grains are heated by the warm flue gas, previously desublimated $\text {CO}_2$ is sublimated to form a sublimation front ( $l_s$) behind $l_d$. Once the fed $\text {CO}_2$ starts to leave the bed outlet, the packed bed becomes saturated and the recovery step begins. The feed is changed to the warm $\text {CO}_2$ gas, which promotes the continuous sublimation of solid $\text {CO}_2$. The sublimated $\text {CO}_2$ exits the bed and is collected for cycling or subsequent applications. Once all the solid $\text {CO}_2$ is recovered, the CCC system returns to the cooling step. The $\text {CO}_2$ capture and recovery steps usually have a longer duration compared with the cooling period.

Figure 1. The schematic descriptions of (a) the operation of CCC in a packed bed and (b) the underlying multiple physics.
In the cooling step, CCC is dominated by the heat transfer between the refrigerant and the packing materials, with no separation of  $\text {CO}_2$ being introduced. During the following capture and recovery of $\text {CO}_2$, the more complex and fully coupled multiphysics takes part and must be considered. On the one hand, the multicomponent gas flow in channels and conjugate heat transfer between the gas and solid phases (i.e. solid packing materials and solid $\text {CO}_2$) are introduced. On the other hand, the desublimation and sublimation of $\text {CO}_2$ take place and modify the solid structure, multicomponent gas flow and gas compositions. Meanwhile, $\text {CO}_2$ desublimation and sublimation are exothermic and endothermic, respectively, thus affecting the heat transfer. Such changes in the local $\text {CO}_2$ composition and temperature, in turn, control the desublimation and sublimation rates. Therefore, the multicomponent gas flow, conjugate heat transfer, solid structure evolution and desublimation and sublimation kinetics are fully coupled. The interactions of these multiple physics are sketched in figure 1(b). Considering that the $\text {CO}_2$ capture performance of CCC is mainly determined by the desublimation and sublimation of $\text {CO}_2$, this study focuses on the capture and recovery steps.
Before constructing governing equations for describing the desublimation and sublimation of  $\text {CO}_2$ during CCC at the pore scale, some simplifications and assumptions are made as follows: (1) this work investigates the capture and recovery of $\text {CO}_2$ without detailing the cooling of packing materials; (2) the flue gas, treated as a mixture of $\text {CO}_2$ and $\text {N}_2$, obeys the ideal gas law and is incompressible and neutrally buoyant; (3) Fick's law is applied to describe the species mass diffusion; (4) the mass transfer rate of $\text {CO}_2$ desublimation and sublimation is proportional to the local deviation from the gas–solid equilibrium; (5) physical properties of the gas and the solid phases are set as constants in relation to the initial condition; and (6) a cryogenic bed packed with multiple grains of a uniform diameter is considered, the movement of packing grains are neglected, and the bed porosity equals the experimental value (Ali et al. Reference Ali, Maqsood, Syahera, Shariff and Ganguly2014).
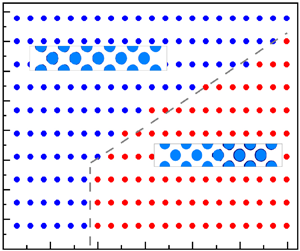
Under these premises, a sample cryogenic packed bed with porosity  $\psi$ is depicted in figure 2(a). The computational domain is $0 \leq x \leq l_x$ and $0 \leq y \leq l_y$, wherein a staggered array of circular grains with a uniform diameter $d$ is encompassed. From the bed inlet, the incompressible flue gas is injected at temperature $T_0$, pressure $p_0$ and velocity $\boldsymbol {u}_0$. Initially, the flue gas consists of $\text {CO}_2$ and $\text {N}_2$, having mass fractions $Y_0$ and $(1-Y_0)$, respectively. The temperature of packing grains is set to $T_{w}$ at first, which is above the freezing point of $\text {N}_2$ but below that of $\text {CO}_2$. Hence, after injection, $\text {N}_2$ flows through the domain without phase change, while $\text {CO}_2$ is partially desublimated to form an SCL on the surface of the packing grains. The $\text {CO}_2$ desublimation is exothermic and expressed as
 \begin{equation} \text{CO}_2\left(g\right) \rightarrow \text{CO}_2\left(s\right) + Q_d. \end{equation}
Here,  $Q_d$ is the heat released from $\text {CO}_2$ desublimation, and the gas and solid phases of $\text {CO}_2$ are denoted by $g$ and $s$, respectively.

Figure 2. The schematic diagrams of (a) the cryogenic packed bed for simulation and (b)  $\text {CO}_2$ desublimation and sublimation on a single packing grain at the pore scale.
Due to the exothermic desublimation process and the heat transfer between the gas stream and solid packing grains, the temperature of the solid phases is locally raised to the freezing point of  $\text {CO}_2$. Consequently, the captured SCL starts to sublimate as
 \begin{equation} \text{CO}_2\left(s\right) + Q_s \rightarrow \text{CO}_2\left(g\right). \end{equation}
Both the  $\text {CO}_2$ desublimation and the incoming warm flue gas contribute to the heat $Q_s$ for sublimation.
For such desublimation and sublimation processes, the mass transfer rate between the gaseous  $\text {CO}_2$ and the solid $\text {CO}_2$ is estimated as (Tuinier et al. Reference Tuinier, van Sint Annaland, Kramer and Kuipers2010; Debnath et al. Reference Debnath, Mukherjee, Mullick, Ghoshdastidar, Ganguly and Kargupta2019)
 \begin{equation} m_r = \begin{cases} k_r \left( y_i p - p_e \right) & \text{if} \ \left(y_i p > p_e, y_i > 0\right),\\ k_r \left( y_i p - p_e \right)A & \text{if} \ \left(y_i p < p_e, A = \dfrac{m_i}{m_i+0.1} > 0\right),\\ 0 & \text{if} \ \{ \left(y_i p > p_e, \ y_i = 0\right) \ \text{or} \ \left(y_i p < p_e, A = 0\right)\}. \end{cases} \end{equation}
Depending on the sign of  $m_r$, either $\text {CO}_2$ desublimation ( $m_r>0$) or $\text {CO}_2$ sublimation ( $m_r<0$) occurs. Here, $k_r$ is the mass desublimation rate constant, $m_i$ is the mass of desublimated ${\text {CO}_2}$ per unit volume and $p$ is the flue gas pressure. The mole fraction of ${\text {CO}_2}$ is calculated as
 \begin{equation} y_i =\frac{M}{M_{\text{CO}_2}}Y, \quad \text{with}\ \frac{1}{M} = \frac{Y}{M_{\text{CO}_2}}+\frac{1-Y}{M_{\text{N}_2}}, \end{equation}
where  $Y$ is the mass fraction of $\text {CO}_2$ in the flue gas. Here $M$,
$M$,  $M_{\text {CO}_2}$ and $M_{\text {N}_2}$ are molecular weights of the flue gas, $\text {CO}_2$ and $\text {N}_2$, respectively. In (2.3), for the mass transfer rate $m_r$, the equilibrium pressure between the gas and the solid phases corresponding to the local temperature $T$ is determined by an empirical correlation as (Tuinier et al. Reference Tuinier, van Sint Annaland, Kramer and Kuipers2010)
 \begin{equation} p_e = \exp\left(10.257 - \frac{3082.7}{T}+4.08\ln T-2.2658\times 10^{{-}2}T\right). \end{equation}
The units of  $p_e$ and $T$ are Pascal ( $\mbox {Pa}$) and Kelvin ( $\mbox {K}$), respectively.
From the desublimation and sublimation processes, the released heat  $Q_d$ and the absorbed heat $Q_s$ are calculated as
 \begin{equation} Q_{d, s} = m_ra_rh_r, \end{equation}
with  $h_r$ being the enthalpy change of $\text {CO}_2$ desublimation and $a_r$ being the specific surface area per unit volume. Details on the calculation of $a_r$ and its sensitivity are provided in the supplementary material available at https://doi.org/10.1017/jfm.2024.351. By using (2.6), either $Q_d$ for desublimation ( $m_r>0$) or $Q_s$ for sublimation ( $m_r<0$) can be calculated. During $\text {CO}_2$ desublimation and sublimation, the pore structure of the solid phases changes with the generation and consumption of SCL on the surface of the packing grains. This structure evolution is tracked by the mass balance equation for the solid $\text {CO}_2$ as (Kang et al. Reference Kang, Chen, Valocchi and Viswanathan2014)
 \begin{equation} \rho_s \partial_t V_s = m_r a_r V_r, \end{equation}
where  $V_s$ and $\rho _s$ represent the volume and density of solid $\text {CO}_2$, respectively, and $V_r$ is the active volume for desublimation.
From the mass transfer scheme in (2.3), the following three scenarios may occur at the interface between the gas and solid phases  $I$.
$I$.
(i) At the interface $I_d$, the partial pressure and mass fraction of the component $\text {CO}_2$ satisfy the criterion ($y_i p > p_e$, $y_i>0$). So, $m_r$ is positive (i.e. $m_r>0$) and $\text {CO}_2$ desublimation takes place. During this process, gaseous $\text {CO}_2$ is consumed, heat $Q_d$ is released and SCL is generated.
(ii) At the interface
$I_s$ satisfying the criterion ($y_i p < p_e$, $A>0$), $m_r$ becomes less than 0 (i.e. $m_r<0$) and SCL is sublimated to produce gaseous $\text {CO}_2$. Such a process brings about the generation of gaseous $\text {CO}_2$, the absorption of heat $Q_s$ and the consumption of the SCL.(iii) At the interface
$I_n$ with ($y_i p > p_e$, $y_i=0$) or ($y_i p < p_e$, $A=0$), $m_r$ equals 0. Thus, neither the desublimation nor sublimation of $\text {CO}_2$ happens.


Note that the calculation of  $m_r$ in (2.3) can be conveniently replaced by other expressions if necessary. In this study, $I_{d, s}$ (i.e. $I_d$ and $I_s$) and $I_n$ are referred to as active and inactive boundaries, respectively.
Based on the above assumptions and definitions, a set of governing equations is built up to model the desublimation and sublimation of  ${\text {CO}_2}$ during CCC at the pore scale. That includes the continuity equation (2.8), the incompressible Navier–Stokes equation (2.9) and the component conservation equation (2.10) for the flue gas stream in flow paths, as well as the energy balance equation (2.11) for heat transfer in both flow paths (i.e. flue gas) and solid phases (i.e. solid packing materials and solid $\text {CO}_2$). These equations are expressed as follows:
 \begin{gather} \boldsymbol{\nabla} \boldsymbol{\cdot} \boldsymbol{u} = 0, \end{gather}
 \begin{gather} \rho_g \frac{\partial \boldsymbol{u}}{\partial t} + \rho_g \boldsymbol{\nabla} \boldsymbol{\cdot} \left(\boldsymbol{u}\boldsymbol{u} \right) ={-}\boldsymbol{\nabla} p + \rho_g \boldsymbol{\nabla} \boldsymbol{\cdot} \left( \nu \boldsymbol{\nabla}\boldsymbol{u} \right), \end{gather}
 \begin{gather} \frac{\partial Y}{\partial t} + \boldsymbol{\nabla} \boldsymbol{\cdot} \left( Y \boldsymbol{u}\right) = \boldsymbol{\nabla} \boldsymbol{\cdot} \left( D \boldsymbol{\nabla} Y \right), \end{gather}
 \begin{gather} \frac{\partial }{\partial t} \left( \rho c_p T \right) + \boldsymbol{\nabla} \boldsymbol{\cdot} \left(\rho c_p T\boldsymbol{u}\right) = \boldsymbol{\nabla} \boldsymbol{\cdot} \left( \rho c_p \alpha \boldsymbol{\nabla} T \right) + Q. \end{gather}
Here,  $\boldsymbol {u}=(u,\ v)$, $\rho _g$ and $\nu$ are the gas velocity, density and kinematic viscosity, respectively; $t$ is the time and $D$ is the diffusion coefficient of $\text {CO}_2$; $\rho$, $c_p$ and $\alpha$ are the local density, specific heat capacity at constant pressure and thermal diffusivity, respectively. The heat $Q$ can be either the released desublimation heat $Q_d$ or the absorbed sublimation heat $Q_s$.
The desublimation and sublimation of  $\text {CO}_2$ take place at the active gas–solid interface $I_d$ and $I_s$, respectively. Such processes are described by boundary conditions as
 \begin{gather} \boldsymbol{u}^{I_{d,s}} = \left( 0, 0 \right), \end{gather}
 \begin{gather} \boldsymbol{n}\boldsymbol{\cdot} D \rho_g \boldsymbol{\nabla} Y^{I_{d,s}} = m_r, \end{gather}
 \begin{gather} \left. \begin{gathered} T^{I_{d, s},+} =T^{I_{d, s},-}, \\ \boldsymbol{n} \boldsymbol{\cdot} \left(k \boldsymbol{\nabla} T +\rho c_p \boldsymbol{u} T \right)^{I_{d, s},+} = \boldsymbol{n} \boldsymbol{\cdot} \left(k \boldsymbol{\nabla} T +\rho c_p \boldsymbol{u} T \right) ^{I_{d, s},-} + q. \end{gathered} \right\} \end{gather}
In the above equations,  $\boldsymbol {n}$ is the interface normal pointing to the gas phase, $+$ and $-$ denote parameters on either side of $I_{d, s}$, $k=\alpha \rho c_p$ is the thermal conductivity and $q$ is the heat flux caused by $\textrm {CO}_2$ desublimation or sublimation.
In order to model  $\textrm {CO}_2$ desublimation and sublimation using the LB method, the above physical parameters are converted to those in lattice units. For this purpose, dimensionless parameters are derived to act as the conversion criteria between the two systems of units. By introducing the characteristic length $L$, velocity $U$, temperature $T_{ch}$ and density $\rho _g$, dimensionless parameters marked by asterisks are derived as
 \begin{equation} \left. \begin{gathered}
\boldsymbol{x}^* = \frac{\boldsymbol{u}}{L}, \quad t^* =
\frac{t}{L/U}, \quad \boldsymbol{u}^* =
\frac{\boldsymbol{u}}{U}, \quad \rho^* =
\frac{\rho}{\rho_g}, \quad p^* = \frac{p}{\rho_g U^2},\\
\quad T^* = \frac{T}{T_{ch}}, \quad m_r^* = \frac{m_r}{\rho_gU},\\
h_r^* = \frac{h_r}{c_{p,g}T_{ch}},
\quad k_r^* = k_rU, \quad Re =
\frac{LU}{\nu}, \quad Pe = \frac{LU}{D},\\
\quad Pr = \frac{\nu}{\alpha_g},\quad
\Delta T_s = \frac{T_f-T}{T_{ch}}. \end{gathered}
\right\}
\end{equation}
\begin{equation} \left. \begin{gathered}
\boldsymbol{x}^* = \frac{\boldsymbol{u}}{L}, \quad t^* =
\frac{t}{L/U}, \quad \boldsymbol{u}^* =
\frac{\boldsymbol{u}}{U}, \quad \rho^* =
\frac{\rho}{\rho_g}, \quad p^* = \frac{p}{\rho_g U^2},\\
\quad T^* = \frac{T}{T_{ch}}, \quad m_r^* = \frac{m_r}{\rho_gU},\\
h_r^* = \frac{h_r}{c_{p,g}T_{ch}},
\quad k_r^* = k_rU, \quad Re =
\frac{LU}{\nu}, \quad Pe = \frac{LU}{D},\\
\quad Pr = \frac{\nu}{\alpha_g},\quad
\Delta T_s = \frac{T_f-T}{T_{ch}}. \end{gathered}
\right\}
\end{equation}
The subscript  $g$ refers to physical properties of the flue gas and $T_f$ is the freezing temperature of $\textrm {CO}_2$. From such a dimensionless derivation, key characteristic numbers are obtained: the Reynolds number $Re $, the Péclet number $Pe $, the Prandtl number $Pr $ and the subcooling degree $\Delta T_s$. In LB simulations a match of these dimensionless variables ensures the same desublimation and sublimation characteristics between the lattice space and the real physical space.
3. Numerical method
The LB method is applied to solve the conservation equations (2.8)–(2.11) in two dimensions. Considering the porous structure of the packed bed, the multiple-relaxation-time (MRT) LB method is employed to avoid the unphysical dependence of permeability on viscosity at the pore scale (Pan, Luo & Miller Reference Pan, Luo and Miller2006). To enforce the boundary conditions in (2.12)–(2.14) for  $\textrm {CO}_2$ desublimation and sublimation, LB boundary schemes are developed. Furthermore, the volume-of-pixel (VOP) method is adopted to treat the evolution of solid $\textrm {CO}_2$ in (2.7) (Kang, Lichtner & Zhang Reference Kang, Lichtner and Zhang2006; Wang et al. Reference Wang, Han, Wang, Ma and Wang2019; Lei & Luo Reference Lei and Luo2021).
3.1. The MRT LB models
Since the flue gas and the solid phases have different thermophysical properties, the energy conservation equation (2.11) is recast as
 \begin{equation} \partial_t T + \boldsymbol{\nabla} \boldsymbol{\cdot} \left( T \boldsymbol{u} \right) = \boldsymbol{\nabla} \boldsymbol{\cdot} \left( \alpha \boldsymbol{\nabla} T \right) + F_{T}, \end{equation}
with the source term  $F_T$ being
 \begin{align} F_{T}=F_{T1}+F_{T2}, \quad F_{T1} = \frac{Q}{\rho c_p}, \quad F_{T2} = \frac{1}{\rho c_p}\boldsymbol{\nabla}\left( \rho c_p \right)\boldsymbol{\cdot} \left( \alpha \boldsymbol{\nabla} T - T \boldsymbol{u} \right) - \frac{T}{\rho c_p} \partial_t \left(\rho c_p\right). \end{align}
More details on this derivation can be found in our earlier work (Lei, Wang & Luo Reference Lei, Wang and Luo2021).
To solve the gas flow ((2.8)–(2.9)), species transport (2.10) and heat transfer (3.1), three sets of LB evolution equations are built as follows (Lei & Luo Reference Lei and Luo2019; Lei et al. Reference Lei, Luo, Hernández Pérez, Wang, Wang, Restrepo Cano and Im2023):
 $$\begin{gather} f_i \left( \boldsymbol{x} + \boldsymbol{e}_i \delta _t, t + \delta _t \right) - f_i \left( \boldsymbol{x}, t \right) ={-}\left( {{\boldsymbol{\mathsf{M}}}}^{{-}1} {{\boldsymbol{\mathsf{S}}}} {{\boldsymbol{\mathsf{M}}}} \right)_{ij} \left[ f_j \left( \boldsymbol{x}, t \right) - f_j ^{eq} \left( \boldsymbol{x}, t \right) \right], \end{gather}$$
 $$\begin{gather}g_i \left( \boldsymbol{x} + \boldsymbol{e}_i \delta _t, t + \delta _t \right) - g_i\left( \boldsymbol{x}, t \right) ={-} \left( {{\boldsymbol{\mathsf{M}}}}^{{-}1} {{\boldsymbol{\mathsf{S}}}}_y {{\boldsymbol{\mathsf{M}}}} \right)_{ij} \left[ g_j \left( \boldsymbol{x}, t \right) - g_j ^{eq} \left( \boldsymbol{x}, t \right) \right], \end{gather}$$
 $$\begin{gather}h_i \left( \boldsymbol{x} + \boldsymbol{e}_i \delta _t, t + \delta _t \right) - h_i\left( \boldsymbol{x}, t \right) ={-} \left( {{\boldsymbol{\mathsf{M}}}}^{{-}1} {{\boldsymbol{\mathsf{S}}}}_t {{\boldsymbol{\mathsf{M}}}} \right)_{ij} \left[ h_j \left( \boldsymbol{x},\ t \right) - h_j ^{eq} \left( \boldsymbol{x},\ t \right) \right] \nonumber\\+ \delta _t \bar{F}_{T,i} + \frac{\delta _t^ 2}{2}\frac{\partial \bar{F}_{T,i}}{\partial t}. \end{gather}$$
Here  $i$ and $j$ are discrete directions. For fluid moving with the discrete velocity $\boldsymbol {e}_i$ at position $\boldsymbol {x}$ and time $t$,
$t$,  $f_i(\boldsymbol {x}, t)$, $g_i(\boldsymbol {x},t)$ and $h_i(\boldsymbol {x},t)$ are their distribution functions of the hydrodynamic, $\textrm {CO}_2$ mass fraction and temperature fields, respectively. Here $f_i^{eq}$, $g_i^{eq}$ and $h_i^{eq}$ are the equilibrium distribution functions; $\bar {F}_{T,i}$ is the distribution function for the thermal source term $F_T$; ${{\boldsymbol{\mathsf{S}}}}$, ${{\boldsymbol{\mathsf{S}}}}_y$ and ${{\boldsymbol{\mathsf{S}}}}_t$ are the diagonal relaxation matrices, whereas ${{\boldsymbol{\mathsf{M}}}}$ is the transformation matrix to map distribution functions from the physical space to the moment space. The time derivatives in (3.2a–c) ( $\partial _t \rho c_p$) and (3.5) ( $\partial _t \bar {F}_{T,i}$) are treated with a backward difference scheme.
At each time step, after the above evolutions, the macroscopic variables are calculated as
 \begin{equation} \rho_p=\sum_{i}{f_i}, \quad \rho_g\boldsymbol{u}=\sum_i{\boldsymbol{e}_i f_i}, \quad Y =\sum_{i}{g_i}, \quad T =\sum_{i}{h_i}. \end{equation}
Here,  $\rho _p$ is a variable related to the gas pressure as $\rho _p= p / c_s^2$; $c_s = e/ \sqrt {3}$ is the lattice sound speed and $e=\delta _x/\delta _t$ is the lattice speed; $\delta _x$ and $\delta _t$ denote the lattice spacing and time step, respectively.
3.2. The LB boundary scheme for $\textrm {CO}_2$ desublimation and sublimation

For the active gas–solid interface  $I_{d,s}$ with $\textrm {CO}_2$ desublimation and sublimation, three boundary conditions (i.e. (2.12)–(2.14)) need to be addressed. First, the conjugate heat transfer in (2.14) is automatically realized by solving the energy conservation equation (3.1). Then, the no-slip velocity condition in (2.12) is achieved by the halfway bounce-back scheme. Finally, to implement the species mass conservation condition in (2.13), the $\textrm {CO}_2$ mass fraction gradient at the active interface $I_{d,s}$ is calculated based on the finite-difference scheme as (Zhang et al. Reference Zhang, Shi, Guo, Chai and Lu2012)
 \begin{equation} \boldsymbol{n} \boldsymbol{\cdot} \boldsymbol{\nabla} Y^{I_{d,s}} = \frac{Y^g-Y^{I_{d,s}}}{0.5\boldsymbol{n}\boldsymbol{\cdot} \boldsymbol{e}_i\delta_x}, \end{equation}
where  $Y^g$ is the $\textrm {CO}_2$ mass fraction at the gas grid neighbouring the interface $I_{d,s}$. By inserting (3.7) into (2.13) and using the ideal gas law, the value of $Y^{I_{d,s}}$ is calculated as
 \begin{gather} Y^{I_{d}} = \frac{D \rho_g Y^l + 0.5\boldsymbol{n}\boldsymbol{\cdot} \boldsymbol{e}_i\delta_x k_r p_e}{ D \rho_g + 0.5 \boldsymbol{n} \boldsymbol{\cdot} \boldsymbol{e}_i \delta_x k_r p_0 T/T_0}, \end{gather}
 \begin{gather} Y^{I_{s}} = \frac{D \rho_g Y^l + 0.5\boldsymbol{n}\boldsymbol{\cdot} \boldsymbol{e}_i\delta_x k_r A p_e}{ D \rho_g + 0.5 \boldsymbol{n} \boldsymbol{\cdot} \boldsymbol{e}_i \delta_x k_r A p_0 T/T_0}. \end{gather}
In this way, the  $\textrm {CO}_2$ mass fractions at the desublimation boundary $I_d$ and the sublimation boundary $I_s$ are obtained. Therefore, the mass conservation boundary condition in (2.13) can be re-expressed as (3.8)–(3.9), namely, a boundary with a given $\textrm {CO}_2$ mass fraction $Y^{I_{d,s}}$. The halfway bounce-back scheme is used to impose this boundary condition, with the unknown distribution functions at the gas grid $\boldsymbol {x}_g$ adjacent to $I_{d,s}$ being (Zhang et al. Reference Zhang, Shi, Guo, Chai and Lu2012)
 \begin{equation} g_{\bar{\imath} }\left( \boldsymbol{x}_g, t + \delta _t \right) ={-}g'_i \left( \boldsymbol{x}_g, t \right)+2w_iY^{I_{d,s}}. \end{equation}
Here, the superscript  $'$ denotes the post-collision distribution function, $\bar {\imath }$ is the opposite direction of $i$ as $\boldsymbol {e}_i = -\boldsymbol {e}_{\bar {\imath } }$ and $\boldsymbol {e}_i$ points to the solid phase zone. More details on the present MRT LB model and boundary treatments are provided in Appendices A and B.
3.3. Evolution of solid $\textrm {CO}_2$

With the desublimation and sublimation of  $\textrm {CO}_2$, the evolution of a solid $\textrm {CO}_2$ structure at the pore scale is tracked by (2.7). In LB simulations this structure evolution is realized by the commonly used VOP method (Kang et al. Reference Kang, Lichtner and Zhang2006; Wang et al. Reference Wang, Han, Wang, Ma and Wang2019). Explicitly, a fine enough mesh is selected to cover the computational domain and each grid node (or pixel) is located at the centre of a control cell with size $1\times 1 \times 1$ in lattice units. Each grid is assumed to represent a cell composed of a single material: solid grain cell, solid $\textrm {CO}_2$ cell or flue gas cell. Initially, the volume of solid $\textrm {CO}_2$ is set as $V_s=1$ for solid $\textrm {CO}_2$ grids, $V_s=0$ for gas grids and $V_s=0$ for packing grain grids, respectively. As the desublimation and sublimation of $\textrm {CO}_2$ occurs, the value of $V_s$ is calculated at each time step by
 \begin{equation} V_s\left(t + \delta _t\right) = V_s\left(t \right) + m_r a_r V_r/\rho_s. \end{equation}
With the desublimation of  $\textrm {CO}_2$ (i.e. $m_r>0$), the value of $V_s$ increases with time. As $V_s$ doubles at a solid $\textrm {CO}_2$ grid (i.e. $V_s=2$) or increases to $V_s=1$ in a grain grid, one of its neighbouring gas grids is converted into a solid $\textrm {CO}_2$ grid. The ratio of the growth probability between the nearest and the diagonal grids is $R_{dp}=1:0.25$, which is consistent with the ratio of weight coefficients $w_i$ (Lei et al. Reference Lei, Luo, Hernández Pérez, Wang, Wang, Restrepo Cano and Im2023). On the other hand, $V_s$ decreases with the sublimation of $\textrm {CO}_2$ (i.e. $m_r<0$). As $V_s$ decreases to zero, the solid $\textrm {CO}_2$ grid is turned into a gas grid.
3.4. Numerical procedure
The developed MRT LB model for  $\textrm {CO}_2$ desublimation and sublimation was programmed in the C language, following the algorithmic flowchart in figure 3. The main steps are as follows.
(i) Start the process and initialize the gas flow, temperature and
$\textrm {CO}_2$ mass fraction fields.(ii) Solve the flow field to update the gas velocity
$\boldsymbol {u}$.(iii) Simulate the heat and
$\textrm {CO}_2$ transfer to obtain temperature $T$ and $\textrm {CO}_2$ mass fraction $Y$.(iv) Calculate the mass transfer rate
$m_r$ and classify three gas–solid boundaries as $I_n$, $I_d$ and $I_s$.(v) Implement
$\textrm {CO}_2$ desublimation and sublimation at boundaries $I_d$ and $I_s$, leading to changes in gaseous $\textrm {CO}_2$ mass fraction $Y^{I_{d,s}}$, solid $\textrm {CO}_2$ volume $V_s$ and heat terms $Q_{d,s}$.(vi) Track evolutions of solid
$\textrm {CO}_2$ structure, bringing about changes in flow channels and thermophysical properties of updated grids.(vii) Enforce boundary conditions at both external and internal boundaries.
(viii) Repeat (ii)–(vii) until the stop criterion is satisfied.


Figure 3. The schematic diagram of the overall numerical implementation.
To enable parallel execution, the message passing interface library is utilized and the developed LB code is validated comprehensively. Appendix C is provided to elucidate model validation tests. Upon the validation of the developed LB code, pore-scale simulations are conducted to investigate  $\textrm {CO}_2$ desublimation and sublimation on a single packing grain and in a packed bed, employing 640 and 1280 compute cores for the simulations of each configuration, respectively. In contrast to our prior investigation of $\textrm {CO}_2$ desublimation on an isothermal grain (Lei et al. Reference Lei, Luo, Hernández Pérez, Wang, Wang, Restrepo Cano and Im2023), the current study expands the scope to encompass both desublimation and sublimation of $\textrm {CO}_2$ within the context of CCC. The mathematical frameworks built here are augmented by incorporating new phase change processes ((2.1)–(2.2)) and modified mass transfer rates (2.3). These enhancements facilitate a comprehensive treatment of the multiphysics behind CCC, including the released desublimation heat $Q_d$ and the absorbed sublimation heat $Q_s$, the dynamic boundaries pertinent to $\textrm {CO}_2$ desublimation $I_d$ and sublimation $I_s$, and the generation and consumption of solid $\textrm {CO}_2$. Consequently, the boundary schemes and the evolution of solid $\textrm {CO}_2$ in the present LB model allow for a more detailed physical description of the phenomena compared with those in our previous research (Lei et al. Reference Lei, Luo, Hernández Pérez, Wang, Wang, Restrepo Cano and Im2023).
4. Results and discussion
For the cryogenic packed bed in figure 2, key geometrical parameters are set as: length  $l_x=124.8\, \textrm {mm}$, width $l_y=20.8\, \textrm {mm}$, grain diameter $l_d=10.0\, \textrm {mm}$ and porosity $\psi =0.64$. From such a bed, a small-size domain encompassing a single grain is selected for single-grain simulations. The void volume fraction of this small-size domain equals the bed porosity $\psi$ and the other geometrical parameters are $l_{sx}=14.7\, \textrm {mm}$ and $l_{sy}=14.7\, \textrm {mm}$. Initially, packing grains are cooled to $T_w$ for $\textrm {CO}_2$ desublimation and flow paths among grains are filled with $\textrm {N}_2$ at temperature $T_w$. The incompressible flue gas at the initial condition $(T_0, Y_0, u_0, p_0 )$ is fed in from the left inlet ( $x=0$) and the component $\textrm {CO}_2$ is desublimated on packing grains. The four external boundaries of the computational domain are set as follows: the flue gas at $(T_0, Y_0, u_0, p_0 )$ is fed in from the inlet, a fully developed flow is considered at the outlet, the periodic conditions are imposed at the bottom and top. More details of these boundaries are provided in Appendix B.
The desublimation parameters and thermophysical properties used in the following simulations are listed in table 1. These physical parameters are converted into lattice units by matching the dimensionless parameters in (2.15), where characteristic parameters are selected as
 \begin{equation} L = l_y, \quad U = u_0, \quad \rho_{ch}=\rho_g, \quad T_{ch}=T_0. \end{equation}
Prior studies have noted the importance of the gas feed rate and initial bed temperature to the carbon capture performance of CCC. Therefore,  $u_0$ and $T_w$ are varied to change the operating conditions, covering $u_0$ from $1.22\times 10^{-3}\, \textrm {m}\,\textrm {s}^{-1}$ to $6.10\times 10^{-2}\, \textrm {m}\,\textrm {s}^{-1}$ and $T_w$ from $80\, \textrm {K}$ to $180\, \textrm {K}$. These two parameters are characterized by the Péclet number ${{Pe}}$ and the subcooling degree of bed $\Delta T_s=(T_f-T_w)/T_0$, which lie in ranges of $[1.55, 77.84]$ and $[0.049, 0.389]$, respectively. Values of these two parameters are listed in table 2 in Appendix D.
Table 1. Physical properties for simulations of  $\textrm {CO}_2$ desublimation and sublimation during CCC.

Table 2. Values of the initial bed temperature  $T_w\ ({\textrm {K}})$, gas feed rate $u_0(\times 10^{-2} \, \textrm {m}\,\textrm {s}^{-1})$ and grain position $r_x\ (\textrm {m})$ (with $r_y = l_y$), as well as the corresponding subcooling degree $\Delta T_s$, Péclet number $Pe $ and bed porosity $\psi$.

To ensure the numerical solution is grid independent, grid convergence tests were carried out first. Two meshes of size  $5400 \times 900$ and $640 \times 640$, with a lattice resolution $0.023\, \textrm {mm}$, are selected to describe the cryogenic packed bed and the small-size domain in figure 2. Details about the grid convergence tests are provided in the supplementary material. Since both the capture and recovery steps of CCC are considered, each simulation test is continued until all the desublimated $\textrm {CO}_2$ is sublimated to gaseous $\textrm {CO}_2$ at the time instant $t_e$, which is termed as the operating time.
4.1. $\textrm {CO}_2$ desublimation and sublimation on a single packing grain

The initial objective of this study is to identify the  $\textrm {CO}_2$ desublimation and sublimation properties on a single packing grain. A test with the subcooling degree $\Delta T_s=0.185$ and the Péclet number ${{Pe}}=15.57$ is simulated. The obtained distributions of solid $\textrm {CO}_2$, temperature $T$ and $\textrm {CO}_2$ mass fraction $Y$ at five time instants are provided in figure 4.

Figure 4. The  $\textrm {CO}_2$ desublimation and sublimation properties on a single packing grain with the subcooling degree $\Delta T_s=0.185$ and the Péclet number ${{Pe}}=15.57$. Contours of (a) solid $\textrm {CO}_2$, (b) temperature ( $T$) and(c) $\textrm {CO}_2$ mass fraction ( $Y$) at five time instants $t=4.83, 14.51, 29.01, 58.02, 101.77\, \textrm {s}$.
In the early stage (figure 4 at  $t=4.83, 14.51\, \textrm {s}$), the injected flue gas is cooled by the grain and its component $\textrm {CO}_2$ is desublimated to generate SCL on the grain surface. Meanwhile, the incoming warm flue gas and the heat $Q_d$ released from $\textrm {CO}_2$ desublimation raise the temperature of the packing grain, which gradually brings about the sublimation of the previously generated SCL (figure 4 at $t=29.01\, \textrm {s}$). Following the continuous increase in grain temperature, the desublimation strength of $\textrm {CO}_2$ on the grain surface starts to decrease. As a result, the evident sublimation of SCL is observed compared with its generation (figure 4 at $t=58.02\, \textrm {s}$). Finally, the grain becomes warm and SCL is completely sublimated to gaseous $\textrm {CO}_2$ at $t_e=101.77\, \textrm {s}$, signaling the cessation of both $\textrm {CO}_2$ desublimation and sublimation.
Given the vital role of the captured SCL in assessing the performance of CCC, the volume fraction of solid  $\textrm {CO}_2$ ( $\phi _c$) on the packing grain is quantified by
 \begin{equation} \phi_c= \frac{1}{l_xl_y}\int_0^{l_x}\int_0^{l_y}V_s\left(x,y\right)\,{\rm d}y\,{\rm d}\kern0.06em x. \end{equation}
The calculated  $\phi _c$ is recorded versus time in figure 5(a), whose behaviour is explained with the help of the averaged temperature ( $\bar {T}_a$) and overall mass transfer rates via desublimation and sublimation ( $m_r^*$) in figure 5(b–d). Here $\bar {T}_a$ is defined as the averaged temperature for the active gas–solid interface $I_{d,s}$, where $\textrm {CO}_2$ desublimation and sublimation take place:
 \begin{equation} \bar{T}_a= \frac{1}{I_{d,s}}\sum_{I_{d,s}}T\left(x,y\right). \end{equation}
The overall mass transfer rates are calculated as
 \begin{equation} \left. \begin{gathered} m_{rd}^*= \frac{1}{\rho_g u_0}\sum_{I_{d}}m_r\left(x,y\right), \quad m_{rs}^*={-}\frac{1}{\rho_g u_0}\sum_{I_{s}}m_r\left(x,y\right), \\ m_{r}^* = \frac{1}{\rho_g u_0}\sum_{I_{d,s}}m_r\left(x,y\right)= m_{rd}^*+({-}m_{rs}^*). \end{gathered} \right\} \end{equation}
Here,  $m_{rd}^*$ and $m_{rs}^*$ represent the mass transfer rates through desublimation at $I_d$ and sublimation at $I_s$, respectively; $m_{r}^*$ stands for the combined mass transfer rate by both desublimation and sublimation at $I_{d,s}$.

Figure 5. Analyses of  $\textrm {CO}_2$ desublimation and sublimation on a single packing grain with the subcooling degree $\Delta T_s=0.185$ and the Péclet number $Pe =15.57$. Temporal evolutions of (a) volume fraction of the solid $\textrm {CO}_2$ captured ( $\phi _c$), (b) averaged temperature of active boundaries ( $\bar {T}_a$) and (c,d) overall mass transfer rate via desublimation and sublimation ( $m_r^*$, $m_{rd}^*$ and $m_{rs}^*$). Contours of solid $\textrm {CO}_2$, temperature ( $T$) and $\textrm {CO}_2$ mass fraction ( $Y$) at (e) peak point $t_m$ and (f) inflection point $t_i$.
Initially,  $\phi _c$ in figure 5(a) increases with time due to the stronger desublimation rate compared with the sublimation rate (i.e. $m_r^*>0$ in figure 5c). The growth rate of $\phi _c$ is observed to decrease over time. As shown in figure 5(b–d), this is driven by the fact that the ascending $\bar {T}_a$ decelerates desublimation ( $m_{rd}^*$) while accelerating sublimation ( $m_{rs}^*$). Subsequently, the desublimation rate gradually drops to an equilibrium level with the sublimation rate at $t_m$ (i.e. $m_r^*=0$), where $\phi _c$ reaches a peak value $\phi _{cm}$. Scalar distributions at this peak point $t_m$ are shown in figure 5(e). After $t_m$, $\phi _c$ decreases until it reaches zero at $t_e=101.77\, \textrm {s}$, wherein the desublimation rate decreases steadily and becomes weaker than the sublimation rate (i.e. $m_r^*<0$). The decrease in $\phi _c$ experiences an inflection point at $t_i$, after which the drop rate of $\phi _c$ slows down. This is because the SCL on the front part of the grain is completely sublimated at $t_i$, leading to the diminished sublimation rate. For illustration, figure 5(a) plots the temporal evolutions of $\phi _c$ for the front and back grain areas, and figure 5(f) provides the scalar distributions at $t_i$. Besides, the warm gas stream and $\textrm {CO}_2$ desublimation contribute to raising $\bar {T}_a$ towards an equilibrium value of approximately $189.3\, \textrm {K}$, which is in line with experimental findings (Tuinier et al. Reference Tuinier, van Sint Annaland, Kramer and Kuipers2010, Reference Tuinier, van Sint Annaland and Kuipers2011b). Taken together, these quantitative analyses corroborate the above qualitative observations in figure 4 and also provide insights into the $\textrm {CO}_2$ desublimation and sublimation processes.
4.2. Effects of $\Delta t_s$ and $Pe $ in the single-grain case


In the single-grain case, after the discussion of general  $\textrm {CO}_2$ desublimation and sublimation properties, a parametric study is set out to explore the impact of subcooling degree $\Delta T_s$ and Péclet number $Pe $ on the carbon capture performance of the cold grain. The $\textrm {CO}_2$ desublimation and sublimation processes are simulated at Péclet numbers $Pe \in [1.55, 46.70]$, and each $Pe $ contains a subsection of subcooling degrees $\Delta T_s \in [0.049,\ 0.389]$. From the above discussions on $\textrm {CO}_2$ desublimation and sublimation properties in § 4.1, two important metrics stand out to quantify the carbon capture performance of the grain, namely, the maximum volume fraction of solid $\textrm {CO}_2$ captured by the packing grain ( $\phi _{cm}$) and the operating time of the $\textrm {CO}_2$ desublimation and sublimation processes ( $t_e$). Based on these two metrics, the $\textrm {CO}_2$ capture rate ( $v_c$) is calculated as
 \begin{equation} v_c = \frac{\phi_{cm}}{t_e}. \end{equation}
A grain with a larger  $v_c$ demonstrates a higher efficiency in capturing the $\textrm {CO}_2$ component, making it desirable.
Figure 6 depicts values of ( $\phi _{cm}$, $t_e$, $v_c$) for a wide range of $\Delta T_s$ and $Pe $, where each dot represents a simulation test at a given operating condition ( $\Delta T_s$, $Pe $). For a fixed $Pe $, effects of $\Delta T_s$ on the $\textrm {CO}_2$ capture performance of the grain share a similar trend: the successive rise in $\Delta T_s$ introduces the continuous increase in both $t_e$ and $\phi _{cm}$. For example, as $\Delta T_s$ varies from $0.049$ to $0.389$ at $Pe =15.57$, $\phi _{cm}$ increases from $0.005$ to $0.138$ and $t_e$ grows from $48.59\, \textrm {s}$ to $150.84\, \textrm {s}$. As supported by figure 7(a), a possible explanation is that a packing grain with a higher $\Delta T_s$ holds a lower temperature $\bar {T}_p$. Under the fixed gas feed rate condition (i.e. constant $Pe $), the convective heat transfer strength is similar and, thus, a colder grain requires a lengthier duration ( $t_e$) for the incoming warm flue gas to heat it up. This subsequently produces an increased amount of solid $\textrm {CO}_2$ captured ( $\phi _{cm}$). On the other hand, $v_c$ in figure 6(c) is seen to increase with the ascending $\Delta T_s$, indicating that a colder packing grain is beneficial to improving the $\textrm {CO}_2$ capture performance of the grain. Meanwhile, based on the value of $Pe $, two distinct regimes arise from the comparison of $v_c$ evolutions in response to changes in $Pe $ and $\Delta T_s$.

Figure 6. Analyses of  $\textrm {CO}_2$ capture performance in single-grain tests with subcooling degrees $\Delta T_s \in [0.049, 0.389]$ and Péclet numbers $Pe = 1.55, 3.89, 7.78, 15.57, 31.14, 46.70$. (a) The maximum volume fraction of solid $\textrm {CO}_2$ captured by the grain ( $\phi _{cm}$). (b) The operating time for $\textrm {CO}_2$ desublimation and sublimation ( $t_e$). (c) The $\textrm {CO}_2$ capture rate ( $v_c$). (d) Contours of solid $\textrm {CO}_2$, temperature ( $T$) and $\textrm {CO}_2$ mass fraction ( $Y$) in a convection-limited test with $\Delta T_s=0.185$ and $Pe = 1.55$ at two time instants $t=24.17, 48.34\, \textrm {s}$.

Figure 7. Analyses of  $\textrm {CO}_2$ capture performance in single-grain tests with subcooling degrees ${\Delta T_s = 0.117}, 0.185, 0.253, 0.321$ and Péclet numbers $Pe = 7.78, 15.57, 23.35, 31.14$. Temporal evolutions of (a,c) averaged temperature of the packing grain ( $\bar {T}_p$) and (b,d) overall mass transfer rate via desublimation and sublimation ( $m_r^*$).
First, in large- $Pe $ tests (e.g. $Pe > 7.8$ at $\Delta T_s=0.185$), the increasing $\Delta T_s$ accelerates $v_c$, while $Pe $ has minimal or no effects on it. Accordingly, a correlation is fitted as $v_c=22.56\Delta T_s-0.76$. As shown in figure 7(a,b), for a fixed $Pe $ in this regime, the larger $\Delta T_s$ brings about the colder packing grain ( $\bar {T}_p$) and the faster mass transfer rate ( $m_r^*$), introducing the accelerated $\textrm {CO}_2$ capture rate $v_c$. On the other hand, the negligible impact of increasing $Pe $ on $v_c$ can be explained by effects of convection between the warm gas stream and solid phases. The rapid convective gas flow augments the $\textrm {CO}_2$ delivery and amplifies the $\textrm {CO}_2$ desublimation rate. At the same time, however, the fast convective heat transfer rapidly heats up the grain and consequently slows down the desublimation of $\textrm {CO}_2$. Figure 7(c,d) is presented to corroborate the aforementioned effects of $Pe $. Following the growing $Pe $ in this regime, the $\textrm {CO}_2$ supply is abundant and $m_r^*$ is amplified at first ( $t<6\, \textrm {s}$ in figure 7d). After a short period, the ascending $Pe $ intensifies the convective heat transfer, yielding a significant increase in $\bar {T}_p$ and a rapid slowdown in $m_r^*$ ( $t>6\, \textrm {s}$ in figure 7c,d). As a result, the high $Pe $ leads to a reduction in both $t_e$ and $\phi _{cm}$ (figure 6a,b). Since $t_e$ and $\phi _{cm}$ exhibit a similar decrease rate, $v_c$ is barely or not affected by $Pe $. Considering that $v_c$ is primarily influenced by $\Delta T_s$ (or desublimation) rather than $Pe $, the $\textrm {CO}_2$ desublimation and sublimation processes in the large- $Pe $ range are denoted as the desublimation-limited (or subcooling-limited) regime.
Second, as  $Pe $ decreases to a rather small value (e.g. $Pe < 7.8$ at $\Delta T_s=0.185$), the increase in $\Delta T_s$ leads to the growing $\phi _{cm}$, $t_e$ and $v_c$, which is in line with the above desublimation-limited regime. However, the decline in $Pe $ induces a growth in $t_e$ but a slight variation in $\phi _{cm}$, giving rise to the diminished $v_c$. Therefore, both $\Delta T_s$ and $Pe $ play roles in determining $v_c$, making $v_c$ deviate from the correlation $v_c=22.56\Delta T_s-0.76$. This inconsistency from the desublimation-limited regime stems from the weak convection under small $Pe $. It is clear from figure 7(c,d) that the weak convective heat transfer extends the time period for heating up the packing grain, resulting in the prolonged $t_e$. For example, the decreased $Pe $ from 15.57 to 7.78 leads to the augmented $t_e$ from $101.77\, \textrm {s}$ to $123.04\, \textrm {s}$. In addition, the inadequate $\textrm {CO}_2$ supply via weak gas convection, along with the fixed $\Delta T_s$, results in the unchanged or even marginally diminished $\phi _{cm}$. The combination of these two factors is responsible for the obvious departure of $v_c$ from the correlation. These small- $Pe $ tests are classified as the convection-limited regime due to the weak convection. As an example, figure 6(d) provides scalar distributions in a convection-limited test with $\Delta T_s=0.185$ and $Pe = 1.55$. The insufficient $\textrm {CO}_2$ supply via weak convection is illustrated clearly by contours of the $\textrm {CO}_2$ mass fraction.
To directly demonstrate impacts of  $Pe $ on the $\textrm {CO}_2$ capture performance of the cold grain, simulation results for $Pe \in [1.55, 46.70]$ and $\Delta T_s=0.185$ are presented in figure 8. With the growing $Pe $, there is an obvious drop in both $\phi _{cm}$ and $t_e$, while $v_c$ initially experiences a sharp increase and then stabilizes after reaching the threshold of $Pe _c\approx 7.8$ (at $\Delta T_s=0.185$). Accordingly, the $\textrm {CO}_2$ desublimation and sublimation processes shift from the convection-limited regime to the desublimation-limited regime. These tendencies corroborate findings in figure 6, which are driven by changes in the relative strength between convection and desublimation.

Figure 8. Analyses of  $\textrm {CO}_2$ capture performance in single-grain tests with the subcooling degrees $\Delta T_s=0.185$ and the Péclet numbers $Pe \in [1.55, 46.70]$. (a) The maximum volume fraction of solid $\textrm {CO}_2$ ( $\phi _{cm}$) captured by the grain. (b) The operating time for $\textrm {CO}_2$ desublimation and sublimation ( $t_e$). (c) The $\textrm {CO}_2$ capture rate ( $v_c$).
Finally, a comprehensive map of the simulated  $v_c$ is plotted against $\Delta T_s \in [0.049, 0.389]$ and $Pe \in [1.55, 46.70]$ in figure 9. For comparison, the calculated $v_{cr}$ via the correlation $v_c=22.56\Delta T_s-0.76$ is presented as a grey surface. Here $v_c$ aligns closely with $v_{cr}$ in the large- $Pe $ region but exhibits notable deviations in the small- $Pe $ space. Thereby, distributions of the convection-limited (I) and desublimation-limited (II) regimes are obtained in the $\Delta T_s$– $Pe $ parameter space (figure 10). The boundary line between the two regimes is established (i.e. solid white line in figure 9 and grey dash line in figure 10), with threshold values ( $\Delta T_{sc}$, $Pe _c$) situated upon this boundary. As the $\Delta T_{s}$ (or $Pe $) increases, there is a consequent growth in the threshold value of $Pe _c$ (or $\Delta T_{sc}$). This relationship reflects that the augmented convection strength is necessary to counterbalance the increased desublimation rate. According to the regime diagram, it is essential that $\Delta T_s$ stays below $\Delta T_{sc}$ and $Pe $ exceeds $Pe _c$ in order to ensure the desublimation-limited regime and prevent weak convection limitations. Note that, the continuous increase in $Pe $ beyond $Pe _c$ is unnecessary as it no longer accelerates $v_c$. Although a large $\Delta T_s$ helps accelerate $v_c$, $\Delta T_s$ should be increased with caution because it has the potential to significantly boost the cooling duty. This aspect is beyond the scope of the present work and will be considered in our future work. In general, the regime diagram can provide guidance on how to select operation conditions for an optimal CCC system.

Figure 9. Analyses of the  $\textrm {CO}_2$ capture rate $v_c$ in single-grain tests with subcooling degrees $\Delta T_s \in [0.049, 0.389]$ and Péclet numbers $Pe \in [1.55, 46.70]$. The grey surface represents the correlation $v_c=22.56\Delta T_s-0.76$. The white solid line shows the boundary between the convection-limited (I) and desublimation-limited (II) regimes.

Figure 10. Analyses of  $\textrm {CO}_2$ capture performance in single-grain tests with subcooling degrees $\Delta T_s \in [0.049, 0.389]$ and Péclet numbers $Pe \in [1.55, 46.70]$. Simulation data points are plotted against $\Delta T_s$ and $Pe $. The grey dashed line divides the plane into the convection-limited (I) and desublimation-limited (II) regimes.
The thematically aligned research we conducted earlier explored  $\textrm {CO}_2$ desublimation on an isothermal grain during the capture of CCC (Lei et al. Reference Lei, Luo, Hernández Pérez, Wang, Wang, Restrepo Cano and Im2023). In contrast, this work extends to investigate both $\textrm {CO}_2$ desublimation and sublimation on a non-isothermal grain, encompassing the capture and recovery of CCC. These considerations make the present study incorporate a more comprehensive thermal interaction between grains and flow, leading to significantly distinct results that are more realistic in an actual CCC process. Some key differences are summarized as follows. (1) The diffusion-controlled and join-controlled regimes are no longer as distinct as they were predicted in the previous study (Lei et al. Reference Lei, Luo, Hernández Pérez, Wang, Wang, Restrepo Cano and Im2023), because the increase in the grain temperature diminishes the desublimation rate over time. (2) The previous study predicted that the solid $\textrm {CO}_2$ captured ( $\phi _{cm}$) continued to increase with $Pe $, while the present model shows that an increase in $Pe $ results in a decrease in $\phi _{cm}$ due to the diminished desublimation rate. (3) The previous study demonstrated an unrealistically high desublimation rate as $\Delta T_s$ increases. This results in the formation of cluster-like SCLs with highly porous structures, leading to a reduced desublimation duration and $\phi _{cm}$. By contrast, the present study correctly predicts that the ascending $\Delta T_s$ results in the growing $\phi _{cm}$ and the extended desublimation duration. (4) The sublimation of SCL and the $\textrm {CO}_2$ capture rate $v_c$ are newly analysed here, producing new and valuable insights into $\textrm {CO}_2$ desublimation and sublimation during CCC. Therefore, the present study provides more realistic and valuable insights into the CCC process and allows an improved understanding compared with our previous approach (Lei et al. Reference Lei, Luo, Hernández Pérez, Wang, Wang, Restrepo Cano and Im2023). In the following subsection, $\textrm {CO}_2$ desublimation and sublimation in a cryogenic packed bed are discussed.
4.3. The $\textrm {CO}_2$ desublimation and sublimation in a packed bed

In the packed-bed case, simulation tests for a wide range of subcooling degrees  $\Delta T_s$ and Péclet numbers $Pe $ are performed, which successfully reproduce $\textrm {CO}_2$ desublimation and sublimation properties during the capture and recovery steps of CCC. For illustration, figure 11(a,b) depicts numerical results for the test with $\Delta T_s=0.185$ and $Pe =15.57$, including contours of solid $\textrm {CO}_2$ and temperature distributions at five time instants. When feeding the warm flue gas to the packed bed, the flue gas is cooled until its component $\textrm {CO}_2$ starts to desublimate and generates an SCL on the packing grains. As time goes on, the SCL grows on the grains and forms a desublimation front ( $l_d$), which expands toward the outlet. In the meantime, under effects of the incoming warm flue gas and the exothermic $\textrm {CO}_2$ desublimation process, packing grains close to the inlet are significantly heated from $T_w$ to $T_0$. Owing to such a rise in temperature, the previously formed SCL is sublimated and a sublimation front ( $l_s$) develops. Following $l_d$, $l_s$ also progresses outwards but at a smaller velocity. In the packed bed, grains from $l_s$ to $l_d$ are coated by solid $\textrm {CO}_2$ and, thus, they are denoted as the SCL area.

Figure 11. The  $\textrm {CO}_2$ desublimation and sublimation properties in a packed bed with the subcooling degree $\Delta T_s=0.185$ and the Péclet number $Pe =15.57$. Contours of (a) solid $\textrm {CO}_2$ and (b) temperature ( $T$) at five time instants $t=24.78, 86.74, 173.48, 322.17, 589.82\, \textrm {s}$. Vertically averaged (c) volume fraction of solid $\textrm {CO}_2$ ( $\phi _{cx}$) and temperature ( $\bar {T}_x$) at two time instants $t=86.74, 322.17\, \textrm {s}$.
For quantification, vertically averaged scalars ( $\bar {\zeta }_x$) are introduced as
 \begin{equation} \bar{\zeta}_x= \frac{1}{l_y}\int_0^{l_y}\zeta\left(x,y\right)\,{{\rm d} y}, \quad \text{with}\ \zeta = V_s, T, Y. \end{equation}
Figure 11(c,d) presents the vertically averaged volume fraction of solid  $\textrm {CO}_2$ ( $\phi _{cx}$) and temperature ( $\bar {T}_x$) at two time instants. The calculated profiles of $\bar {T}_x$ for both grains (dashed lines) and gas (solid lines) exhibit a declining trend from the inlet to the outlet. On the other hand, ignoring fluctuations introduced by variations in the grain surface along the $x$ direction, curves of $\phi _{cx}$ change non-monotonically from the inlet to the outlet. For instance, at $86.74\, \textrm {s}$, starting from the inlet $\phi _{cx}$ remains zero at first, then it rises to a maximum value, subsequently it decreases back to zero and finally it remains constant until the outlet. From each profile of $\phi _{cx}$, the desublimation and sublimation fronts are identified as the two positions with $\phi _{cx}=0.01$. The region between these two fronts corresponds to the SCL area. From the comparison of $\phi _{cx}$ profiles at $86.74\, \textrm {s}$ and $322.17\, \textrm {s}$, it is evident that the SCL area together with the two fronts propagate outwards. These findings quantitatively support the observations in figure 11(a,b).
As  $l_d$ arrives at the bed exit, the component $\textrm {CO}_2$ starts to break through the packed bed and the outgoing $\textrm {CO}_2$ mass fraction gradually grows to the inlet value, i.e. $Y(l_x)=Y_0$. This phenomenon is termed the operational saturation and the CCC system is thus switched to the recovery step. To clarify the saturation condition of the packed bed, figure 12 displays distributions of $\textrm {CO}_2$ mass fraction ( $Y$) and profiles of the vertically averaged values ( $\bar {Y}_x$) at three time instants. At the early stage (i.e. $t=39.57\, \textrm {s}$), packing grains are cold enough to fully capture the injected $\textrm {CO}_2$. Over time, grains are gradually heated by the incoming warm flue gas and the exothermic desublimation, and thus, the injected $\textrm {CO}_2$ passes warm grains and moves toward the exit. With the continuous rise in grain temperature, part of the injected $\textrm {CO}_2$ starts to leave the packed bed without desublimation (i.e. $t=105.96\, \textrm {s}$). The outlet $\textrm {CO}_2$ mass fraction progressively increases to a critical value (i.e. 10 % in this study), indicating that the bed reaches the saturation point $t_{sat}=136.34\, \textrm {s}$. After $t_{sat}$, the injected $\textrm {CO}_2$ is less efficiently captured and the CCC system enters the recovery step to collect the captured SCL. To quantify $t_{sat}$, profiles of $\bar {Y}_x$ are utilized to define the saturation front ( $l_{sat}$) as the position with $\bar {Y}_x=0.1$. Saturation point $t_{sat}$ is then determined as the time instant when $l_{sat}$ moves to the outlet (i.e. $t_{sat}=136.34\, \textrm {s}$ in figure 12b).

Figure 12. The  $\textrm {CO}_2$ desublimation and sublimation properties in a packed bed with the subcooling degree $\Delta T_s=0.185$ and the Péclet number $Pe =15.57$. (a) Contours of $\textrm {CO}_2$ mass fraction ( $Y$) and (b) vertically averaged $\textrm {CO}_2$ mass fraction ( $\bar {Y}_x$) at three time instants $t=39.57, 105.96, 136.34\, \textrm {s}$.
Following the same procedure as in the single-grain case, temporal evolutions of the solid  $\textrm {CO}_2$ volume fraction ( $\phi _c$) and the mass transfer rate ( $m_r^*$) are calculated and plotted in figure 13 to quantify the $\textrm {CO}_2$ capture performance of the packed bed. Initially, the curve of $\phi _c$ experiences a sharp increase. This is because the packing grains are sufficiently cold and the $\textrm {CO}_2$ desublimation dominates the system. However, as grains are heated by the incoming warm gas and the released heat from desublimation $Q_d$, the mass transfer rate $m_r^*$ drops to be negative. Consequently, the $\textrm {CO}_2$ sublimation controls the system and $\phi _c$ starts to decrease until all the captured SCL is recovered at $t_e$. From this nonlinear profile of $\phi _c$, the maximum solid $\textrm {CO}_2$ capture capacity of the packed bed is determined as $\phi _{cm}$ at $t_m$. The non-monotonic variation of $\phi _c$ aligns with that observed in the single-grain case in figure 5. In contrast, no inflection point is detected during the decreasing stage of $\phi _c$ here. This stems from the fact that the multiple packing grains help to average out the temperature difference between the front and back areas of each single grain.

Figure 13. Analyses of  $\textrm {CO}_2$ desublimation and sublimation in a packed bed with the subcooling degree $\Delta T_s=0.185$ and the Péclet number $Pe =15.57$. Temporal evolutions of (a) volume fraction of the solid $\textrm {CO}_2$ captured ( $\phi _c$), (b) position of the saturation front ( $l_{sat}$) and (c,d) overall mass transfer rate via desublimation and sublimation ( $m_r^*$, $m_{rd}^*$ and $m_{rs}^*$).
For the operation of CCC in a packed bed, a key issue is the timely detection of the operational saturation point  $t_{sat}$, at which the system should initiate the recovery step to gather the captured SCL. Otherwise, any delayed actions could result in detrimental consequences, such as CCC malfunction and flue gas breakthrough. For this purpose, the position of the saturation front ( $l_{sat}$) is identified based on the vertically averaged $\textrm {CO}_2$ mass fraction ( $\bar {Y}_x$) and set out as a function of time in figure 13(b). There is a clear ascending trend in the temporal evolution of $l_{sat}$ from the inlet ( $l_{sat}=0$) to the outlet ( $l_{sat}=l_x$), which corroborates the outward movement of $l_{sat}$ in figure 12. As marked by the red dash circle in figure 13(b), $t_{sat}$ is quantitatively identified as the earliest time instant when $l_{sat}$ advances to the outlet. One unexpected finding is that $t_{sat}$ is earlier than $t_m$. During the operation of CCC, however, the system is desired to start the recovery of the SCL at $t_m$, so as to capture the maximum amount of $\textrm {CO}_2$. To quantify the performance degradation, two metrics associated with the time delay are defined. One is the delayed time period, $t_{d} = t_m - t_{sat}$, and the other one is the capacity loss
 \begin{equation} \eta_d= \frac{\phi_{m}-\phi_{sat}}{\phi_{m}}. \end{equation}
It is apparent that, as  $t_d$ and $\eta _d$ approach zero, the carbon capture performance of the packed bed is optimal.
These numerically obtained  $\textrm {CO}_2$ desublimation and sublimation properties in a packed bed accord closely with experimental observations during the capture and recovery steps (Tuinier et al. Reference Tuinier, van Sint Annaland, Kramer and Kuipers2010, Reference Tuinier, van Sint Annaland and Kuipers2011b; Ali et al. Reference Ali, Maqsood, Syahera, Shariff and Ganguly2014). Moreover, the detailed spatio-temporal evolution of scalar distributions and quantitative analyses, which are difficult to obtain from experiments, contribute to a better understanding of CCC. After that, parametric analyses are set out to elucidate the key operating factors. Compared with the single-grain case, the same range of $\Delta T_s \in [0.049, 0.389]$ is considered, while the range of $\textrm {Pe}$ is extended to be $[6.23, 77.84]$ due to the resistance of multiple grains. In addition, the porous structure of the packed bed is expected to impact its flow channels and $\textrm {CO}_2$ capture performance. Therefore, the following packed-bed tests aim to examine effects of the gas velocity, bed temperature and bed structure.
4.4. Effects of $\Delta t_s$ and $Pe $ in the packed-bed case


From the above  $\textrm {CO}_2$ desublimation and sublimation properties, four key metrics emerge for evaluating the $\textrm {CO}_2$ capture performance of the packed bed, including the maximum volume fraction of solid $\textrm {CO}_2$ captured ( $\phi _{cm}$), the operating time of $\textrm {CO}_2$ desublimation and sublimation ( $t_e$), the $\textrm {CO}_2$ capture capacity loss due to the delay between the maximum point and the saturation point ( $\eta _d$), and the $\textrm {CO}_2$ capture rate ( $v_c$). These four metrics are calculated and analysed for packed-bed tests with varying $\Delta T_s$ and $Pe $.
Figure 14 compares values of metrics ( $\phi _{cm}$, $t_e$, $\eta _d$, $v_c$) for tests with $\Delta T_s \in [0.049, 0.389]$ and $Pe = 15.57, 31.14, 46.70, 62.27, 77.84$. As $\Delta T_s$ increases at a fixed $Pe $, the results follow a similar trend. On the one hand, a rise in $\Delta T_s$ increases $\phi _{cm}$ and $t_e$ (figure 14a,b). As explained in the single-grain case, this stems from the lower temperature in grains and the enhanced desublimation intensity ( $m_r$). On the other hand, the ascending $\Delta T_s$ yields the growing $v_c$ but at a diminished growth rate (figure 14d). From comparisons of results at different $Pe $ numbers, it is evident that the large $Pe $ (or fast gas convection) amplifies $v_c$. Incorporating impacts of both $\Delta T_s$ and $Pe $, a correlation is established to fit the simulation data as $v_c=(0.02Pe -0.19)\ln (\Delta T_s-0.024)+(0.083Pe -0.37)$. Therefore, $v_c$ is determined by both $\Delta T_s$ and $Pe $ in the packed-bed case, suggesting all the packed-bed tests operate in the convection-limited regime. Unlike the single-grain case, no linear correlation between $\Delta T_s$ and $v_c$ appears and the desublimation-limited regime is not identified. This difference stems from the presence of multiple grains in the packed bed, which lead to the insufficient $\textrm {CO}_2$ supply and the convection-limited mechanism.

Figure 14. Analyses of  $\textrm {CO}_2$ capture performance in packed-bed tests with subcooling degrees $\Delta T_s \in [0.049, 0.389]$ and Péclet numbers $Pe = 15.57, 31.14, 46.70, 62.27, 77.84$. (a) The maximum volume fraction of solid $\textrm {CO}_2$ ( $\phi _{cm}$) captured by the bed. (b) The operating time for $\textrm {CO}_2$ desublimation and sublimation ( $t_e$). (c) The $\textrm {CO}_2$ capture capacity loss due to the time delay between the maximum and saturation points ( $\eta _d$). (d) The $\textrm {CO}_2$ capture rate ( $v_c$).
Figure 14(c) displays results of  $\eta _d$, a parameter absent in the single-grain case. An ascending $\Delta T_s$ is found to yield a consistent drop in $\eta _d$ (or diminished $\textrm {CO}_2$ capture capacity loss). For instance, when $Pe $ is set at 15.57, a relatively small $\Delta T_s \approx 0.09$ results in a $\eta _d$ approaching 100 %, and the CCC system ceases to function. As $\Delta T_s$ grows to a significant level $\Delta T_s > 0.14$, however, a noticeable decrease in $\eta _d$ to approximately 10 % becomes evident. It is because the higher $\Delta T_s$ brings about the stronger desublimation intensity and subsequently the smaller $\eta _d$. To prevent the weak desublimation and the significant $\eta _d$, $\Delta T_s$ needs to be maintained above a threshold $\Delta T_{sc}$ at a given $Pe $. A critical value of $\eta _{dc}=0.2$ is set in this study to determine the value of $\Delta T_{sc}$ at each $Pe $ (e.g. $\Delta T_{sc}\approx 0.15$ at $Pe = 15.57$). Small- $\Delta T_s$ tests (i.e. $\Delta T_s < \Delta T_{sc}$) featuring $\eta _{d}>0.2$, are categorized into the desublimation-limited regime. In addition, the growing $Pe $ amplifies the convective gas flow, yielding the severe $\eta _d$ and the increased $\Delta T_{sc}$. By combining results of $v_c$ and $\eta _d$, both the convection-limited and desublimation-limited regimes are identified.
As mentioned above, the increasing  $Pe $ accelerates the $\textrm {CO}_2$ capture rate ( $v_c$) but deteriorates the capture capacity ( $\eta _d$). To clarify effects of $Pe $ on the CCC system, figure 15 presents metrics ( $\phi _{cm}$, $t_e$, $\eta _d$, $v_c$) for tests with $\Delta T_s = 0.185$ and $Pe \in [6.23, 77.84]$. The ascending $Pe $ (or intensified convection) results in the decreasing $\phi _{cm}$ and $t_e$ (figure 15a,b). As for simulated $v_c$ values, they fit well with the correlation obtained from figure 14(d), namely, $v_c=(0.02Pe -0.19)\ln (\Delta T_s-0.024)+(0.083Pe -0.37)$ at $\Delta T_s = 0.185$. In contrast to the single-grain case, $v_c$ grows continuously with $Pe $ because the multiple cold grains are sufficient to capture $\textrm {CO}_2$. According to results of $v_c$, all tests are not constrained by $\Delta T_s$ and fall into the convection-limited regime. On the other side, $\eta _d$ in figure 15(c) exhibits two distinct stages with the ascending $Pe $: $\eta _d$ initially remains almost unchanged at around 10 % but it starts to increase sharply after a critical value of $Pe _c\approx 39$ (at $\Delta T_s = 0.185$). The intensified convection induces a shift from the convection-limited regime to the desublimation-limited one.

Figure 15. Analyses of  $\textrm {CO}_2$ capture performance in packed-bed tests with the subcooling degree $\Delta T_s = 0.185$ and the Péclet numbers $Pe \in [6.23, 77.84]$. (a) The maximum volume fraction of solid $\textrm {CO}_2$ ( $\phi _{cm}$) captured by the bed. (b) The operating time for $\textrm {CO}_2$ desublimation and sublimation ( $t_e$). (c) The $\textrm {CO}_2$ capacity loss due to the time delay between the maximum point and the saturation point ( $\eta _d$). (d) The $\textrm {CO}_2$ capture rate ( $v_c$).
From results in figures 14 and 15, either a small  $\Delta T_s$ or a large $Pe $ is found to cause the desublimation-limited regime with remarkable $\textrm {CO}_2$ capture capacity loss. To show the $\textrm {CO}_2$ desublimation and sublimation properties under these two conditions, results for two tests with ( $\Delta T_s = 0.006$, $Pe = 15.57$) and ( $\Delta T_s = 0.185$, $Pe = 77.84$) are provided in figure 16, including distributions of solid $\textrm {CO}_2$, temperature ( $T$),
$T$),  $\textrm {CO}_2$ mass fraction ( $Y$) and their vertically averaged profiles. On the one hand, in the small- $\Delta T_s$ test ( $\Delta T_s = 0.006$, $Pe = 15.57$), the desublimation rate is slow. Both the distribution of $Y$ and the profile of $\bar {Y}_x$ support that the injected $\textrm {CO}_2$ exceeds the desublimation rate and $\textrm {CO}_2$ breaks through the bed early. On the other hand, in the large- $Pe $ test ( $\Delta T_s = 0.185$, $Pe = 77.84$), the abundant $\textrm {CO}_2$ is injected into the bed, and thus, the desublimation rate is insufficient to fully capture the injected $\textrm {CO}_2$. In these two tests, either the slow desublimation rate or the fast gas injection (or convection) make the CCC system operate in the desublimation-limited regime. Under this regime, the system reaches the saturation point too early and the cold grains are not efficiently heated up.

Figure 16. The  $\textrm {CO}_2$ desublimation and sublimation properties in a packed bed. Contours of solid $\textrm {CO}_2$, temperature ( $T$),
$T$),  $\textrm {CO}_2$ mass fraction ( $Y$) and the corresponding vertically averaged profiles in (a) the test with the subcooling degree $\Delta T_s = 0.006$ and the Péclet number $Pe = 15.57$ at $t=6.20\,\textrm {s}$, and (b) the test with the subcooling degree $\Delta T_s = 0.185$ and the Péclet number $Pe = 77.84$ at $t=8.67\,\textrm {s}$.
To comprehensively illustrate effects of  $\Delta T_s$ and $Pe $ on the $\textrm {CO}_2$ capture performance of CCC, values of $\eta _d$ and $v_c$ from simulations are plotted in the $\Delta T_s$– $Pe $ space (figure 17). For comparison, two grey surfaces are included for the critical value $\eta _{dc}=0.2$ and the calculated $v_{cr}$ from the correlation $v_c=(0.02Pe -0.19)\ln (\Delta T_s-0.024)+(0.083Pe -0.37)$. The agreement between $v_c$ and $v_{cr}$ across all tests indicates the dominance of the convection-limited regime. Moreover, through a comparison between $\eta _d$ and $\eta _{dc}$, threshold values ( $\Delta T_{sc}$, $Pe _c$) are obtained to delimit the domain for the desublimation-limited regime. The joint analysis of $v_c$ and $\eta _d$ produces a regime diagram in figure 18, showing distributions of the convection-limited (I) and desublimation-limited (II) regimes. The regime diagram suggests to control the gas feed rate below $Pe _c$ and raise the subcooling degree of grains beyond $\Delta T_{sc}$. This ensures that the CCC system operates within the convection-limited regime rather than the desublimation-limited one. Otherwise, the severe $\textrm {CO}_2$ capture capacity loss, coupled with the limited desublimation, will degrade the performance of CCC. Within the suggested parameter range, a large $Pe $ contributes to increasing $v_c$ while affecting $\eta _d$ slightly, hence, the improved $\textrm {CO}_2$ capture performance. Besides, as $\Delta T_s$ increases, the CCC system becomes more efficient in capturing $\textrm {CO}_2$ with larger $v_c$ and smaller $\eta _d$. However, considering the diminished improvement in the $\textrm {CO}_2$ capture performance and the escalated requirement for cooling duty, the continued rise in $\Delta T_s$ after $\Delta T_{sc}$ should be implemented with care.

Figure 17. Analyses of (a) the  $\textrm {CO}_2$ capacity loss ( $\eta _d$) due to the time delay between the maximum point and the saturation point and (b) the $\textrm {CO}_2$ capture rate ( $v_c$) in packed-bed tests with subcooling degrees $\Delta T_s \in [0.049, 0.389]$ and Péclet numbers $Pe \in [15.57, 77.84]$. Grey surfaces represent the threshold $\eta _{dc}=0.2$ and the correlation $v_c=(0.02Pe -0.19)\ln (\Delta T_s-0.024)+(0.083Pe -0.37)$. The white solid line shows the boundary between the convection-limited (I) and desublimation-limited (II) regimes.

Figure 18. Analyses of  $\textrm {CO}_2$ capture performance in packed-bed tests with subcooling degrees $\Delta T_s \in [0.049, 0.389]$ and Péclet numbers $Pe \in [15.57, 77.84]$. Simulation data points are plotted against $\Delta T_s$ and $Pe $. The grey dashed lines divide the plane into the convection-limited (I) and desublimation-limited (II) regimes.
The comparison between single-grain and packed-bed cases reveals their unique regime distributions and optimal operations. The desublimation-limited regime, featuring rapid  $\textrm {CO}_2$ capture rate $v_c$, is more suited for the single-grain configuration. However, in a packed bed, the CCC system operates more efficiently in the convection-limited regime, despite the high $v_c$ in the desublimation-limited regime. This arises from the fact that the packed-bed case considers the potential loss in $\textrm {CO}_2$ capture capacity ( $\eta _d$), and the limited desublimation significantly boosts $\eta _d$. On the other hand, the regime diagram for the packed-bed scenario (figure 18) illustrates an extended distribution of the convection-limited regime, when compared with the diagram for the single-grain situation (figure 10). This is attributed to the collective influence of multiple grains. These grains offer ample surface area and low temperature space, which necessitate the substantial convective $\textrm {CO}_2$ supply to sustain $\textrm {CO}_2$ desublimation. Consequently, a high $Pe _c$ at each $\Delta T_s$ is detected in the regime diagram for the packed-bed case, forming a broad range of the convection-limited regime.
4.5. Effects of bed structure in the packed-bed case
In the above simulations only one porosity of the packed bed is considered as  $\psi =0.64$. In practical applications, however, $\psi$ varies among different packed beds by adjusting the packing grain number. Attention is therefore turned to the influence of bed porosity on the $\textrm {CO}_2$ capture performance of CCC. As constructed in Appendix D, a set of bed structures with porosities $\psi \in [0.53, 0.71]$ are utilized. A test with $\Delta T_s = 0.185$ and $Pe = 15.57$ is simulated in these cryogenic beds. The obtained four metrics ( $\phi _{cm}$, $t_e$, $\eta _d$, $v_c$) are plotted in figure 19.

Figure 19. Analyses of  $\textrm {CO}_2$ capture performance in packed-bed tests with the subcooling degree ${\Delta T_s = 0.185}$, Péclet number $Pe = 15.57$ and porosities $\psi \in [0.53, 0.71]$. (a) The maximum volume fraction of solid $\textrm {CO}_2$ ( $\phi _{cm}$) captured by the bed. (b) The operating time for $\textrm {CO}_2$ desublimation and sublimation ( $t_e$). (c) The $\textrm {CO}_2$ capacity loss due to the time delay between the maximum point and the saturation point ( $\eta _d$). (d) The $\textrm {CO}_2$ capture rate ( $v_c$).
As  $\psi$ increases, there is a corresponding reduction in both the solid $\textrm {CO}_2$ captured ( $\phi _{cm}$) and the operating time ( $t_e$). The primary explanation for this trend is that, in a bed with large $\psi$, the fluid mobility is enhanced and the gas stream is accelerated. Similar to a large- $Pe $ test (figure 15), the rapid gas stream leads to the drop in both $\phi _{cm}$ and $t_e$. In the meantime, while comparing to the growing- $Pe $ scenario in figure 15, two distinct findings arise from figure 19. First, with the ascending $\psi$, the $\textrm {CO}_2$ capture rate ( $v_c$) increases at first but changes to decrease after a critical value $\psi _c \approx 0.61$. Different from the continuously growing $v_c$ in figure 15(c), the non-monotonic variations in $v_c$ here are driven by the two competing factors, the optimized flow channels and the diminished cold grain volume. Specifically, in the small- $\psi$ range (i.e. $\psi <\psi _c$), the slow gas stream constrains the $\textrm {CO}_2$ capture rate $v_c$, and the increased $\psi$ accelerates the flue gas flow and $v_c$. In the large- $\psi$ range (i.e. $\psi >\psi _c$), however, the gas stream has been sufficiently enhanced and the limited cold grains turn to dominate the $\textrm {CO}_2$ capture performance of CCC. The continuous rise in $\psi$ diminishes the available cold grains for capturing $\textrm {CO}_2$ and thereby decelerates $v_c$. The second distinct observation from figure 15 is that the $\textrm {CO}_2$ capture capacity loss ( $\eta _d$) changes non-monotonically with $\psi$ and remains within a relatively small level as $\eta _d<15\,\%$. This is because the injected flue gas is fixed at a given $Pe $ and the capacity loss is limited to a certain range. These results help to draw a conclusion that a moderate bed porosity $\psi _c \approx 0.61$ is favourable for the optimal $\textrm {CO}_2$ capture performance of CCC. Compared with $Pe $ and $\Delta T_s$, $\psi$ exerts marginal impacts on the $\textrm {CO}_2$ capture performance. Furthermore, effects of $Pe $ and $\Delta T_s$ are examined at a porosity 0.64 in this study, which aligns with the recommended $\phi _c$. Given these considerations, explorations into impacts of $Pe $ and $\Delta T_s$ at other porosity values are deemed unnecessary for the scope of this study.
Overall, for a wide range of operating parameters (i.e. gas velocity, initial bed temperature and bed structures),  $\textrm {CO}_2$ desublimation and sublimation during CCC have been investigated both on a single packing grain and in a packed bed. The general $\textrm {CO}_2$ desublimation and sublimation properties during the capture and recovery of CCC are successfully reproduced, which corroborate experimental observations (Tuinier et al. Reference Tuinier, van Sint Annaland, Kramer and Kuipers2010; Ali et al. Reference Ali, Maqsood, Syahera, Shariff and Ganguly2014). Furthermore, the quantitative analyses and parametric studies shed light on the underlying physics of CCC and also suggest optimal operating conditions.
5. Conclusions
In this work, an MRT LB model has been proposed for simulating  $\textrm {CO}_2$ desublimation and sublimation during CCC at the pore scale. Compared with our previous study on $\textrm {CO}_2$ desublimation (Lei et al. Reference Lei, Luo, Hernández Pérez, Wang, Wang, Restrepo Cano and Im2023), this work newly considers $\textrm {CO}_2$ sublimation, consumption of the SCL, packed bed comprising multiple grains and non-isothermal grains over time. The performance of CCC is evaluated for different operating conditions, i.e. the initial bed temperature $T_w$, gas feed rate $u_0$ and bed structure. These conditions are characterized by dimensionless parameters such as the subcooling degree $\Delta T_s$, Péclet number $Pe $ and bed porosity $\psi$.
In the single-grain case, a test is firstly performed to reproduce  $\textrm {CO}_2$ desublimation and sublimation properties. After injection, the flue gas is cooled and its component $\textrm {CO}_2$ is desublimated to generate the SCL on the grain surface. Meanwhile, the grain is heated and the SCL is sublimated for collection. A parametric study is set out to examine effects of $\Delta T_s$ and $Pe $. Following the rise in $Pe $ at a constant $\Delta T_s$, the $\textrm {CO}_2$ capture rate ( $v_c$) increases at first but remains almost unchanged after a critical value $Pe _c$. These two successive stages are dominated by the weak convection and limited desublimation, respectively. Accordingly, distributions of the convection-limited (I) and desublimation-limited (II) regimes are identified in a $\Delta T_s$– $Pe $ space, with critical values ( $\Delta T_{sc}$, $Pe _c$) located on the regime boundary. In regime I ( $\Delta T_s>\Delta T_{sc}$, $Pe <Pe _c$) the growing $\Delta T_s$ and $Pe $ contribute to accelerating $v_c$ but within a limited range. In regime II ( $\Delta T_s<\Delta T_{sc}$, $Pe >Pe _c$) the optimal $\textrm {CO}_2$ capture performance (i.e. large $v_c$) is obtained and $v_c$ grows monotonically with $\Delta T_s$ as $v_c=22.56\Delta T_s-0.76$. The non-isothermal grain yields the decreased desublimation rate over time, thereby producing different controlling regimes and $\textrm {CO}_2$ capture performance compared with our earlier study (Lei et al. Reference Lei, Luo, Hernández Pérez, Wang, Wang, Restrepo Cano and Im2023).
On the other hand, packed-bed tests are conducted for various  $\Delta T_s$, $Pe $ and $\psi$, yielding $\textrm {CO}_2$ desublimation and sublimation properties, as well as the two controlling regimes (i.e. convection-limited (I) and desublimation-limited (II) regimes). A parametric study is performed to evaluate the $\textrm {CO}_2$ capture performance in terms of $v_c$ and $\eta _d$ (i.e. $\textrm {CO}_2$ capture capacity loss). The increasing $\Delta T_s$ and $Pe $ substantially enhance $v_c$ across all examined packed-bed tests, following a correction $v_c=(0.02Pe -0.19)\ln (\Delta T_s-0.024)+(0.083Pe -0.37)$. This is driven by the existence of multiple grains that offer a substantial cold surface for capturing $\textrm {CO}_2$. Subsequently, the convective $\textrm {CO}_2$ supply is insufficient and CCC operates in regime I. In addition, either a diminished $\Delta T_s$ or an elevated $Pe $ is found to result in the decreased desublimation rate relative to the convective $\textrm {CO}_2$ supply, thus exacerbating $\eta _d$ and bringing about regime II. By analysing $v_c$ and $\eta _d$, a regime diagram is constructed to delineate distributions of regimes I and II in a $\Delta T_s$– $Pe $ space, together with the regime boundary and threshold values ( $\Delta T_{sc}$, $Pe _c$). In contrast to the single-grain scenario, regime I is broadened because the multiple cold grains require amplified convection, and regime I is more advantageous due to the diminished $\eta _d$. Finally, following the growing $\psi$, $\eta _d$ changes slightly and $v_c$ varies non-monotonically with a peak value at $\psi _c \approx 0.61$. This is attributed to the two competing mechanisms introduced by the ascending $\psi$: improved fluid mobility and decreased cold grain areas. To optimize the performance of CCC (i.e. large $v_c$ and small $\eta _d$) within regime I, it is recommended to pursue the high $Pe $, large $\Delta T_s$ and moderate $\psi _c$. In both the single-grain and packed cases, a high $\Delta T_s$ should be exercised with caution since it boosts the cooling duty significantly.
To conclude, the proposed LB model is successful in reproducing  $\textrm {CO}_2$ desublimation and sublimation properties during CCC, over extensive operating conditions. For the operation of CCC, the present findings advance the knowledge base and offer valuable insights into the underlying physics. This study thus illustrates the LB modelling capability to facilitate the optimization and commercial development of CCC, which is a promising technology for combating climate change. For a thorough evaluation of CCC performance, future research should incorporate an in-depth analysis of the cooling step. This would entail a detailed assessment of the cryogenic temperature by taking into account the cooling duty. Furthermore, given the multicomponent nature of flue gas emitted from industrial processes, it is imperative to investigate the transport of multiple gaseous components, e.g. $\textrm {CO}_2$, $\textrm {N}_2$, $\textrm {H}_2\textrm {O}$, $\textrm {CH}_4$. The interplay between these components, coupled with their distinct freezing points, may affect the optimal operational conditions. Additionally, due to the presence of $\textrm {H}_2\textrm {O}$, the incorporation of a dehydration unit prior to $\textrm {CO}_2$ purification is necessary, and an evaluation of its impact on CCC performance is essential.
Supplementary material
Supplementary material is available at https://doi.org/10.1017/jfm.2024.351.
Funding
This work was supported by the UK Engineering and Physical Sciences Research Council (EPSRC) under the grant no. EP/W026260/1, as well as by King Abdullah University of Science and Technology (KAUST). ARCHER2 supercomputing resources provided by EPSRC under the project ‘UK Consortium on Mesoscale Engineering Sciences (UKCOMES)’ (grant no. EP/X035875/1) are gratefully acknowledged. This work made use of computational support by CoSeC, the Computational Science Centre for Research Communities, through UKCOMES.
Declaration of interests
The authors report no conflict of interest.
Appendix A. Transformation details in the MRT model
Our earlier research suggested that 2-D simulations are adequate for examining  $\textrm {CO}_2$ desublimation regimes (Lei et al. Reference Lei, Luo, Hernández Pérez, Wang, Wang, Restrepo Cano and Im2023). Building upon this premise, this study is dedicated to modelling $\textrm {CO}_2$ desublimation and sublimation during CCC in two dimensions. Accordingly, the 2-D nine-velocity scheme of the proposed MRT LB model is employed for simulations. The discrete velocities $\boldsymbol {e}_i$ and weight coefficients $w_i$ are (Guo & Shu Reference Guo and Shu2013)
 \begin{equation} \left. \begin{array}{ll} \boldsymbol{e}_i= e \left( 0,\ 0 \right), & w_i=4/9, \ i=0,\\ \boldsymbol{e}_i= e \left( \cos\dfrac{(i-1){\rm \pi}}{2}, \sin\dfrac{(i-1){\rm \pi}}{2} \right), & w_i=1/9, \ i=1-4,\\ \boldsymbol{e}_i= \sqrt{2} e \left( \cos\dfrac{(2i-1){\rm \pi}}{4}, \sin\dfrac{(2i-1){\rm \pi}}{4} \right), & w_i=1/36, \ i=5-8, \end{array} \right\} \end{equation}
with  $e=1$ in this study. To reduce compressibility errors, the equilibrium distribution functions are given as (Lei et al. Reference Lei, Luo, Hernández Pérez, Wang, Wang, Restrepo Cano and Im2023)
 \begin{gather} f_i^{eq} = w_i \left[\rho_g + \rho_p \left( \frac{\boldsymbol{e}_i \boldsymbol{\cdot} \boldsymbol{u}}{c_s^2} + \frac{\left(\boldsymbol{e}_i \boldsymbol{\cdot} \boldsymbol{u}\right)^2}{2 c_s^4} - \frac{\boldsymbol{u}^2}{2 c_s^2} \right) \right], \end{gather}
 \begin{gather} g_i^{eq} = w_i Y \left[ 1 + \frac{\boldsymbol{e}_i \boldsymbol{\cdot} \boldsymbol{u}}{c_s^2} + \frac{\left(\boldsymbol{e}_i \boldsymbol{\cdot} \boldsymbol{u}\right)^2}{2 c_s^4} - \frac{\boldsymbol{u}^2}{2 c_s^2} \right], \end{gather}
 \begin{gather} h_{i}^{eq} = w_i T \left[ 1 + \frac{\boldsymbol{e}_i \boldsymbol{\cdot} \boldsymbol{u}}{c_s^2} + \frac{\left(\boldsymbol{e}_i \boldsymbol{\cdot} \boldsymbol{u}\right)^2}{2 c_s^4} - \frac{\boldsymbol{u}^2}{2 c_s^2} \right]. \end{gather}
To avoid discrete lattice effects, the distribution function  $\bar {F}_{T,i}$ is (Guo & Zhao Reference Guo and Zhao2002; Shi & Guo Reference Shi and Guo2009)
 \begin{equation} \bar{F}_{T,i} = w_i F_T \left( 1 + \frac{\boldsymbol{e}_i\boldsymbol{\cdot}\boldsymbol{u}}{c_s^2} \frac{\tau_t-0.5}{\tau_t} \right), \end{equation}
with  $\tau _t$ being the relaxation time.
The transformation matrix  ${{\boldsymbol{\mathsf{M}}}}$ is
 \begin{equation} {{\boldsymbol{\mathsf{M}}}}= \left[ \begin{array}{cccccccccc} 1 & 1 & 1 & 1 & 1 & 1 & 1 & 1 & 1 \\ -4 & -1 & -1 & -1 & -1 & 2 & 2 & 2 & 2 \\ 4 & -2 & -2 & -2 & -2 & 1 & 1 & 1 & 1 \\ 0 & 1 & 0 & -1 & 0 & 1 & -1 & -1 & 1 \\ 0 & -2 & 0 & 2 & 0 & 1 & -1 & -1 & 1 \\ 0 & 0 & 1 & 0 & -1 & 1 & 1 & -1 & -1 \\ 0 & 0 & -2 & 0 & 2 & 1 & 1 & -1 & -1 \\ 0 & 1 & -1 & 1 & -1 & 0 & 0 & 0 & 0 \\ 0 & 0 & 0 & 0 & 0 & 1 & -1 & 1 & -1 \\ \end{array} \right], \end{equation} ${{\boldsymbol{\mathsf{M}}}}$ maps distribution functions from the physical space $\boldsymbol {\psi }$ to the moment space as $\boldsymbol {\hat {\psi }} = {{\boldsymbol{\mathsf{M}}}} \boldsymbol {\cdot } \boldsymbol {\psi }$. With this transformation, evolution equations (3.3)–(3.5) are performed in the moment space as
 \begin{gather} \boldsymbol{\hat{f}}\left( \boldsymbol{x} + \boldsymbol{e}_i \delta _t, t + \delta _t \right) = \boldsymbol{\hat{f}} \left(\boldsymbol{x}, t\right) - {{\boldsymbol{\mathsf{S}}}}\left[ \boldsymbol{\hat{f}} \left( \boldsymbol{x}, t \right) - \boldsymbol{\hat{f}}^{eq} \left( \boldsymbol{x}, t \right) \right], \end{gather}
 \begin{gather} \boldsymbol{\hat{g}} \left( \boldsymbol{x} + \boldsymbol{e}_i \delta _t, t + \delta _t \right) = \boldsymbol{\hat{g}} \left(\boldsymbol{x}, t \right) - {{\boldsymbol{\mathsf{S}}}}_y \left[ \boldsymbol{\hat{g}} \left( \boldsymbol{x},t \right) - \boldsymbol{\hat{g}}^{eq} \left( \boldsymbol{x}, t \right) \right], \end{gather}
 \begin{gather} \boldsymbol{\hat{h}} \left( \boldsymbol{x} + \boldsymbol{e}_i \delta _t, t + \delta _t \right) = \boldsymbol{\hat{h}} \left(\boldsymbol{x}, t \right) - {{\boldsymbol{\mathsf{S}}}}_t \left[ \boldsymbol{\hat{h}} \left( \boldsymbol{x}, t \right) - \boldsymbol{\hat{h}}^{eq} \left( \boldsymbol{x}, t \right) \right] + \delta _t \boldsymbol{\hat{F}}_{T} + 0.5\delta _t^ 2\partial_t \boldsymbol{\hat{F}}_{T}. \end{gather}
 Through the Chapman–Enskog analysis on the proposed LB equations, the governing equations can be recovered with the relaxation times  $\tau$, $\tau _y$ and $\tau _t$ being
 \begin{equation} \nu = c_s^2\left( \tau - 0.5 \right) \delta _t, \quad D = c_s^2 \left(\tau_y- 0.5 \right)\delta _t, \quad \alpha = c_s^2 \left(\tau_t - 0.5 \right)\delta _t, \end{equation}
as well as the gradient terms of temperature ( $\boldsymbol {\nabla } T$) being (Lei, Meng & Guo Reference Lei, Meng and Guo2017; Lei et al. Reference Lei, Wang and Luo2021)
 \begin{equation} \boldsymbol{\nabla}_x T ={-}\frac{\hat{h}_3 - Tu + 0.5\delta_t F_{T} u}{c_s^2\tau_t\delta_t}, \quad \boldsymbol{\nabla}_y T ={-}\frac{\hat{h}_5 - Tv + 0.5\delta_t F_{T}v}{c_s^2\tau_t\delta_t}. \end{equation}
Except for these calculations, the gradient term in (3.2a–c) is determined by using the isotropic central scheme as (Guo, Zheng & Shi Reference Guo, Zheng and Shi2011)
 \begin{equation} \boldsymbol{\nabla} \left( \rho c_p \right) = \sum_i \frac{w_i \boldsymbol{e}_i \rho c_p \left( \boldsymbol{x} + \boldsymbol{e}_i \delta _t \right)}{c_s^2 \delta_t}. \end{equation}
It is emphasized that the proposed MRT LB model can be easily extended to three dimensions through the modification of discrete velocities  $\boldsymbol {e}_i$, weight coefficients $w_i$ and the transformation matrix ${{\boldsymbol{\mathsf{M}}}}$ into their three-dimensional (3-D) counterparts. More details of 3-D models and simulation results can be found in Appendix E, which demonstrated that the $\textrm {CO}_2$ desublimation and sublimation properties are comparable in both 2-D and 3-D simulations.
Appendix B. Boundary treatment
Boundary conditions at the four external boundaries of the computational domain in figure 2 are set as follows. First, from the inlet ( $x=0$), the flue gas is fed into the domain at a given operating condition. The gas compositions, temperature, pressure and velocity are accordingly set as specified values. Then, at the outlet ( $x=l_x$), a fully developed flow is considered so that the flue gas flows out freely. The zero-gradient velocity and the no-flux temperature and mass fractions are applied there. Finally, at the bottom ( $y=0$) and top ( $y=l_y$), the periodic conditions are imposed. These boundaries are mathematically described by
 \begin{gather} x=0: \quad u = u_0, v = 0, Y = Y_0, T = T_0, \end{gather}
 \begin{gather} x = l_x: \quad \boldsymbol{\nabla} u = \boldsymbol{\nabla} v = \boldsymbol{0}, \boldsymbol{\nabla} Y = \boldsymbol{0}, \boldsymbol{\nabla} T = \boldsymbol{0}, \end{gather}
 \begin{gather} y=0,l_y: \quad \boldsymbol{u}_{y=0} = \boldsymbol{u}_{y=l_y}, Y_{y=0} =Y_{y=l_y}, T_{y=0} =T_{y=l_y}. \end{gather}
To obtain enclosing solutions of (2.8)–(2.10) and (3.1), these external boundaries should be implemented by applying LB boundary schemes. At the inlet (B1) and the outlet (B2), the non-equilibrium extrapolation boundary scheme is utilized to reconstruct the unknown distribution functions (Guo & Shu Reference Guo and Shu2013). At the periodic top and bottom boundaries (B3), the outgoing distribution functions from the top re-enter the domain from the bottom, and vice versa (Guo & Shu Reference Guo and Shu2013).
On the other hand, at the internal inactive gas–solid interface  $I_n$ without $\textrm {CO}_2$ desublimation and sublimation, the no-flux condition is applied for mass conservation. Thus, the boundary conditions are
 \begin{gather} \boldsymbol{u}^{I_n} = \left( 0, 0 \right), \end{gather}
 \begin{gather} \boldsymbol{\nabla} Y^{I_n} = 0, \end{gather}
 \begin{gather} \left. \begin{gathered} T^{I_n,+} =T^{I_n,-}, \\ \boldsymbol{n} \boldsymbol{\cdot} \left(k \boldsymbol{\nabla} T +\rho c_p \boldsymbol{u} T \right)^{I_n,+} = \boldsymbol{n} \boldsymbol{\cdot} \left(k \boldsymbol{\nabla} T +\rho c_p \boldsymbol{u} T \right) ^{I_n,-}. \end{gathered} \right\} \end{gather}
 The LB boundary schemes are built to enforce the internal interface  $I_n$ without $\textrm {CO}_2$ desublimation and sublimation (i.e. (B4)–(B6)). The no-slip velocity in (B4) and the conjugate heat transfer in (B6) are achieved as conducted at active interface $I_{d,s}$ in § 3.2. Differently, the no-flux mass fraction in (B5) is enforced by the halfway bounce-back scheme. For addressing the no-slip velocity and no-flux mass fraction conditions, the unknown distribution functions are calculated as (Zhang et al. Reference Zhang, Shi, Guo, Chai and Lu2012)
 \begin{gather} f_{\bar{\imath} }\left( \boldsymbol{x}_g, t + \delta _t \right) = f'_i \left( \boldsymbol{x}_g, t \right), \end{gather}
 \begin{gather} g_{\bar{\imath} }\left( \boldsymbol{x}_g, t + \delta _t \right) = g'_i \left( \boldsymbol{x}_g, t \right). \end{gather}
Appendix C. Model validation
For simulating  $\textrm {CO}_2$ desublimation during CCC, we have recently developed an LB model (Lei et al. Reference Lei, Luo, Hernández Pérez, Wang, Wang, Restrepo Cano and Im2023). As an extension, the present LB model newly introduces the sublimation of solid $\textrm {CO}_2$ and the variation of packing grains’ temperature. In our recent work, benchmark problems with widely accepted or analytical solutions have been simulated to test key sub-models of the proposed LB model, including the boundary scheme for mass conservation at the active fluid–solid interface, the source term for conjugate heat transfer and the VOP scheme for updating solid $\textrm {CO}_2$ (Lei et al. Reference Lei, Luo, Hernández Pérez, Wang, Wang, Restrepo Cano and Im2023). For brevity, these validation details are not repeatedly introduced here. Therefore, we focus on testing the newly introduced $\textrm {CO}_2$ sublimation and temperature variations of packing grains in this section. The $\textrm {CO}_2$ desublimation and sublimation in a packed bed fed with flue gas is considered. A cryogenic bed is introduced as shown in figure 20(a). The computational domain is $0\leq x \leq l_x$ and $0\leq y \leq l_y$, which is packed with multiple grains. From the left inlet, the flue gas is injected into the bed at the initial condition $(T_0, Y_0, u_0, p_0 )$. The injected $\textrm {CO}_2$ deposits on the surface of packing grains and the bed gradually becomes heated by the injected flue gas. Once the bed reaches saturation, the injected $\textrm {CO}_2$ leaves the domain from the right outlet without phase change.

Figure 20. Model validation of  $\textrm {CO}_2$ desublimation and sublimation in a cryogenic packed bed with the flue gas feed flow. (a) Computational domain and boundary conditions. Comparison of the outgoing $\textrm {CO}_2$ content between the present numerical results and the experimental measurements in Ali et al. (Reference Ali, Maqsood, Syahera, Shariff and Ganguly2014) for (a) counter-current flow configuration and (b) co-current flow configuration.
Based on such a system, we simulate the  $\textrm {CO}_2$ desublimation and sublimation processes. Our simulations consider both the counter-current and co-current flow configurations in § 3.1 of Ali et al. (Reference Ali, Maqsood, Syahera, Shariff and Ganguly2014), with which the same desublimation and sublimation conditions are selected. Specifically, the bed size $l_x\times l_y = 0.46\, \textrm {m} \times 0.0418\, \textrm {m}$, the porosity ${\psi =0.637}$, the inlet flue gas temperature $T_0=293\, \textrm {K}$, the inlet $\textrm {CO}_2$ mass fraction $Y_0=1$ and the gas pressure $p_0=1\, \textrm {atm}$. From the inlet to the outlet, the initial bed temperature $T_w$ decreases for the counter-current flow configuration and increases for the co-current flow configuration. The thermophysical properties of the gas and the solid phases are set as in our simulations in § 4. A mesh of size $500\times 5500$ is applied. The outgoing $\textrm {CO}_2$ at the outlet is recorded and compared with experimental data in Ali et al. (Reference Ali, Maqsood, Syahera, Shariff and Ganguly2014) to examine the reliability of the present LB model. The calculated outgoing $\textrm {CO}_2$ are plotted against time in figure 20(b,c). As can be seen, the present LB model can reproduce the same $\textrm {CO}_2$ capture performance as the experiments for different flow configurations. Therefore, it demonstrates that the present LB model is accurate for simulating the $\textrm {CO}_2$ desublimation and sublimation in a packed bed.
Appendix D. Simulation parameters
For simulations of  $\textrm {CO}_2$ desublimation and sublimation in this study, the range of initial bed temperature $T_w \in [80\,\textrm {K}$, $180\,\textrm {K}]$ and the range of gas injection velocity $u_0 \in [1.22\times 10^{-3} \, \textrm {m}\,\textrm {s}^{-1}$, $6.10\times 10^{-2} \, \textrm {m}\,\textrm {s}^{-1}]$ are covered. The corresponding subcooling degree of the packing grain $\Delta T_s = (T_f-T_w)/T_0$ and Péclet number $Pe =(l_y u_0)/D$ are listed in table 2.
In order to explore effects of the packed bed porosity ( $\psi$) on the performance of CCC, a series of packed bed structures are considered. As shown in figure 21, different 2-D structures are constructed to represent cross-sections of 3-D packed beds along the gas flow direction. Based on these artificially produced profiles, effects of packed bed structure are explored. All bed cross-sections consist of regularly distributed packing grains and share the same domain size and grain diameter, namely, length $l_x=124.8\, \textrm {mm}$, width $l_y=20.8\, \textrm {mm}$ and grain diameter $l_d=10.0\,\textrm {mm}$; however, they vary in grain distributions ( $r_x,\ r_y$) to generate different porosities $\psi$. Key parameters are provided in table 2. Note that, in accordance with the previous experimental set-up (Ali et al. Reference Ali, Maqsood, Syahera, Shariff and Ganguly2014), all cryogenic beds considered in this study are filled with glass packing materials. Other packing materials characterized by the higher $\rho c_{p,c}$ and smaller $\alpha _c$ are expected to improve the $\textrm {CO}_2$ capture performance of CCC.

Figure 21. The schematic diagrams of the cryogenic packed bed.
Appendix E. Comparison between 2-D and 3-D simulations
This research focuses on simulating the desublimation and sublimation of  $\textrm {CO}_2$ during CCC in two dimensions. To validate that the current 2-D results are applicable to 3-D implementations of CCC, this section extends the proposed LB model to simulate 3-D processes of $\textrm {CO}_2$ desublimation and sublimation. Accordingly, the discrete velocities $e_i$, weight coefficients $w_i$ and the transformation matrix ${{\boldsymbol{\mathsf{M}}}}$ are set as their 3-D counterparts (Lei et al. Reference Lei, Luo, Hernández Pérez, Wang, Wang, Restrepo Cano and Im2023).
 \begin{gather} \boldsymbol{e}_i =e \left[ \begin{array}{@{}ccccccccccccccc@{}} 0 & 1 & -1 & 0 & 0 & 0 & 0 & 1 & -1 & 1 & -1 & 1 & -1 & -1 & 1 \\ 0 & 0 & 0 & 1 & -1 & 0 & 0 & 1 & -1 & 1 & -1 & -1 & 1 & 1 & -1 \\ 0 & 0 & 0 & 0 & 0 & 1 & -1 & 1 & -1 & -1 & 1 & 1 & -1 & 1 & -1 \end{array} \right], \end{gather}
 \begin{gather} w_i =\begin{cases} 2/9, & i=0,\\ 1/9, & i=1\unicode{x2013}6,\\ 1/72, & i=7\unicode{x2013}14, \end{cases} \end{gather}
 \begin{gather} \boldsymbol{M}= \left[ \begin{array}{@{}ccccccccccccccc@{}} 1 & 1 & 1 & 1 & 1 & 1 & 1 & 1 & 1 & 1 & 1 & 1 & 1 & 1 & 1 \\ -2 & -1 & -1 & -1 & -1 & -1 & -1 & 1 & 1 & 1 & 1 & 1 & 1 & 1 & 1 \\ 16 & -4 & -4 & -4 & -4 & -4 & -4 & 1 & 1 & 1 & 1 & 1 & 1 & 1 & 1 \\ 0 & 1 & -1 & 0 & 0 & 0 & 0 & 1 & -1 & 1 & -1 & 1 & -1 & 1 & -1 \\ 0 & -4 & 4 & 0 & 0 & 0 & 0 & 1 & -1 & 1 & -1 & 1 & -1 & 1 & -1 \\ 0 & 0 & 0 & 1 & -1 & 0 & 0 & 1 & 1 & -1 & -1 & 1 & 1 & -1 & -1 \\ 0 & 0 & 0 & -4 & 4 & 0 & 0 & 1 & 1 & -1 & -1 & 1 & 1 & -1 & -1 \\ 0 & 0 & 0 & 0 & 0 & 1 & -1 & 1 & 1 & 1 & 1 & -1 & -1 & -1 & -1 \\ 0 & 0 & 0 & 0 & 0 & -4 & 4 & 1 & 1 & 1 & 1 & -1 & -1 & -1 & -1 \\ 0 & 2 & 2 & -1 & -1 & -1 & -1 & 0 & 0 & 0 & 0 & 0 & 0 & 0 & 0 \\ 0 & 0 & 0 & 1 & 1 & -1 & -1 & 0 & 0 & 0 & 0 & 0 & 0 & 0 & 0 \\ 0 & 0 & 0 & 0 & 0 & 0 & 0 & 1 & -1 & -1 & 1 & 1 & -1 & -1 & 1 \\ 0 & 0 & 0 & 0 & 0 & 0 & 0 & 1 & 1 & -1 & -1 & -1 & -1 & 1 & 1 \\ 0 & 0 & 0 & 0 & 0 & 0 & 0 & 1 & -1 & 1 & -1 & -1 & 1 & -1 & 1 \\ 0 & 0 & 0 & 0 & 0 & 0 & 0 & 1 & -1 & -1 & 1 & -1 & 1 & 1 & -1 \\ \end{array} \right]. \end{gather}
 Using this 3-D 15-velocity LB model, the single-grain test in § 4.1 is re-simulated within a computational domain of  $l_{sx}\times l_{sy} \times l_{sz} = 14.7\, \textrm {mm} \times 14.7\, \textrm {mm} \times 0.7\, \textrm {mm}$ (i.e. $640\times 640\times 30$). The boundary and operating conditions are set as described in § 4.1, incorporating periodic conditions along the $z$ axis. The $\textrm {CO}_2$ desublimation and sublimation properties are provided in figure 22, which details both the volume fraction of the captured solid $\textrm {CO}_2$ ( $\phi _c$) and the contours of solid $\textrm {CO}_2$.

Figure 22. Comparison between 2-D and 3-D simulations. Temporal evolutions of (a) volume fraction of the captured solid  $\textrm {CO}_2$ ( $\phi _c$) and (b) contours of solid CO $_2$.
$_2$.
The simulation results show that the  $\textrm {CO}_2$ desublimation and sublimation characteristics observed in 2-D simulations align with those from 3-D simulations. Both 2-D and 3-D simulations capture the generation and consumption of solid $\textrm {CO}_2$, successfully identify the peak value of solid $\textrm {CO}_2$ and reproduce the $\textrm {CO}_2$ capture and recovery steps of CCC. Besides these shared characteristics, minor variances are also noted between the 2-D and 3-D outcomes. As explained in Lei et al. (Reference Lei, Luo, Hernández Pérez, Wang, Wang, Restrepo Cano and Im2023), the extra reaction surface and growth direction introduced by the 3-D structure are responsible for these discrepancies. However, the 2-D simulation effectively replicates the $\textrm {CO}_2$ capture and recovery phases of CCC, thus confirming the credibility of the current study.


 Open access