


1. Introduction
A characteristic feature of any turbulent flow is the broad range of scales, or ‘eddies’, which carry the total kinetic energy. The eddies are coupled with each other nonlinearly, and this nonlinear ‘cross-talk’ across the energy spectrum is the cornerstone for the energy transfer process in a turbulent flow. Since the nonlinearity in the governing Navier–Stokes equations is quadratic, this inter-scale coupling is, by definition, triadic in nature (Duvvuri & McKeon Reference Duvvuri and McKeon2015). Here, triadically coupled eddies correspond to the scenario when the time scales ( $T_{i}$) of any three eddies (say
  $l$,
$l$,  $m$ and
  $n$) are related via either of the four relationships:
 \begin{equation} ({\rm i})\ {\omega_l=\omega_m-\omega_n},\quad ({\rm ii})\ {\omega_l=\omega_m+\omega_n},\quad ({\rm iii})\ {\omega_l=2\omega_m},\quad ({\rm iv})\ {\omega_l=2\omega_n}, \end{equation}
where the frequencies  $\omega _i=2{\rm \pi} /T_i$.
In the case of wall-bounded turbulent flows, the nature of inter-scale coupling has been verified previously through a set of experiments and analysis by McKeon and co-workers (Jacobi & McKeon Reference Jacobi and McKeon2013, Reference Jacobi and McKeon2017; Duvvuri & McKeon Reference Duvvuri and McKeon2015, Reference Duvvuri and McKeon2017). The experiments involved artificial excitation of a large outer-scaled eddy, which spanned the boundary layer (consider for instance, eddy  $l$ in figure 1), by imposition of an oscillatory forcing via a dynamic roughness element. Statistical analysis of the velocity signals acquired within this perturbed boundary layer confirmed the influence of this forcing (with time scale,
  $T_{l}$) on the corresponding small inner-scaled eddies
  $m$ and
  $n$ (figure 1a), which are triadically coupled with
  $l$. This coupling, or ‘cross-talk’, was found to be facilitated by a phase locking of the synthetic scale (
 ${\psi }_{l}$) and the average triadic ‘envelope’ of the small scales (
 ${\psi }_{{\epsilon }(m,n)}$), where
  ${\psi }_{i}$ and
  ${\epsilon }$ respectively denote the phase and the envelope (Mathis, Hutchins & Marusic Reference Mathis, Hutchins and Marusic2009).

Figure 1. (a) Schematic representation of triadically coupled eddies ( $l,m,n$) with time scales
  $T_{l}$,
  $T_{m}$,
  $T_{n}$ and phases
  ${\psi }_{l}$,
  ${\psi }_{m}$,
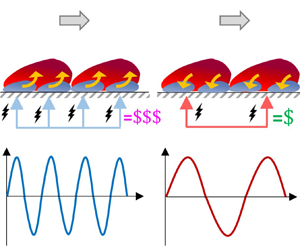
  ${\psi }_{n}$, respectively. (b) Schematic of the spanwise wall-actuation scheme investigated by Marusic et al. (Reference Marusic, Chandran, Rouhi, Fu, Wine, Holloway, Chung and Smits2021) and others. The terminology is discussed in § 1.
As discussed by Duvvuri & McKeon (Reference Duvvuri and McKeon2015) and Jacobi & McKeon (Reference Jacobi and McKeon2017), this inter-scale coupling offers an opportunity to control and manipulate the near-wall inner scales (Jiménez & Moin Reference Jiménez and Moin1991; Waleffe, Kim & Hamilton Reference Waleffe, Kim and Hamilton1993; Hamilton, Kim & Waleffe Reference Hamilton, Kim and Waleffe1995; Jiménez & Pinelli Reference Jiménez and Pinelli1999) by exciting the triadically coupled outer scales, with potential implications for drag reduction. For instance, the inner-scaled eddies near the wall are a major contributor to the total skin-friction drag across the practically relevant Reynolds-number range (Deck et al. Reference Deck, Renard, Laraufie and Weiss2014; Chandran et al. Reference Chandran, Zampiron, Rouhi, Fu, Wine, Holloway, Smits and Marusic2023). It is challenging, however, to actuate these eddies owing to their very small time/length scales in physical units (Quadrio & Ricco Reference Quadrio and Ricco2011; Ricco, Skote & Leschziner Reference Ricco, Skote and Leschziner2021). Alternatively, it may be possible to leverage the coupling between the turbulent scales to indirectly attenuate these drag contributing inner scales through their triadically coupled outer scales.
In the present study, we test this idea by considering the flow-control approach of imposing spanwise wall oscillations (Akhavan, Jung & Mangiavacchi Reference Akhavan, Jung and Mangiavacchi1993; Baron & Quadrio Reference Baron and Quadrio1995; Choi, DeBisschop & Clayton Reference Choi, DeBisschop and Clayton1998; Karniadakis & Choi Reference Karniadakis and Choi2003; Quadrio, Ricco & Viotti Reference Quadrio, Ricco and Viotti2009; Agostini, Touber & Leschziner Reference Agostini, Touber and Leschziner2014; Ricco et al. Reference Ricco, Skote and Leschziner2021), wherein the oscillating wall elements are synchronised to generate an upstream travelling wave with respect to the mean flow direction. Figure 1(b) schematically describes this control strategy, where the instantaneous spanwise velocity ( $w_{wall}$) imposed on the wall is given by:
  ${w_{wall}}(x,t)={A}\sin ({{\kappa }_{x}}x-\omega _{osc} t)$. Here,
  $T_{osc}=2 {\rm \pi}/\omega _{osc}$ and
  $A$ are the time period and amplitude of the spanwise oscillation, respectively;
  ${\kappa }_{x}= 2{\rm \pi} /{\lambda }$ is the streamwise wavenumber of the travelling wave where
  $\lambda$ is the wavelength;
  $t$ denotes time; and
  $u$,
$u$,  $v$ and
  $w$ denote the velocity fluctuations along the streamwise (
 $x$), wall-normal (
 $y$) and spanwise (
 $z$) directions, respectively. This approach of imposing spanwise oscillations on the wall has been investigated extensively (refer to Ricco et al. (Reference Ricco, Skote and Leschziner2021) and references therein), predominantly for its ability to achieve significant drag reduction (DR) through actuating the near-wall inner-scaled motions having a characteristic viscous-scaled time scale of
  $T^+ \approx 100$, which we refer to here as the inner-scaled actuation (ISA) strategy (Rouhi et al. Reference Rouhi, Fu, Chandran, Zampiron, Smits and Marusic2023). These investigations have mostly been limited to low-Reynolds-number flows, for which the inner scales are the dominant (if not sole) contributors to the total drag (Schoppa & Hussain Reference Schoppa and Hussain2002; Kim Reference Kim2011). Oscillating these wall elements at the associated small time scales (
 $T_{osc}^+ \lesssim 100$), however, incurs a large power cost (
 ${\propto }({T_{osc}})^{-({5}/{2})}$; Quadrio & Ricco Reference Quadrio and Ricco2011), making net power savings from the ISA strategy less likely (Rouhi et al. Reference Rouhi, Fu, Chandran, Zampiron, Smits and Marusic2023). Considering the inverse relationship between power cost and oscillation time period, previous studies performed at low Reynolds numbers (Gatti & Quadrio Reference Gatti and Quadrio2016; some cases in Marusic et al. Reference Marusic, Chandran, Rouhi, Fu, Wine, Holloway, Chung and Smits2021) have attempted to reduce skin-friction drag by targeting the outer scales, associated with large
  $T^+_{osc}$. However, these attempts were proven less effective at such low Reynolds numbers, wherein the contributions of outer scales to the skin-friction drag are statistically insignificant (Chandran et al. Reference Chandran, Zampiron, Rouhi, Fu, Wine, Holloway, Smits and Marusic2023). Based on the premise that outer-scale contributions to the turbulent skin friction increase with Reynolds number, Marusic et al. (Reference Marusic, Chandran, Rouhi, Fu, Wine, Holloway, Chung and Smits2021) demonstrated that large-time scale spanwise wall actuation targeting these outer scales can, however, yield DR for a sufficiently high-Reynolds-number flow. More importantly, this outer-scaled actuation (OSA) strategy (Chandran et al. Reference Chandran, Zampiron, Rouhi, Fu, Wine, Holloway, Smits and Marusic2023) required considerably lower input power, thereby yielding DR with net power savings. The exact mechanism behind this new DR strategy, however, remains unknown.
The present study investigates whether this energy-efficient DR via the OSA strategy is facilitated by the manipulation of the inter-scale phase of the triadically coupled inner and outer scales. To this end, statistical analysis, based on the arguments of McKeon and co-workers (Duvvuri & McKeon Reference Duvvuri and McKeon2015; Jacobi & McKeon Reference Jacobi and McKeon2017), is conducted on the experimental data of Chandran et al. (Reference Chandran, Zampiron, Rouhi, Fu, Wine, Holloway, Smits and Marusic2023). The same analysis is also extended for the ISA strategy to confirm whether the triadically coupled scales can be influenced from either end of the frequency spectrum. Following Marusic et al. (Reference Marusic, Chandran, Rouhi, Fu, Wine, Holloway, Chung and Smits2021), we consider oscillation periods,  $T^+_{osc}\lesssim 350$ to be associated with the ISA strategy, and
  $T^+_{osc}\gtrsim 350$ with the OSA strategy, where
  $T^+_{c}=350$ is taken to be the nominal demarcation between inner and outer scales.
2. Experimental data
All experiments reported in this study were performed in the large wind tunnel (HRNBLWT) at the University of Melbourne. It features a  $3\,{\rm m}\times 1\,{\rm m}$ (length
  $\times$ width) floating element balance (figure 1b) located at
  $19.5\,\mathrm {m} \lesssim \times \lesssim 22.5\,\mathrm {m}$ downstream of the start of the test section. Due to this long development length, the boundary layer properties, and therefore the Reynolds number, remain almost constant along the 3 m length of the floating element (Talluru Reference Talluru2013). The surface actuation test bed (SATB) is flush mounted in a rectangular cutout of
  $2.7\,{\rm m}\times 0.7\,{\rm m}$ (length
  $\times$ width) centred within this floating element. The SATB is a combination of 4 independently controlled, servo motor driven machines that run in a phase-synchronised manner to impose a 8
 $\lambda$ long upstream travelling sinusoidal wave at the wall (figure 1b). This is made possible by discretising two sinusoidal waves into 12 slats (oscillating elements) connected to a single machine, which cumulatively span a streamwise length of
  $2\lambda = 0.6$ m and have their phase controlled by a central camshaft. These slats, along with the camshaft, were fabricated with a high degree of precision and tolerance, enabling a spanwise wall motion while maintaining a negligible gap (
 ${\sim }100\,\mathrm {\mu }$m) between the individual slats. For non-actuated cases, a hydraulically smooth boundary layer flow was ensured (Marusic et al. Reference Marusic, Chandran, Rouhi, Fu, Wine, Holloway, Chung and Smits2021) and the data were found to match with previously published smooth-wall data from the Melbourne wind tunnel at the same location (Talluru Reference Talluru2013; Marusic et al. Reference Marusic, Chauhan, Kulandaivelu and Hutchins2015). When actuated, the slats have a fixed half-stroke length of
  $d = 18$ mm and can be oscillated at frequencies as high as
  $1/{T_{osc}} = 25$ Hz, leading to a maximum achievable spanwise velocity of
  $A$
$A$  $(=2{{\rm \pi} }d/{T_{osc}}) = 2.83$ m s
 $^{-1}$. It is important to note here that a discretised imposition of the streamwise travelling sinusoidal waves inevitably introduces high wavenumber harmonics of low amplitudes on the turbulent boundary layer (Auteri et al. Reference Auteri, Baron, Belan, Campanardi and Quadrio2010). However, considering that the present experiments regard fundamental modes with very low wavenumbers (
 ${{\kappa }^+_{x}}\lesssim 0.0014$; table 1), the corresponding higher harmonics are expected to only marginally influence the DR estimates (Gatti & Quadrio Reference Gatti and Quadrio2016; Chandran et al. Reference Chandran, Zampiron, Rouhi, Fu, Wine, Holloway, Smits and Marusic2023). Further details regarding the characterisation and validation of the SATB can be found in Marusic et al. (Reference Marusic, Chandran, Rouhi, Fu, Wine, Holloway, Chung and Smits2021) and Chandran et al. (Reference Chandran, Zampiron, Rouhi, Fu, Wine, Holloway, Smits and Marusic2023).
Table 1. A summary of the experimental dataset employed in this study, originally reported in Marusic et al. (Reference Marusic, Chandran, Rouhi, Fu, Wine, Holloway, Chung and Smits2021) and Chandran et al. (Reference Chandran, Zampiron, Rouhi, Fu, Wine, Holloway, Smits and Marusic2023). Parameters with  $^*$ are associated with the published hot-wire dataset of Marusic et al. (Reference Marusic, Chauhan, Kulandaivelu and Hutchins2015). The turbulent boundary layer (TBL) characteristics reported in the first three columns are for a non-actuated scenario.

All velocity data analysed in this study were acquired using hot-wire anemometry for various non-actuated and actuated cases ( $140\lesssim T^+_{osc} \lesssim 906$; table 1). Hot-wire data were acquired with an actuation length of
  $\gtrsim$2
 ${\lambda }$ (
 ${\gtrsim }2\delta$), beyond which the local drag modified due to the actuation was found to have nearly saturated (Chandran et al. Reference Chandran, Zampiron, Rouhi, Fu, Wine, Holloway, Smits and Marusic2023), consistent with past observations in the literature (Ricco & Wu Reference Ricco and Wu2004; Skote, Mishra & Wu Reference Skote, Mishra and Wu2019). The mean wall shear stress for the non-actuated (
 $\overline {\tau _{w_o}}$) and actuated flow cases (
 $\overline {\tau _{w}}$) was measured directly using the floating element drag balance, and also estimated from dedicated hot-wire experiments conducted in the viscous sublayer, to estimate
  $DR = (1 - {\overline {\tau _{w}}}/\overline {\tau _{w_o}})$. Table 1 reports the DR% as well as the percentage net power savings (NPS%) associated with each actuated case, where the latter is essentially the difference between DR% and the per cent net input power required to move the flow sideways. Here, NPS was computed based on the generalised Stokes layer theory (GSL theory; Quadrio & Ricco Reference Quadrio and Ricco2011), which estimates the net input power required by an ‘ideal’ actuation system (i.e. neglecting any mechanical losses) to generate a Stokes layer. Interested readers may refer to Appendix A, where we have provided further details regarding estimation of the NPS. As expected, the NPS was found to decrease with decreasing
  $T^+_{osc}$, with positive NPS accompanied by significant DR predominantly for the OSA cases (Chandran et al. Reference Chandran, Zampiron, Rouhi, Fu, Wine, Holloway, Smits and Marusic2023). A detailed description of the present measurements can be found in Marusic et al. (Reference Marusic, Chandran, Rouhi, Fu, Wine, Holloway, Chung and Smits2021) and Chandran et al. (Reference Chandran, Zampiron, Rouhi, Fu, Wine, Holloway, Smits and Marusic2023), where the data are analysed in greater depth.
The present analysis is limited to boundary layers at  $Re_{\tau }$ (
 $={{\delta }{U_{{\tau }_{o}}}/{\nu }}$)
  ${\approx }\,6000$ and 9700. Here,
  $\rho$ and
  $\nu$ are the density and kinematic viscosity of air, respectively, while
  ${\delta }$ and
  ${U_{{\tau }_{o}}}=\sqrt {\bar \tau _{w_o}/\rho }$ are the boundary layer thickness and friction velocity associated with the non-actuated flow. The superscript ‘
 $+$’ will denote normalisation in viscous units using
  $\nu$ and
  $U_{{\tau }_{o}}$. We investigate the inter-scale phase relationships for various ISA and OSA cases at these two high Reynolds numbers by analysing streamwise velocity fluctuations (
 $u$), acquired by a normal hot-wire positioned at
  $4.5\lesssim y^+\lesssim 6$ (where
  $y^+ = y{U_{{\tau }_{o}}}/{\nu }$). This
  $y^+$-range within the linear region was deemed optimal in a way that is close enough to the wall, for the
  $u$-signal to be sensitive to spanwise wall oscillations, while also being far enough to have a substantial streamwise variance,
  $\overline {u^2}$, for a greater signal-to-noise ratio (overbar denotes time averaging). Additionally, in this
  $y^+$-range, any undesired wall-conduction effects due to the close proximity of the hot-wire probe to the wall were found to be minimal. In the forthcoming section, we present statistical comparisons between actuated and non-actuated cases (for a given
  $Re_{\tau }$) at matched
  $y^+$, to bring out the ‘absolute’ response of the flow to wall oscillation (Agostini et al. Reference Agostini, Touber and Leschziner2014). However, the same trends are noted for statistical comparisons at matched
  $y^*=y{U_{\tau }}/{\nu }$, i.e. based on the local friction velocity
  $U_{\tau }$.
3. Results
3.1. Mean phase between all triadically coupled scales
Duvvuri & McKeon (Reference Duvvuri and McKeon2015) showed that the phase relationships between triadically coupled scales (coexisting at any  $y$) can be estimated by computing the skewness of the streamwise velocity fluctuations (
 ${\mathcal {S}}_{u}$) at
  $y$. This was demonstrated by decomposing the experimentally acquired, statistically stationary
  $u$-time series (
 $u(t)$) as a summation of its Fourier modes, i.e.
  $u(t)={\sum _{i = 1}^{\infty }}{{{\alpha }_{i}}\sin ({{{\omega }_{i}}t} + {{\psi }_{i}})}$, with circular frequencies
  ${\omega }_{i}$ (
 $=2{\rm \pi} /{T_{i}}$), amplitudes (
 ${\alpha }_{i}$), phase (
 ${\psi }_{i}$) and
  $0<{\omega }_{i}<{\omega }_{\infty }$. That is
 \begin{align} {{\mathcal{S}}_{u}} &=
\frac{\overline{u^3}}{{\sigma}^3} =
{{\frac{6}{4{{\sigma}^3}}}\sum_{\substack{\forall\
l,m,n\\ {{\omega}_{l}} < {{\omega}_{m}} <
{{\omega}_{n}}\\ {{\omega}_{l}} + {{\omega}_{m}} =
{{\omega}_{n}} }}
{{\alpha}_{l}}{{\alpha}_{m}}{{\alpha}_{n}}{\sin({{\psi}_{l}}
+ {{\psi}_{m}} - {{\psi}_{n}})}} \nonumber\\ &\quad +
{{\frac{3}{4{{\sigma}^3}}} \sum_{\substack{l=1\\
{{\omega}_{n}} = 2 {{\omega}_{l}} }}
{{\alpha}^2_{l}}{{\alpha}_{n}}{\sin(2{{\psi}_{l}} -
{{\psi}_{n}})}},
\end{align}
\begin{align} {{\mathcal{S}}_{u}} &=
\frac{\overline{u^3}}{{\sigma}^3} =
{{\frac{6}{4{{\sigma}^3}}}\sum_{\substack{\forall\
l,m,n\\ {{\omega}_{l}} < {{\omega}_{m}} <
{{\omega}_{n}}\\ {{\omega}_{l}} + {{\omega}_{m}} =
{{\omega}_{n}} }}
{{\alpha}_{l}}{{\alpha}_{m}}{{\alpha}_{n}}{\sin({{\psi}_{l}}
+ {{\psi}_{m}} - {{\psi}_{n}})}} \nonumber\\ &\quad +
{{\frac{3}{4{{\sigma}^3}}} \sum_{\substack{l=1\\
{{\omega}_{n}} = 2 {{\omega}_{l}} }}
{{\alpha}^2_{l}}{{\alpha}_{n}}{\sin(2{{\psi}_{l}} -
{{\psi}_{n}})}},
\end{align}
where  $\sigma =\sqrt {\overline {u^2}}$, and
  ${\psi }_{l}+{\psi }_{m}-{\psi }_{n}$ represents the phase difference between the triadically consistent scales, existing across the energy spectrum:
  $0< {\omega }_{i}<{\omega }_{\infty }$. Hence,
  ${\mathcal {S}}_{u}$ can be considered as a surrogate of the average measure for the phase between the various turbulent eddies/scales coexisting at
  $y$.
$y$.
Figure 2(a,c) displays our results for the near-wall values of  ${\overline {u^2}}$ and
  ${\mathcal {S}}_{u}$. As expected, in scenarios of DR, near-wall
  $\overline {u^2}$ reduces with increases in DR for both ISA and OSA cases (Chandran et al. Reference Chandran, Zampiron, Rouhi, Fu, Wine, Holloway, Smits and Marusic2023). The degree of reduction, however, is more gradual for OSA cases than for ISA cases, and it appears to be directly related to the amount of DR. We note that the OSA cases considered here have relatively lower
  $A^+$ levels when compared with the ISA cases (table 1); hence, the lower ‘effectiveness’ of the OSA approach is a manifestation of the parameter space investigated and should not be associated with the overall success of the strategy. The
  ${\overline {u^2}}$ trend confirms that
  $u$ near the wall is indeed influenced by wall actuation and, hence, can be used to understand the change in flow physics with DR.

Figure 2. (a,c) Variance ( $\overline {u^2}$), skewness (
 $\mathcal {S}_{u}$) and (b,d) probability distribution function (p.d.f.) of the
  $u$-fluctuations corresponding to various (a,b) ISA (
 $y^+\sim 6$) and (c,d) OSA cases (
 $y^+\sim 4.5$). In (a,c),
  $DR = 0\,\%$ or
  $T^+_{osc} = NA$ refers to the non-actuated case (empty symbols);
  $\overline {u^2}$ in (a,c) and
  $u$-fluctuations in (b,d) are normalised by
  $U_{{\tau }_{o}}$. Note that the abscissa is not linear in (a,c).
We also see from figure 2(a,c) that  ${\mathcal {S}}_{u}$ increases with DR for both ISA and OSA cases, indicating that an increase in DR is associated with an average decrease in phase between the triadically consistent scales (see also Duvvuri & McKeon Reference Duvvuri and McKeon2015). A similar increase in
  ${\mathcal {S}}_{u}$ with DR has been noted previously for a drag-reduced flow obtained on imposition of spanwise wall oscillations (Baron & Quadrio Reference Baron and Quadrio1995; Choi et al. Reference Choi, DeBisschop and Clayton1998), or introduction of microbubbles and polymers in the flow (Pal, Deutsch & Merkle Reference Pal, Deutsch and Merkle1989), but the association with inter-scale phase relationships has not been discussed. The probability distribution functions (p.d.f.) for the various
  $u$-signals, shown in figure 2(b,d), indicate that this DR trend is coupled with the reduction in intense
  $-u$ events (
 $u/{U_{{\tau }_{o}}}\lesssim -3$). For the ISA cases this can be associated with weakening of the low-speed near-wall streaks, as noted in some earlier works (Akhavan et al. Reference Akhavan, Jung and Mangiavacchi1993; Agostini et al. Reference Agostini, Touber and Leschziner2014; Ricco et al. Reference Ricco, Skote and Leschziner2021), but that a similar result can be observed for the OSA cases has only been noted recently by Chandran et al. (Reference Chandran, Zampiron, Rouhi, Fu, Wine, Holloway, Smits and Marusic2023), based on near-wall particle image velocimetry measurements.
3.2. Mean phase between triadically coupled inner and outer scales
Whether this reduction in intense  $-u$ events, for the cases of OSA, exists due to the attenuation of viscosity-dominated near-wall (inner) scales, or that of the inertia-dominated outer eddies, can be understood by computing the individual inner (
 $u_{i}$) and outer (
 $u_{o}$) contributions to the
  $u$-fluctuations. In particular, we can investigate the change in mean phase between the outer (
 $u_{o}=u$ (
 $T^+\gtrsim T^+_{c}$)) and the inner scales (
 $u_{i}=u$ (
 $T^+\lesssim T^+_{c}$)), where
  $T^+_{c} = {2{{\rm \pi} }}/{{\omega }^+_{c}} = 350$. For this, we follow Mathis et al. (Reference Mathis, Marusic, Hutchins and Sreenivasan2011) and linearly decompose
  $u=u_{o}+u_{i}$ to obtain
 \begin{equation} {{\mathcal{S}}_{u}} = \frac{\overline{u^3}}{{\sigma}^3} = \overline{\overline{{u}^3_{o} }} + \overline{\overline{{u}^3_{i} }} + 3{\overline{\overline{{{u}^2_{o}}{{u}_{i}} }}} + 3{\overline{\overline{{{u}^2_{i}}{{u}_{o}} }}}, \end{equation}
where the double overbar denotes a time averaged quantity normalised by  ${\sigma }^3$. Duvvuri & McKeon (Reference Duvvuri and McKeon2015) reported exact expressions for the four individual terms given in (3.2), where
 \begin{equation} {\overline{{\overline{{u^2_{i}}{u_{o}} }}}} = {\frac{1}{2{{\sigma}^3}}} \sum_{\substack{\forall\ l,m,n\\ {{\omega}_{n}} - {{\omega}_{m}} = {{\omega}_{l}}\\0 < {{\omega}_{l}} < {{\omega}_{c}}\\ {{\omega}_{m}}, {{\omega}_{n}} > {{\omega}_{c}} }} {{\alpha}_{l}}{{\alpha}_{m}}{{\alpha}_{n}} {\sin({{\psi}_{l}} + {{\psi}_{m}} - {{\psi}_{n}})}, \end{equation}
meaning that the cross-term  $3{\overline {\overline {{u^2_{i}}{u_{o}} }}}$ represents the mean phase difference between the outer scale
  ${\omega }_{l}$ and the ‘envelope’ of the triadically coupled inner scales
  ${{\omega }_{n}}$,
  ${{\omega }_{m}}$. Enhanced values for this cross-term are therefore associated with a reduction in phase between the outer and inner scales. In the remainder of this manuscript, we will therefore interpret the increase in
  $3{\overline {\overline {{{u}^2_{i}}{{u}_{o}}}}}$ as an enhancement of inter-scale communication. The other cross-term in (3.2),
  $3{\overline {\overline {{u^2_{o}}{u_{i}} }}}$, also theoretically represents an inner–outer coupling in some form, but Mathis et al. (Reference Mathis, Marusic, Hutchins and Sreenivasan2011) found that its contributions to
  ${{\mathcal {S}}_{u}}$ were negligible for a canonical boundary layer.
The four decomposed terms of  ${\mathcal {S}}_{u}$ (3.2) for the various cases are shown in figures 3(a) and 3(d). We conclude that the increase in
  ${\mathcal {S}}_{u}$ with DR can be attributed predominantly to two terms: (i)
  $\overline {\overline {u^3_{i}}}$, which represents the average phase between the triadically coupled inner scales (
 $T^+<350$), and (ii)
  $3\overline {\overline {{u^2_{i}}{u_{o}}}}$, the cross-term that represents the average phase between the outer scales and the envelope of the triadically coupled inner scales (3.3). An increase in
  $3\overline {\overline {{u^2_{i}}{u_{o}}}}$ with DR suggests that DR is associated with a decrease in the average phase difference between
  $u_{o}$ and
  $u_{i}$ (Duvvuri & McKeon Reference Duvvuri and McKeon2015). In the case of ISA, the p.d.f. plots for the
  $u_{i}$ and
  $u_{o}$ signals (figure 3b,c) show a reduction in intense
  $-{u_{i}}$ events with an increase in DR, which suggests the weakening of near-wall low-speed streaks. But this process is also accompanied by a reduction in intense
  $-{u_{o}}$ and
  $+{u_{o}}$ events, indicating an enhanced inter-scale communication between the inner and outer scales. Similarly, in the case of OSA (figure 3e,f), the intense
  $-{u_{i}}$ events are attenuated more significantly than the corresponding
  ${u_{o}}$ events. The substantial DR noted in the cases of both ISA and OSA strategies, thus, is a consequence of the attenuation of both the inner and outer scales which contribute to the total drag. This is investigated further in the next section by examining the changes to the scale-specific energy (i.e. the
  $u$-spectra) due to spanwise wall actuation.

Figure 3. (a,d) Terms obtained from decomposition of skewness ( $\mathcal {S}_{u}$) corresponding to various (a) ISA and (d) OSA cases documented in table 1, noting that the abscissa is not linear. The p.d.f. of the (b,e) inner-scale and (c,f) outer-scale sub-components of
  $u$, corresponding to the same (b,c) ISA and (e,f) OSA cases as in (a,d). In (a,d),
  $DR = 0\,\%$ refers to the non-actuated case.
3.3. Scale-specific phase between inner and outer scales
Figure 4(c,d) shows the premultiplied  $u$-spectra,
  ${f}{{\phi }^+_{uu}}$ for the non-actuated and actuated cases, where figure 4(c) represents the ISA strategy (
 $T^+_{osc} = 232$) and figure 4(d) represents the OSA strategy (
 $T^+_{osc} = 604$). Here,
  ${{\phi }^+_{uu}} = {{\langle }{{\tilde {u}}(T^+)}{({{\tilde {u}}^{*}}(T^+))}{\rangle }}/{U^{2}_{{\tau }_{o}}}$, and ‘
 $\,{\widetilde {\,}}\,$’ represents the Fourier transform in time while ‘
 ${\langle }\,{\rangle }$’ indicates ensemble averaging and ‘
 $^*$’ indicates the complex conjugate. The spectra for both actuated cases are attenuated across the inner (
 $T^+ \lesssim 350$) as well as the outer (
 $T^+ \gtrsim 350$) scales, and not localised to a specific scale range depending on the actuation time scale (ISA or OSA). A broadband attenuation of the near-wall
  $u$-spectra, in case of the ISA strategy, has also been observed in previously published simulation data at low Reynolds numbers (Gatti et al. Reference Gatti, Stroh, Frohnapfel and Hasegawa2018; Yao, Chen & Hussain Reference Yao, Chen and Hussain2019), but the results at high Reynolds numbers are recent (Marusic et al. Reference Marusic, Chandran, Rouhi, Fu, Wine, Holloway, Chung and Smits2021). At high
  $Re_{\tau }$, the broadband attenuation is noted across a much larger range of energetic scales, spanning the near-wall viscous (inner) scales, the attached eddy hierarchy and the outer-scaled superstructures (Mathis et al. Reference Mathis, Hutchins and Marusic2009; Deshpande, de Silva & Marusic Reference Deshpande, de Silva and Marusic2023), whose energetic contributions co-exist between the inner and outer peaks of the
  $u$-spectrogram (figure 4a,b). The substantial DR, which is made possible via this broadband energy attenuation, can therefore be associated with the reduced mean phase difference between the triadically coupled inner and outer scales (figures 2, 3).

Figure 4. (a,b) Premultiplied  $u$-spectrograms,
  ${f}{{\phi }^+_{uu}}({y^+},{T^+})$ for non-actuated (canonical) TBLs acquired by Samie et al. (Reference Samie, Marusic, Hutchins, Fu, Fan, Hultmark and Smits2018). (c,d) Premultiplied spectra of
  $u$ (
$u$ ( $4.5\lesssim y^+ \lesssim 6$) with and without wall actuation for a specific (c) ISA and (d) OSA case. (e,f) Argument of the co-spectrum (
 ${\phi }_{R}$) estimated for
  $T^+>350$ for the same (e) ISA and (f) OSA cases as in (c,d). Grey background represents the range of scales between the inner (cross) and outer peaks (circle) of the
  $u$-spectrograms in (a,b). The arrow in (c,d) indicates
  $T^+_{osc}$. Dashed white line represents
  $T^+=350$.
In addition, the maximum energy attenuation is always confined to the inner-scale region ( $T^+ \lesssim 350$) regardless of whether the spanwise oscillation targets the inner scales (figure 4c) or the outer scales (figure 4d). For example, for OSA, the spectrum at
  $T^+\sim 100$ is attenuated by
  $\sim$35 % on actuation, in contrast to
  $\sim$10 %–15 % attenuation at
  $T^+\sim 600$, which is closer to
  $T^+_{osc}$. These observations are consistent with the discussion based on figure 3(e,f), where for OSA the inner-scale contributions (
 $u_{i}$) were found to be more severely attenuated than the outer-scale contributions. Hence, the manipulation of phase between the triadically coupled inner and outer scales (which enhances their coupling) appears to be correlated with the success of the OSA strategy, given it involves a substantial attenuation of the major drag contributing inner scales despite the flow being actuated at the outer scales (at much lower power).
While the increase in magnitude of the cross-talk term with DR in figure 3(d) supports the above arguments, it only gives an average estimate of the phase difference between all triadically coupled inner and outer scales. Following Jacobi & McKeon (Reference Jacobi and McKeon2013, Reference Jacobi and McKeon2017), a more direct means to quantifying the change in phase relationship on a per-scale basis is the argument ( $arg$) of the co-spectrum,
  ${\phi }_{R}$, computed between the outer scales (
 $u_{o}$) and the outer-scale ‘envelope’ of the inner scales (
 ${{\epsilon }_{o}}(u_{i})$), where the co-spectrum
  ${\phi }_{R} = {\langle }{{\widetilde {{u}_{o}}}(T^+)}{{{{\epsilon }_{o}}({{\widetilde {u_{i}}}^{*}}(T^+))}}{\rangle }$. The envelope is estimated via the Hilbert transform, with
  ${\phi }_{R}$ physically interpretable only for
  $T^+>T^+_{c}$, per definition (refer to figures 6–7 of Mathis et al. (Reference Mathis, Hutchins and Marusic2009) for further clarity). Here,
  ${\phi }_{R}$ is essentially a spectral equivalent of the amplitude modulation coefficient,
  $R({{\rm \Delta} }t) = \overline {{{{u}_{o}}(t)} {{\epsilon }_{o}}({{u}_{i}}(t + {{\rm \Delta} }t))}/{{\sqrt {\overline {{{\epsilon }^2_{o}}(u_{i})}}}{\sqrt {\overline {{{u}^2_{o}}}}}}$, which Mathis et al. (Reference Mathis, Hutchins and Marusic2009, Reference Mathis, Marusic, Hutchins and Sreenivasan2011) used to quantify the nonlinear coupling between the inner and outer scales. Duvvuri & McKeon (Reference Duvvuri and McKeon2015) gave an exact relationship linking
  $R$ (
$R$ ( ${{\rm \Delta} }t = 0$) and the cross-term as:
  $R{(}{{\sqrt {\overline {{{\epsilon }^2_{o}}(u_{i})}}} {\sqrt {\overline {{{u}^2_{o}}}}}}{)}=2{\overline {{u^2_{i}}{u_{o}} }}$, indicating that arg(
 ${\phi }_{R}$) would represent the scale-specific phase difference between the outer and triadically coupled inner scales.
Figure 4(e,f) shows, respectively, the change in scale-specific phase estimated for the same ISA and OSA cases as in figure 4(c,d). Clearly, the actuation reduces the phase between  $u_{o}$ and
  ${{\epsilon }_{o}}(u_{i})$ for both OSA and ISA cases. This change in phase occurs nominally in the same scale range as the attenuation of their respective premultiplied spectra (
 $\,{f}{{\phi }^+_{uu}}$), which corresponds to the hierarchy of scales coexisting between the inner and outer peaks of the
  $u$-spectrogram (indicated by grey shading). The present study, which investigates spanwise oscillations imposed at
  $T^+_{osc}$ across this hierarchy of scales (
 $140\lesssim T^+_{osc}\lesssim 906$; table 1), reports a significant DR that is always associated with a change in phase between the hierarchy of scales (not shown for all cases). At very high
  $Re_{\tau }$ (
 ${\gtrsim } O $(10
 $^4$)), an even broader range of scales would exist between the spectral inner and outer peaks along with statistically significant outer scales (Mathis et al. Reference Mathis, Hutchins and Marusic2009; Deshpande et al. Reference Deshpande, de Silva and Marusic2023). Therefore, a significant DR could be obtained (accompanied by manipulated inter-scale phase) by actuating at any
  $T^+_{osc}$ within this broader energy-containing hierarchy. This reveals a new energy-efficient pathway that indirectly affects the major drag-producing inner scales through imposed actuation of the triadically coupled outer scales. In summary, the results from figures 2–4 are consistent in suggesting that increasing DR, for both ISA and OSA strategies, is associated with enhanced inter-scale coupling emerging through their reduced phase differences.
4. Reynolds-number variation of inter-scale phase relationships
In the previous sections, we have argued that the success of the OSA strategy at high  $Re_{\tau }$, in contrast with its failure at low
  $Re_{\tau }$, is associated with the energisation of the outer scales with increasing
  $Re_{\tau }$ (Marusic et al. Reference Marusic, Chandran, Rouhi, Fu, Wine, Holloway, Chung and Smits2021). This
  $Re_{\tau }$-dependence of the outer-scale energy is known to also enhance the nonlinear coupling between the inner and outer scales (Mathis et al. Reference Mathis, Hutchins and Marusic2009, Reference Mathis, Marusic, Hutchins and Sreenivasan2011), and consequently is bound to influence their inter-scale phase relationships (3.3). Considering the association of DR, obtained via spanwise wall oscillations, with the inter-scale phase, it is worth discussing how these relationships change in a non-actuated boundary layer for increasing
  $Re_{\tau }$. To this end, we consider the hot-wire dataset of Marusic et al. (Reference Marusic, Chauhan, Kulandaivelu and Hutchins2015) at
  $Re_{\tau }\sim 2800$ and 13 000, comprising streamwise velocity time series acquired across a canonical zero-pressure-gradient turbulent boundary layer. These data were respectively acquired at the upstream and downstream ends of the long Melbourne wind tunnel test section at matched free-stream velocity (table 1), resulting in a significant difference in the outer-scale
  $\delta$, but nominally matched viscous scale
  $\nu /{U_{\tau }}$ between the two cases (and hence, nominally matched hot-wire spatial resolution). Therefore, these data are well suited for investigating the nonlinear ‘forcing’/modulation imposed by the
  $Re_{\tau }$-dependent outer scales (
 $u_o$;
  $T^+>350$), onto the ‘universal’ (i.e.
  $Re_{\tau }$-invariant) inner scales (
 $u_i$;
  $T^+\lesssim 350$).
Figure 5(a) shows the  ${\mathcal {S}}_{u}$ profile decomposed into the cross-term, representative of the inner–outer coupling (3
 ${\overline {\overline {{u^2_{i}}{u_{o}} }}}$), while figure 5(b) shows the addition of the remaining terms (
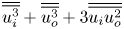 $\overline {\overline {u^3_{i}}}+\overline {\overline {u^3_{o}}} + 3{\overline {\overline {{u_{i}}{u^2_{o}} }}}$) in the inner region (
 $y^+\lesssim 100$). Consistent with the previous observation of Mathis et al. (Reference Mathis, Marusic, Hutchins and Sreenivasan2011),
  $3{\overline {\overline {{u^2_{i}}{u_{o}} }}}$ increases with
  $Re_{\tau }$ while all other terms are
  $Re_{\tau }$-invariant. Considering the
  $3{\overline {\overline {{u^2_{i}}{u_{o}} }}}$ trend with respect to (3.3), figure 5(a) suggests that the increased outer-scale modulation of the inner scales (with
  $Re_{\tau }$) increasingly manipulates the inter-scale phase between these scales. This is quantified by plotting the premultiplied co-spectrum (
 $\,f{\phi }^+_{R}$) in figure 5(c) and arg(
 ${\phi }_{R}$) in figure 5(d) at
  $y^+\approx 60$, which was chosen owing to significant differences in
  $3{\overline {\overline {{u^2_{i}}{u_{o}} }}}$. Here,
  $f{{\phi }^+_{R}}$ clearly indicates increased energy for
  $T^+>10^3$ for the high
  $Re_{\tau }$ case, and is representative of the enhanced coupling between the outer scales and the envelope of the inner scales. Considering the associated arg(
 ${\phi }_{R}$), one can note reduced phase between
  $u_{o}$ and
  ${\epsilon _{o}}$(
 $u_{i}$) in the same range (
 $T^+>10^3$) where the scale-specific coupling is enhanced. The present analysis is consistent with the findings of Duvvuri & McKeon (Reference Duvvuri and McKeon2015) (for a periodically forced roughness element) and that presented in § 3 (for imposed spanwise oscillations), thereby reaffirming that an imposed ‘forcing’ on a TBL enhances the triadic coupling between inner and outer scales via reduction of their inter-scale phase relationship. The fact that the inner–outer coupling increases with
  $Re_{\tau }$ (figure 5) can plausibly explain the observation of increased DR and NPS with increasing
  $Re_{\tau }$ for matched OSA parameters (Marusic et al. Reference Marusic, Chandran, Rouhi, Fu, Wine, Holloway, Chung and Smits2021; Chandran et al. Reference Chandran, Zampiron, Rouhi, Fu, Wine, Holloway, Smits and Marusic2023), suggesting improved efficacy of the OSA strategy at very high
  $Re_{\tau }$.

Figure 5. (a,b) Value of  ${\mathcal {S}}_{u}$ decomposed into (a)
  $3{\overline {\overline {{u^2_{i}}{u_{o}}}}}$ and (b)
  $\overline {\overline {u^3_{i}}}+\overline {\overline {u^3_{i}}}+ 3{\overline {\overline {{u_{i}}{u^2_{o}} }}}$ using
  $T^+_{c}=350$, plotted in the inner region (
 $y^+\lesssim 100$) using the hot-wire data of Marusic et al. (Reference Marusic, Chauhan, Kulandaivelu and Hutchins2015). (c) Premultiplied co-spectra,
  ${f}{{\phi }^+_{R}}$ and (d) argument of the co-spectrum, arg(
 ${\phi }_{R}$) estimated for
  $T^+>350$ for canonical TBL data at
  $y^+\approx 60$. Light blue background represents the range of scales where the higher
  $Re_{\tau }$ case has a stronger inner–outer coupling than the lower
  $Re_{\tau }$ case. Dot-dashed black line represents
  $T^+=350$.
5. Conclusions
We find that the turbulent DR achieved by spanwise wall oscillations, which provokes a broadband attenuation of drag-producing turbulent scales, is associated with an enhanced coupling between the inner and outer scales. This change in inter-scale coupling emerges through the manipulation of the phase relationship between these scales, wherein the actuation forces the entire range of energy-containing scales, from the inner (viscous) to the outer (inertial) scales, to be more ‘in phase’. Such a manipulation occurs regardless of whether the flow is actuated at  $T^+_{osc}$ corresponding to the ISA or the OSA pathways; both lead to a moderate DR for a high
  $Re_{\tau }$ flow. The criterion to optimise this control scheme, hence, narrows down to the power required to actuate the flow, which at any given
  $Re_{\tau }$ is much lower in the case of OSA than ISA, making OSA the more energy-efficient pathway to high-Reynolds-number DR (Marusic et al. Reference Marusic, Chandran, Rouhi, Fu, Wine, Holloway, Chung and Smits2021).
The fact that manipulation of inter-scale phase is plausibly a consequence of the imposed forcing is tested by investigating the variation in inner–outer coupling with  $Re_{\tau }$, in a canonical boundary layer. Here, the increasing nonlinear modulation imposed by the
  $Re_{\tau }$-dependent outer scales, on the ‘universal’ inner scales, is used to investigate the corresponding variation in their inter-scale phase relationships. It is demonstrated that the increase in
  $3\overline {{\overline {{u^2_{i}}{u_{o}} }}}$, which is the sole term responsible for increasing
  $\mathcal {S}_u$ with
  $Re_{\tau }$ in a canonical flow (Mathis et al. Reference Mathis, Marusic, Hutchins and Sreenivasan2011), is a consequence of reduced phase between the outer scales and outer-scale envelope of the inner scales. This observation is similar to that noted in a drag-reduced flow achieved via imposition of wall oscillations, where the nonlinear coupling term (
 $3\overline {{\overline {{u^2_{i}}{u_{o}} }}}$) is found to increase with increasing DR. Thus, besides supporting the primary conclusion of the present study, the increase in
  $3\overline {{\overline {{u^2_{i}}{u_{o}} }}}$ with increasing
  $Re_{\tau }$ also suggests that the efficacy of the OSA strategy will likely improve further at higher Reynolds numbers. These arguments encourage future work on multiple fronts, including: (i) investigation of the flow physics associated with enhanced inner–outer coupling at high
  $Re_{\tau }$, and (ii) testing the efficacy of practicably deployable spanwise flow oscillation schemes, such as through plasma actuators (Hehner, Gatti & Kriegseis Reference Hehner, Gatti and Kriegseis2019; Thomas et al. Reference Thomas, Corke, Duong, Midya and Yates2019; Duong, Corke & Thomas Reference Duong, Corke and Thomas2021), passive wavy walls (Ghebali, Chernyshenko & Leschziner Reference Ghebali, Chernyshenko and Leschziner2017), etc. towards achieving energy-efficient DR via the OSA pathway.
Acknowledgements
This research was funded through the Deep Science Fund of Intellectual Ventures and the Australian Research Council. R.D. also acknowledges partial financial support by the University of Melbourne through the Melbourne Postdoctoral Fellowship.
Declaration of interests
The authors report no conflict of interest.
Appendix A. Power calculations
For completeness, here, we provide details of the power calculations as adapted from Marusic et al. (Reference Marusic, Chandran, Rouhi, Fu, Wine, Holloway, Chung and Smits2021). The NPS quantifies the difference between the net power cost for the non-actuated case ( $P^+_0$) and the oscillating case (
 $P^++ P^+_{in}$), and is given by
 \begin{equation} NPS\% = 100{\times}{\frac{ {P^+_o} - ({P^+} + {P^+_{in}}) }{P^+_o}} = DR\%-\frac{P^+_{in}}{P^+_o}, \end{equation}
where  $P^+$ and
  $P^+_o$ represent the power required to drive the flow over the actuated and stationary wall, respectively. Both
  $P^+_o$ and
  $P^+$ can be estimated from the bulk velocity of the non-actuated case (
 $U^+_{b_o}$), i.e.
  $P^+_o = U^+_{b_o}$ and
  $P^+ = (1 - DR)U^+_{b_o}$.
The input power ( $P^+_{in}$) required to operate the spanwise oscillating mechanism is
 \begin{equation} P^+_{in} = {\frac{1}{ {t^+_{avg}}{L^+_x}{L^+_z} }} { {\int_{t^+}^{{t^+} + {t^+_{avg}}}}{\int_{0}^{{L^+_x}}}{\int_{0}^{{L^+_z}}} {w^+_{wall}} \left({{ \frac{{\partial}w^+}{{\partial}y^+} }|}_{{y^+} = 0}\right) {{\rm d}\,{x}^+}\,{{\rm d}{z}^+}\,{{\rm d}{t}^+}}, \end{equation}
where  $t^+_{avg}$,
  ${L^+_x}$ and
  $L^+_z$ are the averaging time, streamwise and spanwise extents of the actuated surface, respectively;
  $w^+_{wall} = {w^+}|_{{y^+} = 0}$,
  ${{{{\partial }w^+}/{{\partial }y^+} }|}_{{y^+} = 0}$ are respectively the instantaneous spanwise velocity and its wall-normal gradient at the wall.
However, since it is not possible to measure the instantaneous spanwise velocity gradient from the present experiments, we use the laminar GSL theory proposed by Quadrio & Ricco (Reference Quadrio and Ricco2011) to estimate  $w^+$ following:
 \begin{align} {w^+}({x^+},{y^+},{t^+}) &= {A^+}{\mathcal{R}}\left\{C{\exp({{\rm i}({{\kappa}^+_x}{x^+} - {\omega^+_{osc}}{t^+} )})}{\rm Ai}\left[{\exp({{\rm \pi}{\rm i}/6})}({{\kappa}^+_x}[1 - DR])^{1/3} \vphantom{\left({y^+} - \frac{\omega^+_{osc}}{{\kappa}^+_x[1 - DR]} - \frac{{\rm i}{\kappa}^+_x}{1 - DR}\right)}\right.\right.\nonumber\\ &\quad \left.\left.\times\left({y^+} - \frac{\omega^+_{osc}}{{\kappa}^+_x[1 - DR]} - \frac{{\rm i}{\kappa}^+_x}{1 - DR}\right)\right]\right\}, \end{align}
where  $C=\{{\rm Ai}[{\rm i}{\exp ({{\rm i}{{\rm \pi} }/3})}\ ({\kappa }^+_x\ [1 - DR])^{1/3} (\omega ^+_{osc}/{\kappa }^+_x + {\rm i}{\kappa ^+_x})/[1-DR]]\}^{-1}$,
  ${\rm Ai}$ is Airy function of the first kind, and
  $\mathcal {R}$
  $\{\cdots \}$ is the real part of the argument. Marusic et al. (Reference Marusic, Chandran, Rouhi, Fu, Wine, Holloway, Chung and Smits2021) and Rouhi et al. (Reference Rouhi, Fu, Chandran, Zampiron, Smits and Marusic2023) have previously compared the
  $P^+_{in}/P^+_o$ computed using
  $w^+$ (from their LES data) with that estimated from the GSL theory (A3), and obtained good agreement. Notably, the maximum difference was found to be less than 1 % for their OSA cases, while it was less than 3 % for the ISA cases. This supports usage of the GSL theory for estimating NPS for the present experiments.


 Open access