


1. Introduction
Shock wave/boundary layer interactions (SWBLIs) are common flow phenomena in the internal and external flow fields of supersonic aircraft. When SWBLIs occur, the shock wave imposes an inverse pressure gradient on the boundary layer, altering its velocity profile and thickness and potentially leading to separation in the interaction region. Generally, SWBLI attenuates vehicle performance. For example, SWBLI increases drag that may trigger large-scale unsteadiness and buffeting on transonic wings. Moreover, it results in a loss of total pressure and distortion of the exit flow in a supersonic inlet. These consequences are exacerbated when the aircraft is operating at off-design conditions (Bur, Corbel & Delery Reference Bur, Corbel and Delery1998; Krishnan, Sandham & Steelant Reference Krishnan, Sandham and Steelant2009), which can even lead to inlet unstart. Additionally, the unsteadiness induced by separation and aerodynamic thermal loads can significantly impact the engine life (Dolling Reference Dolling2001; Babinsky & Harvey Reference Babinsky and Harvey2011).
Over the past several decades, supersonic inlet flow fields have been categorised into commonly recognised types: normal shock induced by downstream throttling interacting with the boundary layer in the throat and diffuser of the inlet (NSWBLI); compression ramp-induced shock interacting with the boundary layer (CRWBLI); sidewall-induced shock, known as a swept compression ramp, interacting with the forebody boundary layer in a three-dimensional nature (SSWBLI); cowl-induced shock considered as an incident shock impinging on the forebody and interacting with the boundary layer (ISWBLI), which are dominant phenomena in the supersonic inlet and significantly affect performance. The areas of primary interest include understanding the flow field structure (Délery, Marvin & Reshotko Reference Délery, Marvin and Reshotko1986; Délery & Dussauge Reference Délery and Dussauge2009; Giepman, Schrijer & Van Oudheusden Reference Giepman, Schrijer and Van Oudheusden2018; Grossman & Bruce Reference Grossman and Bruce2018; Xue et al. Reference Xue, Schrijer, Van Oudheusden, Wang, Shi and Cheng2020), surface pressure distribution (Carrière, Sirieix & Solignac Reference Carrière, Sirieix and Solignac1969; Charwat Reference Charwat1970; Ardonceau Reference Ardonceau1984; Morris, Sajben & Kroutil Reference Morris, Sajben and Kroutil1992; Matheis & Hickel Reference Matheis and Hickel2015), prediction of the separation scale (Zukoski Reference Zukoski1967; Korkegi Reference Korkegi1975; Settles Reference Settles1976; Souverein, Bakker & Dupont Reference Souverein, Bakker and Dupont2013) and unsteadiness (Dolling & Murphy Reference Dolling and Murphy1983; Dolling & Brusniak Reference Dolling and Brusniak1989; Thomas, Putnam & Chu Reference Thomas, Putnam and Chu1994; Adler & Gaitonde Reference Adler and Gaitonde2018).
For supersonic inlets, the cowl-induced shock/forebody boundary layer interactions are generally influenced by expansion waves originating from the shoulder, resulting in complex flow structures (Tan, Sun & Huang Reference Tan, Sun and Huang2012; Huang et al. Reference Huang, Tan, Sun and Sheng2017). Previous experimental studies have used a simplified model consisting of two plates – one parallel to the incoming wind tunnel flow and the other inclined at a certain expansion angle to simulate the inlet shoulder. The cowl has also been replaced by a shock generator to produce a shock wave.
Chew (Reference Chew1979) investigated interactions induced by different incident shock intensities (wedge angles of 4 $^\circ$, 6 $^\circ$ and 8 $^\circ$) for Mach numbers of 1.8 and 2.5 with an expansion angle of 6 $^\circ$. The scale of the interactions is shown to depend on both the incident shock and the expansion waves. The presence of an expansion corner is advantageous in mitigating separation. When the shock impinges downstream of the expansion corner, the separation region cannot extend upstream beyond the expansion corner. Chung & Lu (Reference Chung and Lu1995) examined the impact of three different shock impingement points on interactions under two shock intensities (wedge angles of 2 $^\circ$ and 4 $^\circ$) and two expansion angles (2.5 $^\circ$ and 4 $^\circ$). The wall static pressure showed overshoot compared with inviscid pressure levels and the suppression of SWBLI was experimentally confirmed when the shock impinging point was located downstream of the expansion corner. Chung (Reference Chung2001) investigated a transonic case in which the Mach number was 1.28 and the incident shock impinged exactly at the expansion corner. Wall static pressure measurements for different shock intensities (wedge angles of 1 $^\circ$, 3 $^\circ$ and 5 $^\circ$) and expansion corners (5 $^\circ$, 10 $^\circ$ and 15 $^\circ$) reveal that the downstream peak pressure fluctuation depends on the coupling of the impinging shock and expansion waves. The focus of the above study is unseparated interaction or relatively small separation induced by weak shock.
However, to achieve enhanced flow compression for drag reduction purposes, the flow turning angle at the inlet internal cowl is typically maintained above 10 $^\circ$ (Weir, Reddy & RUPP Reference Weir, Reddy and RUPP1989; Devaraj et al. Reference Devaraj, Jutur, Rao, Jagadeesh and Anavardham2020; Huang et al. Reference Huang, Tan, Cai and Sun2021). In recent years, researchers have shifted their focus towards more practical investigations. Zhang et al. (Reference Zhang, Tan, Zhuang and Wang2014) employed numerical simulations to explore the effects of different shock impingement positions on flow separation under a fixed expansion angle for a Mach number of 3.5 and a wedge angle of 15 $^\circ$ while also introducing an inviscid theoretical analysis. By examining the pressure distribution along near-wall streamlines under both inviscid and viscous flow conditions using the same inlet model, they categorised the interaction process into four types depending on the sequence of the flow passing through shocks and expansion waves. Sathianarayanan & Verma (Reference Sathianarayanan and Verma2017) investigated the flow field at various shock intensities (wedge angles of 6 $^\circ$, 10 $^\circ$ and 14 $^\circ$) and expansion angles (6 $^\circ$, 10 $^\circ$ and 14 $^\circ$) for a Mach number of 3.9 using oil-flow visualisation as well as wall pressure measurements. The findings suggest that the primary effect on flow separation comes from the shock intensity, while changes in the expansion angle have minimal impact. Although expansion waves can partially reduce the scale of separation, they are unable to completely inhibit separation. However, this study suffers from limitations such as an insufficient size of the shock generator, leading to interaction with SWBLIs by an expansion fan emanating from its trailing edge. Additionally, sidewall oil-flow visualisation reveals a significant influence from swept shocks on the overall flow field with an evident three-dimensional structure observed in base plate separation areas. With advancements in high-precision numerical simulations, there has been increased exploration of the unsteadiness properties associated with incident shock/boundary layer interactions under the influence of expansion. Tong et al. (Reference Tong, Li, Yuan and Yu2020) employed direct numerical simulation to investigate the shock generator at a wedge angle of 12 $^\circ$ for a Mach number of 2.9, considering various expansion intensities (0 $^\circ$, 2 $^\circ$, 5 $^\circ$ and 10 $^\circ$), with a particular focus on the properties of the turbulent boundary layer. They reported that as the expansion angle increases, the reattached turbulent boundary layer undergoes a faster recovery to the equilibrium state. Simultaneously, there is a significant decrease in the turbulent kinetic energy within the outer boundary layer while an increase is observed in the near-wall region. Furthermore, their study revealed that larger expansion angles effectively mitigate low-frequency pressure oscillations through analysis of the wall pressure frequency spectrum.
Expansion-corner-affected ISWBLI (EC-ISWBLI) is a natural phenomenon observed in supersonic mixed-compression inlets. Previous studies have demonstrated that the flow structure is primarily governed by the mutual influence between the incident shock and the expansion corner. However, limited research has been conducted on the larger wedge angles inducing ISWBLI, a phenomenon frequently observed in supersonic mixed-compression inlets. Previous experimental results were significantly influenced by the swept shock and expansion waves emanating from the tail of the shock generator, resulting in a highly three-dimensional separation. In order to establish a quasi-two-dimensional separation with a stronger incident shock, a model is meticulously designed and experiments are conducted in this work. Schlieren photography, wall-pressure measurements and surface oil-flow visualisations are used to investigate the shock impingement point downstream of the expansion corner for wedge angles of 10 $^\circ$, 12 $^\circ$ and 15 $^\circ$. Due to the supersonic inlet operating at a wide range of Mach numbers, there are significant movements of the cowl-induced shock impingement position along the flow direction. Hence, the impact of the shock impingement location on EC-ISWBLI is the focus of attention. The flow structures of the EC-ISWBLI can be categorised into three distinct types, with a comprehensive description provided for the flow features of each category. Subsequently, an inviscid model is introduced to simplify the characterisation of interactions in the second and third types, followed by an in-depth discussion of the feasibility of free interaction theory (FIT) in EC-ISWBLI. Through the analysis of the establishment process of FIT, we identify reasons for its limited applicability in certain situations. Furthermore, two criteria based on FIT are proposed to explain the evolution of the flow field and determine the threshold for the ‘lock-in’ effect, respectively.
2. Methodology
2.1. Description of simplified inlet model
The supersonic inlet, as depicted in figure 1 (Li et al. Reference Li, Gao, Jiang and Yang2013), exhibits a highly complex flow due to the presence of background waves. Typically, when the cowl shock impinges downstream of the shoulder corner, a continuous reflection and intersection between the cowl shock and separation-induced shock occur. Furthermore, the presence of expansion waves originating from the shoulder exacerbates this complexity (Tan et al. Reference Tan, Sun and Huang2012; Kong et al. Reference Kong, Chang, Li and Li2020). In the relevant literature, the free-stream Mach number and model configurations are usually provided. Based on the oblique shock solution to the Rankine–Hugoniot equations, we obtain the cowl compression angle  $\alpha _1$ and the Mach number $Ma_{cowl}$ before the cowl-induced incident shock. Statistically speaking, $\alpha _1$ is usually 10 $^\circ$–15 $^\circ$ (Weir et al. Reference Weir, Reddy and RUPP1989; Rodi, Emami & Trexler Reference Rodi, Emami and Trexler1996; Schmitz & Bissinger Reference Schmitz and Bissinger1998; Sanders & Weir Reference Sanders and Weir1999; Taguchi et al. Reference Taguchi, Futamura, Shimodaira, Morimoto, Kojima and Okai2003; Albertson, Emami & Trexler Reference Albertson, Emami and Trexler2006; Sanders & Weir Reference Sanders and Weir2008; Chang et al. Reference Chang, Wang, Bao, Qin, Niu and Xue2012; Tan et al. Reference Tan, Sun and Huang2012; Gounko, Mazhul & Nurutdinov Reference Gounko, Mazhul and Nurutdinov2014; Zhang et al. Reference Zhang, Tan, Sun and Rao2015, Reference Zhang, Tan, Sun, Bu and Rao2016; You et al. Reference You, Yu, Le, Yang, Rong and Li2017; Zhang et al. Reference Zhang, Tan, Sun, Chen and Li2017; Devaraj et al. Reference Devaraj, Jutur, Rao, Jagadeesh and Anavardham2020; Huang et al. Reference Huang, Tan, Cai and Sun2021; Saravanan et al. Reference Saravanan, Desikan, Francise and Kalimuthu2021), as shown in figure 2.

Figure 1. The structure of a typical supersonic inlet.

Figure 2. Statistics of the Mach number after the forebody compression of the supersonic inlet and cowl compression angle.
This study employs two plates and a shock generator to simulate the flow phenomenon associated with cowl-induced SWBLIs influenced by the inlet shoulder. Specifically, a base plate is fixed parallel to the incoming flow direction, while another plate is connected at an expansion angle of 12 $^\circ$ to simulate an inlet shoulder. The utilisation of a rotatable/adjustable shock generator allows the manipulation of shock intensity and impingement location.
2.2. Shock generator and plate with expansion
The geometric parameters of the shock generator are presented in figure 3, with the origin of the coordinate system for each test case marked at the intersection point between the expansion corner and the centreline of the base expansion corner and the centreline of the base plate. The  $x$,
$x$,  $y$ and $z$ axes correspond to the streamwise, base plate normal and spanwise directions, respectively. To mitigate the influence of expansion waves originating from the trailing edge of the shock generator, a 100 mm length shock generator is employed in all cases. The fixed expansion angle of the plate is $\alpha _{Ec}=12^\circ$. Table 1 lists specific experimental settings under different operating conditions including the vertical distance ( $h$) between the leading edge of the shock generator and the bottom plate, width ( $w$) of the shock generator, wedge angle ( $\alpha _1$), calculated shock angle ( $\beta _1$), intersection point ( $O_2$) between the incident shock and the centreline of bottom plate (without considering the effect of the expansion waves on the incident shock) and the distance in $x$-axis direction from the origin $O_1 (d=x_{O2}-x_{O1}$, with the undisturbed upstream boundary layer thickness $\delta _0$ employed to obtain non-dimensional lengths). Cases 1–3, 4–7 and 8–12 correspond to shock waves with wedge angles of $10^\circ, 12^\circ$ and $15^\circ$, respectively – these shock waves incident at different downstream positions to the expansion corner.

Figure 3. Schematic diagram of the shock generator. (a) Centreline cross-section of the shock generator and base plate; (b) geometric parameters of the shock generator.
Table 1. Key dimensions of shock intensity and impingement location for all configurations tested.

2.3. Wind tunnel
This investigation was conducted in a wind tunnel at Nanjing University of Aeronautics and Astronautics. The operating time exceeded 14 seconds, the exit section of the Laval nozzle was a square with dimensions  $200\times 200\ {\rm mm}^2$ and a uniform supersonic flow of Mach 2.73 was produced downstream of the nozzle. The total pressure of the incoming flow was $100.5\pm 0.3 {\ {\rm kPa}}$, the total temperature was $287.0\pm 1.5 {\ {\rm K}}$ and the unit Reynolds number was $9.2\times 10^6{\ {\rm m}}^{-1}$.
The relative position of the model with respect to the wind tunnel is depicted in figure 4(a), while figure 4(b) shows a photograph of the test model inside the wind tunnel. The test section primarily comprised a shock generator, a bottom plate with an expansion angle and the sidewalls, as illustrated in figure 4(c). The bottom plate had a channel width of 90 mm with the expansion corner located at a distance of 198 mm downstream of the leading edge. Additionally, there was an interval of 57 mm between the leading edge of the bottom plate and the sidewall. We employed short sidewalls to limit the development of the sidewall boundary layer and minimise its impact on flows within the central region. An optical glass observation area covered the entire pressure measurement zone as indicated in figure 4(a) and was mounted on the sidewall. A rough band positioned approximately 5 mm downstream of the leading edge of the bottom plate promoted the incoming flow boundary layer transition and ensured a fully developed turbulent boundary layer upstream of the SWBLI region. Winglets were installed on both sidewalls to prevent potential lateral flow from disturbing the incoming boundary layer. A relatively high angle of the wedge during wind tunnel operation will cause a large contraction of the flow channel in the test model, which may cause the flow field to unstart. The experiments were performed by placing the shock generator horizontally and turning to the preset angle after the flow field was successfully established.

Figure 4. Test model. (a) Relative positions of the model and the wind tunnel; (b) photograph of the test model; (c) schematic diagram of the test section.
To measure the velocity profile of the incoming flow boundary layer, a removable miniature Pitot probe was positioned 160 mm downstream of the leading edge of the bottom plate. The Mach number profile was obtained from the Pitot–pressure profile and wall static pressure according to the Rayleigh–Pitot relation (Anderson Reference Anderson2011). Additionally, the Crocco–Busemann relation (Crocco Reference Crocco1932; Busemann Reference Busemann1935) was used to calculate the correlation between the local velocity and temperature in the turbulent boundary layer. Furthermore, the gas density was determined using an ideal gas state function while the wall friction coefficient  $C_{f,0}$ was calculated based on an empirical correlation (Narasimha & Viswanath Reference Narasimha and Viswanath1975). The relevant parameters of the turbulent boundary layer are listed in table 2 for the free-stream Mach number $Ma_0$, free-stream streamwise velocity $u_0$, undisturbed upstream boundary layer thickness $\delta _0$, displacement thickness $\delta ^\ast$, momentum thickness $\theta$, shape factor $H$, Reynolds number ${\textit {Re}}_\theta$ and wall friction coefficient $C_{f,0}$. The original and transformed velocity profile using the method of van Driest (Van Driest Reference Van Driest1951) is plotted in figure 5. The log law $u^+=(1/\kappa )\ln {y}^++C$ is plotted with $\kappa =0.41$ and $C=5.1$. The measurements indicate that the observed velocity profile exhibits fuller than the 1/7th power law. The velocity profiles of the turbulent boundary layer in high-precision simulations are also utilised for comparison (Schlatter & Örlü Reference Schlatter and Örlü2010; Wang et al. Reference Wang, Sandham, Hu and Liu2015).
Table 2. Turbulent boundary layer parameters.


Figure 5. Velocity profile of boundary layer upstream of ISWBLI. (a) Comparison between the present results and the 1/7th power law turbulent velocity profile; (b) comparison between van Driest transformed velocity profile and previous study.
Static pressure measurements, schlieren photographs and surface oil-flow visualisations were used to detect the supersonic flow field. Forty static pressure measurement tappings were evenly distributed along the centreline of the bottom plate at a flow-direction spatial resolution of 3 mm in the range  $-48 \sim 69\,{\rm mm}$ on the $x$ axis. The pressure tappings were connected to pressure transducers (CYG503, double Bridge Inc.) with a measurement range of 50 kPa and an accuracy of 0.1 % FS (i.e. $\pm 0.05$ kPa) using rubber tubing. The experimental pressure signals were acquired with a 1 kHz sampling rate using a National Instrument DAQ 6225 card. All pressure transducers were calibrated before each run to eliminate drift errors.
The Toepler Z-type schlieren system was set up to study the flow field of the observation section with a xenon lamp used as a point light source, a pair of concave mirrors with a diameter of 200 mm, a focal length of 200 mm and a knife edge placed horizontally. A high-speed camera (NAC Memrecam HX-3) captured image sequences with a resolution of  $738\times 354$ ( $\approx$7 pixels mm $^{-1}$) at a 5k frame rate.
The oil-flow visualisation used a mixture of oleic acid, silicone oil and titanium dioxide powder. Before the test, the oil mixture was smeared evenly on the upper surface of the base plate where the main observation area was replaced with optical glass. To avoid erroneous features damaging the oil-flow display results when the wind tunnel was closed, the photographs were taken in real time during the operation of the wind tunnel. The camera (Canon 1Dx Mark II) was placed under the bottom plate to capture images with a resolution of  $5742\times 3648$. The camera was calibrated prior to each test in order to correct the perspective and ensure an accurate physical scale.
3. Results
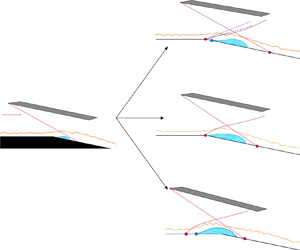
In this section the wind tunnel experiment results are presented. Figure 6(a) shows the schlieren visualisation region. The relative size between the visualisation region and the shock generator is consistent with that of the experimental set-up. The determination of separation scale and shock strength is described in chapter 4.2.4 in the textbook of Babinsky & Harvey (Reference Babinsky and Harvey2011). According to the interaction scale correlation derived by Settles & Bogdonoff (Reference Settles and Bogdonoff1982), considering current conditions and the definition, the shock waves induced by 10 $^\circ$ and 12 $^\circ$ wedges in this study can be classified as weak and strong, respectively. The flow field structures of EC-ISWBLI can be classified into three types. The first type is characterised by the presence of expansion waves originating from the expansion corners. The separation point occurs downstream of the expansion corner with a weak shock. A schematic diagram of the first type of EC-ISWBLI is shown in figure 6(b). In the second type of EC-ISWBLI, there are no expansion waves due to large-scale separation induced by the strong shock intensity (figure 6c). It should be noted that the expansion corner induces a ‘lock-in’ effect, where the separation onset is locked nearly at the expansion corner for different incident positions. The third type of EC-ISWBLI also lacks expansion waves originating from the expansion corner with a larger separation scale and an upstream onset of separation far from the corner (figure 6d). The shock induced by a $15^\circ$ wedge is considered sufficiently strong because of the large-scale separation across the expansion corner. The sufficiently strong shock induces this type of interaction, with a shock impingement point near the corner. Detailed experimental results are provided below.

Figure 6. Schematic diagram of EC-ISWBLI. (a) Schlieren visualisation region; (b) the first type of EC-ISWBLI; (c) the second type of EC-ISWBLI; (d) the third type of EC-ISWBLI.
3.1. The first type of EC-ISWBLI
The first type of EC-ISWBLI includes three shock impingement positions for  $\alpha _1=10^\circ$, corresponding to cases 1–3. Schlieren images in figure 7(a) depict a solid white line at the wall's edge to highlight its boundary with the flow field, the separation area is encircled by the orange dashed line and the shock impingement position is marked by a white solid point. A horizontal knife edge placed in the schlieren system reveals density variations along the vertical direction through different greyscale intensity in the images. Visible flow features include expansion waves originating from the expansion corner, incoming turbulent boundary layer and incident shock appearing black, while separation-induced shock and compression waves converging on reattachment shock appear white. Although case 1 shows both separation shock and reattachment shock, the separation bubble is not prominent and is of the order of one boundary-layer thickness in height. With the shock impingement position moving downstream, shear layer height exceeds that of the boundary layer in case 2; further downstream in case 3, there is a significant increase in separation scale.

Figure 7. Flow field feature for  $\alpha _1=10^\circ, d/\delta _0 = 3.5,7.0,10.0.$ (a) Schlieren images in which the following abbreviations are used: TBL, turbulent boundary layer; ISW, incident shock wave; EW, expansion wave; SS, separation shock; RS, reattachment shock; TS, Transmitted shock. (b) Schematic diagram of the first type of EC-SWBLI with separation.
Figure 7(b) shows a schematic of the first type of EC-SWBLI in which the main flow expands under the influence of the corner. Based on mass conservation law, a series of expansion waves originate near the expansion corner. The weak incident shock induces an adverse pressure gradient, leading to flow separation. However, the scale of separation is small, and it is initiated downstream of the expansion corner. In the shear layer downstream of the separation point, the thickness between the main flow and the low-speed flow in the separation increases. This compresses the main flow, with a series of weak compression waves appearing and eventually converging into a separation shock.
Figure 8 illustrates the pressure distribution along the centreline of the bottom plate, and for comparison purposes, we introduce the pressure of ISWBLI induced by an incident shock with the same strength impinging on a plate (denoted P-ISWBLI) (Li et al. Reference Li, Zhang, Tan, Jin and Li2022). The horizontal coordinates are normalised by their respective boundary layer thicknesses and the initial pressure rise location of P-ISWBLI serves as the origin of the horizontal coordinate. Previous studies have shown that when large-scale separation occurs in SWBLIs, the overall surface static pressure rise can generally be divided into two stages: the first pressure rise at separation ( $\Delta P_S$) and the second pressure rise at reattachment ( $\Delta P_R$). According to FIT, $\Delta P_S$ is only related to the incoming flow conditions and is independent of the shock strength. However, the pressure rise process in the first type of EC-SWBLI differs significantly from that of P-ISWBLI. The pressure distribution of this type of EC-ISWBLI can be categorised into three stages. In the first stage the pressure drops ( $\Delta P_E$) induced by expansion waves originating from the expansion corner; followed by a separation shock-induced pressure rise in the second stage ( $\Delta P_S$) and a reattachment shock-induced pressure rise in the third stage ( $\Delta P_R$). The extent of flow expansion determines the value of $\Delta P_E$. When flow passes through the entire expansion waves, $\Delta P_E$ reaches its theoretical value. However, the flow encounters compression waves before undergoing entire expansion. These compression waves converge into the initial part of the separation shock. Experimental measurements demonstrate that as the incident shock impingement point moves downstream of the corner, the extent of flow expansion becomes larger. In case 3, for $d/\delta _0=10, \Delta P_E=-0.59p_0$, which is only a 3 % deviation from $-0.61p_0$ (theoretical value), indicating that flow undergoes nearly complete 12 $^\circ$ expansion. The pressure rise in the second stage is significantly different from that in P-ISWBLI and is governed by a coupling between the shock intensity and impingement position. When the shock impingement point moves downstream, there is a decrease in plateau pressure value and an increase in flow scale. Here $\Delta P_{S}$ exhibits a slight increase compared with the pressure of incoming flow due to the presence of $\Delta P_{E}$. After the third stage, the peak pressure plateau decreases with more pronounced pressure drops induced by expansion waves. Normally, in P-ISWBLI experiments, an expansion fan emanating from the shock generator tail has unavoidable effects on flow fields due to the model geometry limitations. This causes peak pressure drops and makes it difficult for pressure plateau to occur. In this paper, however, the lack of limitation on the bottom plate with an expansion angle allows current generator dimensions to be designed longer so as to keep tail expansion fan effects away from the SWBLI region.

Figure 8. Static pressure distribution along the centreline of the bottom plate for  $\alpha _1=10^\circ, d/\delta _0=3.5,7.0,10.0$.
3.2. The second type of EC-ISWBLI
The second type of EC-ISWBLI contains  $\alpha _1=12^\circ$ and 15 $^\circ$ for different shock impingement positions, corresponding to cases 4–11. Figure 9 presents a compilation of schlieren images captured at a wedge angle of $\alpha _1=12^\circ$. As the incident impingement position moves from $d =4.7\delta _0$ to $d =11.3\delta _0$, both the height and flow-direction scale of the separation bubble increase noticeably. Interestingly, all instances of separation shock initiation occur near the expansion corner, while the expansion fan emitted from the top of the shear layer and reattachment shock move downstream as the incident impingement position deviates further away from the corner.

Figure 9. Schlieren images for  $\alpha _1=12^\circ, d/\delta _0=4.7,7.0,9.0,11.3$.
The schlieren shadow image for  $\alpha _1=12^\circ$ in P-ISWBLI is shown in figure 10(a), as obtained from Li et al. (Reference Li, Zhang, Tan, Jin and Li2022). In figure 10(b) a schematic diagram of the shear layer edge is presented for cases 4–7 and the P-ISWBLI. To facilitate a comparison between EC-ISWBLI and P-ISWBLI, the downstream flow field of the expansion corner is rotated counterclockwise by 12 $^\circ$ around the corner so that the entire surface of the bottom plate becomes horizontal. Additionally, the schlieren shadow images for P-ISWBLI are appropriately scaled to ensure a consistent boundary layer thickness. The schematic diagram depicts the inviscid incident shock waves (i.e. red solid lines), the boundaries of the shear layer (i.e. cyan solid lines), the expansion corner (i.e. the big red solid point), the shock impingement point (i.e. red solid lines), the top of the shear layer edges (i.e. orange points), the connection line through the former points (i.e. blue dashed line) and the shear layer boundary of P-ISWBLI (i.e. the black solid line). The scale of the shear layer gradually increases as the incident shock impingement point moves downstream, eventually becoming nearly coincident with the shear layer edge observed in P-ISWBLI. The orange solid points represent the top of the shear layer and are connected by a blue dashed line, which intersects the wall at virtual triangle point $O'$. The angle between this orange line and the wall is defined as $\alpha _{VTO}$, with a value of 18.0 $^\circ$ for $\alpha _1=12^\circ$. The shear layer demonstrates nearly linear growth as the shock impingement point gradually moves downstream. Here $\alpha _{VTO}$ serves as an indicator of the speed at which the shear layer expands, with a higher value denoting accelerated growth.

Figure 10. Comparison between shear layer edges for  $\alpha _1=12^\circ, d/\delta _0=4.7,7.0,9.0,11.3$ and $\alpha _1=12^\circ$, P-ISWBLI. (a) Schlieren image for $\alpha _1=12^\circ$, P-ISWBLI (Li et al. Reference Li, Zhang, Tan, Jin and Li2022). (b) Schematic depiction of shear layer edge.
The schlieren images of a wedge angle of  $\alpha _1=15^\circ$ are presented in figure 11. It is noteworthy that due to the high intensity of the shock, establishing a successful flow field without introducing flow control under the geometric limitation is a challenge when the model consists of a flat plate with sidewalls. The contraction channel composed of the shock generator, the bottom plate and the sidewalls, exhibit a threshold for its contraction ratio based on the flow conservation law. Once the threshold is exceeded, the inner channel becomes unstart. The increase in wedge angle and the resulting larger-scale separation will lead to an augmentation of the contraction ratio. Experimental data of the angle of wedge beyond 12 for P-ISWBLI are poorly documented. However, by incorporating a bottom plate with an expansion angle, we are able to complete the experiment for $\alpha _1=15^\circ$. The separation is clearly visible with a further increase in the separation height and flow-direction scale compared with the separation at $\alpha _1=12^\circ$. The clearer separation shock indicates that the compression waves near the onset of the separation bubble converge rapidly into the initial part of the separation shock. Although no image is currently available for P-ISWBLI at $\alpha _1=15^\circ$, applying the transformation for $\alpha _1=12^\circ$ in cases 8–11 yields figure 12. Furthermore, it is observed that different shock intensities do not affect the geometrical similarity of the shear layer for this type of interaction but do influence its rate of change ( $\alpha _{VTO}=18.5^\circ$ for $\alpha _1=15^\circ$).

Figure 11. Schlieren images for  $\alpha _1=15^\circ, d/\delta _0=3.5,5.1,7.0,9.0$.

Figure 12. Comparison between shear layer edge for  $\alpha _1=15^\circ, d/\delta _0=3.5,5.1,7.0,9.0$.
A schematic diagram of the second type of EC-SWBLI is presented in figure 13, where a stronger incident shock induced large-scale flow separation appearing with a separation point near the expansion corner. On the windward side of the separation bubble downstream of the separation point, the thickness between the main flow and the low-speed flow of the separation bubble within the shear layer increases. As a result, the capacity for compression of the main flow exceeds the expansion effect on the main flow caused by the expansion corner.

Figure 13. Schematic diagram of the second type of EC-SWBLI with separation.
Figures 14 and 15 depict the pressure distributions along the centre of the bottom plate at  $\alpha _1=12^\circ$ and 15 $^\circ$, respectively. The key difference between the second type of EC-ISWBLI and the first type is whether expansion waves appear or not. When the shock is strong, separation-induced flow deflection beyond the expansion angle causes the main flow to move away from rather than close to the expansion plate. This results in no drop in wall pressure distribution due to the absence of expansion waves. Only two pressure rises occur (caused by separation shock $\Delta P_S$ and reattachment shock $\Delta P_R$) similar to the large-scale separation in P-ISWBLI. Although $\Delta P_E$ disappears, the peak pressure plateau still significantly drops compared with P-ISWBLI. This will be discussed further in subsequent sections. The pressure distributions for different incident shock intensities are similar. The separation pressure plateau gradually decreases as the shock impingement position moves downstream until reaching a certain value with increasing flow-direction scale, which indicates a gradual increase in separation scale consistent with the schlieren image observations.

Figure 14. Comparison flow features in terms of static pressure distribution along the centreline of bottom plate for  $\alpha _1=12^\circ, d/\delta _0=4.7,7.0,9.0,11.3$ and P-ISWBLI.

Figure 15. Static pressure distribution along the centreline of bottom plate for  $\alpha _1=15^\circ, d/\delta _0=3.5,5.1,7.0,9.0$.
3.3. The third type of EC-ISWBLI
The third type of EC-ISWBLI corresponds to case 12, with  $\alpha _1=15^\circ, d/\delta _0=0.5$. Figure 16(a) presents a schlieren image illustrating that as the wedge angle $\alpha _1$ increases to 15 $^\circ$ and the incident shock impingement point approaches the corner, the expansion corner loses its effectiveness in suppressing separation crossing the corner. The separation becomes large scale and the separation onset is far upstream of the expansion corner at a distance of approximately 7.5 $\delta _0$. The schematic diagram of the third type of EC-SWBLI is presented in figure 16. In cases where the incident shock is sufficiently strong and the shock impingement point is close to the expansion corner, a significant separation occurs near the wall, rendering the expansion corner ineffective in suppressing flow separation crossing the corner. The separation rapidly intensifies and its onset takes place far upstream of the expansion corner. The flow field structure observed in this region upstream of the expansion corner exhibits similarities with that observed in P-ISWBLI.

Figure 16. Flow field features for  $\alpha _1=15^\circ, d/\delta _0=0.5$. (a) Schlieren image; (b) schematic diagram of the third type of EC-SWBLI with a large-scale separation.
Figure 17 displays the pressure distribution along the centre of the bottom plate and shows a two-stage pressure rise that is similar to that observed in the second type of EC-ISWBLI. In this case,  $\Delta P_s/p_0$ further rises to 2.44 while maintaining an overall pressure rise around 3.27 $p_0$. Due to the large separation shock angle and the long length of the shock generator, the separation shock impinges on the shock generator as clearly seen in figure 16(a), occurring about $17\delta _0$ away from the onset of the separation. Given its significant distance from the interaction region and plateau-like behaviour observed in the peak pressure, the influence of the reflected shock on the interaction region can be ignored.

Figure 17. Static pressure distribution along the centreline of the bottom plate for  $\alpha _1=15^\circ, d/\delta _0=0.5$.
3.4. Oil-flow visualisation
Surface oil-flow visualisation experiments were conducted to obtain a detailed topology of the flow field for  $\alpha _1=12^\circ$ in the second type of EC-ISWBLI. Figure 18 illustrates the separation topologies for case 4 ( $d=4.7\delta _0$), case 5 ( $d=7.0\delta _0$) and case 7 ( $d=11.3\delta _0$) with annotated diagrams below. The significant feature is that as the shock impingement point moves downstream, the separation line formed by the oil accumulation remains close to the expansion corner while the reattachment line formed by discrete curved flow lines moves away from it.

Figure 18. Surface topologies of the second type of EC-ISWBLI. (a) Case 4,  $\alpha _1=12^\circ, d/\delta _0=4.7$; (b) case 5, $\alpha _1=12^\circ, d/\delta _0=7.0$; (c) case 7, $\alpha _1=12^\circ, d/\delta _0=11.0$. Red, blue and purple dashed lines represent the separation point, reattachment point and inviscid shock impingement point on the centreline of the bottom plate, respectively.
Figure 18(a) is the surface-flow topology for case 4 ( $d=4.7\delta _0$). The separation scale on centreline ${\rm Lsep}=19.9\,{\rm mm}$ (4.73 $\delta _0$) and the reattachment line are close to the impingement point obtained by the inviscid shock relations. The separation scale in case 4 is the smallest among the large-scale separations discussed in this study, yet it still reaches 4.73 $\delta _0$, which falls within the range of large-scale separation as defined in Babinsky & Harvey (Reference Babinsky and Harvey2011). Therefore, through oil-flow visualisation, the description of the flow separation scale in accordance with definitions is validated. The distributions of critical points of the separation topology contain mainly: (i) two focus points near the two sidewalls ( $F_1, F_1'$); (ii) two saddle points ( $S_1, S_2$) in the middle of the upstream separation line and downstream reattachment line, respectively; (iii) two separation nodes near the two sidewalls ( $N_1, N_1'$); and (iv) a pair of reattachment nodes near the two sidewalls ( $N_2, N_2'$). The separation springs from separation saddles $S_1$ and spirals around focus points. Reattachment appears along the attachment line going through reattachment saddle point $S_2$. Figure 18(b) is the surface-flow topology for case 5 ( $d=7.0\delta _0$), the separation scale on centreline ${\rm Lsep}=29.8\,{\rm mm}$ (7.10 $\delta _0$) and the reattachment line downstream of the impingement point. The critical points are basically the same as in the former case. Figure 18(c) shows the surface-flow topology for case 7 ( $d=11.3\delta _0$), the separation scale on centreline ${\rm Lsep}=45.4\,{\rm mm}$ (10.81 $\delta _0$) and the reattachment line upstream of the impingement point. The separation topology becomes more complex compared with the former two cases. New critical points appear: (v) two symmetric reattachment nodes ( $N_3, N_3'$) about the centreline, and (vi) reattachment saddles ( $S_3, S_3'$). The streamlines originating from two nodes ( $N_3, N_3'$) converge with each other and lead to the emergence of saddles $S_2$ on the centreline. An asymptotic-convergence line connects a group of saddles: $S_1{-}S_2$. In addition, the streamline originating from two nodes ( $N_3, N_3'$) collides with the streamline from the near-sidewall region leading to the emergence of new saddles $S_3, S_3'$. The two central flow regions are less affected by the sidewalls while the region occupied by the focal point ( $F_1, F_1'$) is more affected.
The results above demonstrate that the relative positions of the impingement point and the expansion corner significantly affect the separation topology. When the impingement point is close to the corner, sidewall-induced corner separation is suppressed on a small scale. As the shock impingement point moves away from the corner, this suppression capability decreases, resulting in a rapid increase in the corner separation area. The streamlines close to the corner vortex exhibit noticeable bending as they converge on the reattachment line, with additional critical points appearing.
4. Discussion
This section presents a theoretical analysis aimed at achieving a comprehensive understanding of EC-ISWBLI. In § 4.1 we develop a simplified inviscid model combined with the shock polar for the second and third type of EC-ISWBLI with large-scale separation. This explains why the overall surface pressure rise is lower in the absence of Prandtl–Meyer waves compared with P-ISWBLI. Subsequently, a combination of FIT with the inviscid model is employed to establish two criteria in § 4.2, which provide valuable insights into the evolution of separations and determine the threshold for the occurrence of the ‘lock-in’ effect.
4.1. Inviscid model for EC-ISWBLI
Although viscosity plays a crucial role in SWBLI flows, the incorporation of inviscid theory enables us to capture and describe the primary characteristics of the flow (Délery et al. Reference Délery, Marvin and Reshotko1986). The structure of a flow field with separation can be considered an ideal gas flow, where the viscous component of the flow is substituted by an isobaric-dead air region. In an actual flow field, a slip line (shear layer) isolates the viscous portion from the outer supersonic flow. However, in the equivalent model, the viscous boundary can be simplified to an isobaric boundary (Edney Reference Edney1968; Grossman & Bruce Reference Grossman and Bruce2018).
The inviscid models for the P-ISWBLI and the second type of EC-ISWBLI are illustrated in figure 19. In the case of P-ISWBLI, the isobaric-dead air region is simplified to a triangle-like shape. The initial portion of the separation bubble exhibits an inclination angle  $\alpha _2$, which induces the separation shock $C_2$. Point $I$ is formed by the intersection between separation shock $C_2$ and incident shock $C_1$, the former becomes transmitted shock $C_3$ when the latter becomes transmitted shock $C_4$. Here $C_4$ intersects the isobaric region at point $T$. Due to a nearly constant pressure level within the separation bubble, the pressure rise provoked by $C_4$ is compensated by a series of centred expansion waves emanating from $T$. Meanwhile, the flow turns towards the wall and impacts at an ’inviscid’ reattachment point $R$. Eventually, flow deflects horizontally, leading to the occurrence of reattachment shock $C_5$. The pattern made by shocks $C_1, C_2, C_3, C_4$ is a type I shock–shock interaction according to Edney's classification (Edney Reference Edney1968). The inviscid model for the second type of EC-SWBLI shares similarities with that for P-ISWBLI but it includes an expansion angle $\alpha _{Ec}$. Additionally, the flow passing through the expansion fan $E_1$ only turns at an angle $\alpha _{Ec}$ instead of changing direction horizontally, resulting in a weaker reattachment shock. The third type of EC-ISWBLI has an initial deflection angle upstream of the corner and excludes $\alpha _{Ec}$, but other aspects remain similar to the second type of EC-ISWBLI. The shock polar is used to understand the flow field of the second and third type of EC-ISWBLI with large-scale separation. The pertinent content is described in the Appendix.

Figure 19. Schematic diagrams of the comparison of the inviscid model for EC-ISWBLI and P-ISWBLI. (a) Regular shock reflection at intersection I in P-ISWBLI; (b) regular shock reflection at intersection I in the second type of EC-SWBLI; (c) shock reflection on the isobaric border at intersection T in P-ISWBLI; (d) shock reflection on the isobaric border at intersection T in the second type of EC-SWBLI.
The primary distinctions between EC-ISWBLI and P-ISWBLI lie in the following aspects. (i) The initial separation deflection angle in the former is lower than that in the latter. Specifically,  $\alpha _2=12.36^\circ$ in P-ISWBI while its value changes from 5.37 $^\circ$ to 3.76 $^\circ$ as the impingement point moves downstream in EC-ISWBLI. (ii) The final flow direction is $\alpha _{Ec}$ in EC-ISWBLI but 0 $^\circ$ in P-ISWBLI, corresponding to an overall pressure rise $p_5/p_0$ that increases rapidly from 2.20 to 4.31 with a growth rate of up to 96 %. The expansion of the base plate geometry leads to a reduction in reattachment pressure in EC-ISWBLI. Despite the absence of Prandtl–Meyer waves, the overall pressure rise remains significantly lower than that observed in P-ISWBLI. Table 3 lists the key flow field parameters. As the P-ISWBLI result for this wedge is not available, we compare the pressure rise obtained from FIT (specific expression is given in § 4.2) with that for $\alpha _1=15^{\circ }$. The flow passing through the flow domain is similar to that for $\alpha _1=12^{\circ }$.
Table 3. Key flow parameters for  $\alpha _1=12^\circ$ and $\alpha _1=15^\circ$.

Region 5 represents the final form of the inviscid model and accumulates errors that are not accounted for by viscosity. The pressure in this region is compared with the experimental measurement (table 4), revealing a relative error of approximately 6 %. This error component can be attributed to a sequence of isentropic compression waves occurring near the reattachment region, which are regarded as reattachment shocks. The magnitude of the error suggests the inviscid model can be applied to the second and third types of EC-ISWBLI.
Table 4. The comparison of pressure between the current measurement and the inviscid model theory value.

4.2. Feasibility of FIT for EC-ISWBLI
One of the major results of the FIT is that, when the separation shock intensity is sufficiently high, the pressure rise induced by separation in the SWBLI region is governed solely by the flow properties and is thus independent of the overall configuration (Chapman, Kuehn & Larson Reference Chapman, Kuehn and Larson1958). The experimental validation of FIT has been successfully demonstrated in P-ISWBLI; however, there is currently a dearth of pertinent experimental verification for FIT in EC-ISWBLI. Based on current experimental data and the inviscid model proposed in § 4.1, we aim to examine the feasibility of FIT and elucidate its applicability in specific situations within EC-ISWBLI.
Specifically, Erdos & Pallone (Reference Erdos and Pallone1962) suggested that the pressure rise during the free utilisation process is governed by
 \begin{equation} \frac{p-{{p}_{0}}}{{{q}_{0}}}=F(\bar{x})\sqrt{\frac{2{{C}_{f,0}}}{{{(Ma_{0}^{2}-1)}^{1/2}}}}, \end{equation}
where the universal correlation function  $F( {\bar {x}} )$ is defined by
 \begin{equation} F({\bar{x}})=\sqrt{{{f}_{1}}({\bar{x}}){{f}_{2}} ({\bar{x}} }), \end{equation}
where
 \begin{equation} {f_1}\left( {\bar x} \right) = {\int_{\bar x_0}^{\bar x} {\left( {\frac{{\partial \bar \tau }}{{\partial \bar y}}} \right)} _w}\,{\rm{d}}\bar x,\quad {f_2}\left( {\bar x} \right) = \frac{{{\rm{d}}\bar \delta _{}^*}}{{{\rm{d}}\bar x}},\quad \bar \tau = \frac{\tau }{{{\tau _{w0}}}},\quad \bar y = \frac{y}{{{\delta ^*}}},\quad \bar x = \frac{{x - {x_0}}}{{{L_{rise}}}}. \end{equation}
Here,  $\tau$ is the shear stress, $\tau _{w0}$ is the wall shear stress at the interaction origin $x_0$, $\delta ^\ast$ is the boundary layer displacement thickness and $L_{rise}$ is the length characteristic of the streamwise extent of free interaction. The values of the separation point and pressure plateau proposed by Erdos & Pallone (Reference Erdos and Pallone1962) are $F(\bar {x})_{separation}=4.22$ and $F(\bar {x})_{plateau}=6.00$ for a turbulent flow. This represents that when the developed steady-separation zones form, the value of $F(\bar {x})_{plateau}$ calculated based on the pressure rise induced by separation should be 6.00.
For the current EC-ISWBLI tests, the shock impingement position is located downstream of the corner, while the interaction origin occurs downstream of the corner for the first type of interaction, near the corner for the second type of interaction and upstream of the corner for the third type of interaction based on previous classification. Consequently, the universal correlation function can be derived by selecting parameters related to flow passing through expansion waves and undisturbed incoming flow.
When considering the presence of expansion waves, the physical variables can be determined through the utilisation of the following equation: the airflow passing through the expansion waves follows an isentropic process. Thus, the flow parameters before and behind the expansion fan satisfy the equation
 \begin{gather} {{p}_{j}}={{p}_{i}}\varTheta \left( M{{a}_{j}},M{{a}_{i}},\gamma \right)={{p}_{i}}{{\left[ \left( \frac{2+\left( \gamma -1 \right)Ma_{i}^{2}}{2+\left( \gamma -1 \right)Ma_{j}^{2}} \right) \right]}^{\gamma /\left( \gamma -1 \right)}}, \end{gather}
 \begin{gather} {{T}_{j}}={{T}_{i}}J({{p}_{j}},{{p}_{i}},\gamma )={{T}_{i}}{{\left( \frac{{{p}_{j}}}{{{p}_{i}}} \right)}^{({\gamma -1})/{\gamma }}}. \end{gather}
Subscripts  $i$ and $j$ indicate the parameters before and behind the expansion waves, respectively. In these equations, the airflow is regarded as an ideal gas with a specific heat ratio $\gamma =1.4$. The viscosity and heat exchange of the gas are neglected. The Mach number $Ma_{Ec0}$ and static temperature $T_{Ec0}$ at the interaction origin are governed by the relations
 \begin{gather} {{p}_{Ec0}}={{p}_{0}}\varTheta \left( M{{a}_{Ec0}},M{{a}_{0}},\gamma \right), \end{gather}
 \begin{gather} {{T}_{Ec0}}={{T}_{0}}J({{p}_{Ec0}},{{p}_{0}},\gamma ). \end{gather}
 The calculation of the other relevant physical parameters can be found in § 2.3. Given the current flow conditions and universal correlation function  $F(\bar {x})_{plateau}=6.00$, the critical value $p_{cr1}/p_0$ can be determined as 3.90 when the flow passes through complete expansion waves for $\alpha _{Ec}=12^\circ$. This implies that once the pressure rise ratio exceeds $p_{cr1}$, the separation bubble occurring downstream of the expansion corner cannot maintain stability and its structure will be deformed due to the viscosity effect. This phenomenon can explain why the separation bubble not only occupies the vicinity of the impingement position of the shock but also extends into a larger spatial scale. Taking case 6 as an example, the corresponding diagram of the evolution of the flow field can be observed in figure 20. Initially, the flow experiences expansion waves originating from the expansion corner before encountering the incident shock. The pressure rise ratio of the expanded airflow before and after passing through the incident shock wave is 5.54, which is higher than the critical value. This leads to the rapid spread of separation and its onset moves towards the expansion corner. The expansion waves are compensated by the formation of the separation bubble, causing a decrease in the overall pressure rise ratio.

Figure 20. Evolution of EC-ISWBLI flow field for case 6,  $\alpha _1=12^\circ, d=9.0\delta _0, \alpha _{Ec}=12^\circ$. Upper panel: schematic diagram of configuration; lower panel: distribution of wall pressure. (a) Initial inviscid flow field; (b) eventual steady flow field.
For the second and third type of interactions, the interaction origin is located near or upstream of the expansion corner as the expansion waves vanish. The physical variables of the incoming flow prior to the corner are used to determine  $F(\bar {x})$, as depicted in figure 21 that shows the profile of $F(\bar {x})$. The position at which the initial pressure rises is taken as the origin of the normalised streamwise coordinates. For case 8, $F(\bar {x})$ is close to the fit line. The characteristic length $L_{rise}$ for normalisation is $L_{rise}=x_{ref}-x_0$. Here $x_{ref}$ is the $x$ coordinate at which $F(\bar {x})= 4.22$ in case 8. Based on figure 21, it can be observed that the calculated $F(\bar {x})$ and the fit line derived from the experimental P-ISWBLI exhibit a favourable agreement from the initial pressure rise until before the separation plateau. However, except in case 8, there is some deviation between the $F(\bar {x})_{plateau}$ and the fit line. The $F(\bar {x})_{plateau}$ value for the second type interaction in case 8 is noted to be 5.69, whereas for case 12 (the third type interaction), this value exceeds 6.00 and increases to 6.37. This transition indicates that the suppression of separation crossing the expansion corner becomes ineffective and the interaction origin shifts far upstream of the corner location. For the second type of interaction, it is consistently observed that regardless of shock wave intensity or impingement position, the separation onset remains near the expansion corner. We define this phenomenon as the ‘lock-in’ effect of the expansion corner, i.e. separation onset remains suppressed near the expansion corner until $F(\bar {x})_{plateau}$ exceeds the threshold level of 6.00.

Figure 21. The universal correlation function  $F(\bar {x})$ for the second and third type of EC-ISWBLI.
The reason why  $F(\bar {x})_{plateau}$ is lower than 6.00 while the steady large-scale separation still exists can be explained by the altered process of a separation formation due to the expansion corner. From FIT, $F(\bar {x})$ is predominantly influenced by $f_1(\bar {x})$ and $f_2(\bar {x})$, where $f_1(\bar {x})=\int _{\bar {x_0}}^{\bar {x}} ({\partial \bar {\tau }}/{\partial \bar {y}})\,{\rm d}\bar {x}$ and ${f_2}( {\bar x} ) = {{{\rm {d}}\bar \delta _{}^*}}/{{{\rm {d}}\kern0.7pt \bar x}}$ , which represents two balancing processes, with $L_{rise}\ {\rm and}\ {\delta _0^\ast }$ used for non-dimensionalise. The function $f_1(\bar {x})$ reflects the formation process of a separation bubble in which the adverse pressure gradient intensifies while the velocity profile becomes thinner from interaction onset to separation point, $\tau$ also decreases until it reaches zero at the separation point. However, when the ‘lock-in’ effect occurs, the interaction origin is near the corner, especially for $\alpha _1=12^\circ$ as observed from oil visualisation where separation onset happens at the expansion corner. This implies that the integral distance between the interaction onset and separation point becomes shorter resulting in a decrease in value of $f_1(\bar {x})$. On the other hand, the dimensionless function ${f_2}({\bar x} )= {{{\rm {d}}\bar \delta _{}^*}}/{{{\rm {d}}\kern0.7pt \bar x}}$ is ${{\rm d}\delta ^\ast }/{{\rm d}\kern0.7pt x}$ before the introduction of the scaled quantities, with ${{\rm d}\delta ^\ast }/{{\rm d}\kern0.7pt x}\cong \arctan ({{\rm d}\delta ^\ast }/{{\rm d}\kern0.7pt x})=\alpha _2$. Therefore, ${f_2}$ represents the flow deflection angle that corresponds precisely to the displacement effect of the boundary layer. When the expansion corner replaces the plate, the body shape expands outwards, causing the angle between the inclination of the separation bubble and incoming flow to become smaller, leading to a decrease in value of $f_2(\bar {x})$. Eventually, steady-state separation occurs with ${F(\bar {x})}_{plateau}$ below 6.00. The second kind of criteria, $p_{cr2}/p{0}=2.36$, is calculated in a similar way to the first kind of criteria $p_{cr1}/p_0$, using the physical variables of the undisturbed incoming flow. This indicates that the ‘lock-in’ effect disappears once the separation plateau exceeds 2.36 under current flow conditions.
The combination of the inviscid model proposed in § 4.1 and figure 22 provides a more intuitive and comprehensive analysis as follows. In figure 22 the inclination angle of the separation bubble  $\alpha _2$ is depicted, with a value of $\alpha _{2FIT}$ obtained from FIT at 13.18 $^\circ$, while other values of $\alpha _2$ are calculated using the previously proposed inviscid model. It is observed that the expansion corner exhibits the ‘lock-in’ effect, where the threshold is primarily determined by FIT. Once $\alpha _2$ exceeds this threshold, the separation origin occurs far upstream from the corner. Moreover, it should be noted that both shock intensity and shock impingement position dominate the behaviour of $\alpha _2$. Specifically, as shocks weaken or move away from the corner, $\alpha _2$ becomes smaller until it eventually reaches a fixed value for each specific shock case: 8.99 $^\circ$ for $\alpha _1=15^\circ$ and 3.76 $^\circ$ for $\alpha _1=12^\circ$. Fundamentally, it is the outward expansion of the corner body shape that reduces the inclination angle of the separated bubble compared with that of P-ISWBLI. Therefore, the large-scale separation induced by sufficiently strong shock can be maintained in a relatively stable state.

Figure 22. Sketch of the inclination angle of the separation bubble for the second and third type of EC-ISWBLI.
5. Conclusion
This study has presented the findings from a systematic experimental set-up designed to vary the shock intensity and shock impingement position of EC-ISWBLI in Mach 2.73 conditions. By adjusting the shock generator, three different shock wedge angles ( $\alpha _1$ was set at 10 $^\circ$, 12 $^\circ$ and 15 $^\circ$) were investigated while maintaining a fixed expansion angle of 12 $^\circ$. To visualise and quantify the typical flow features, schlieren photography, static pressure measurements and surface oil-flow visualisation were employed.
The interactions can be classified into three types based on observations. Expansion waves originating from the corner occurred in the first type of EC-ISWBLI. The surface pressure distribution consisted of three parts: a pressure drop induced by the expansion waves and two additional parts representing a pressure rise induced by separation shock and reattachment shock, respectively. In the second type of EC-ISWBLI there was large-scale separation near the corner, resulting in the disappearance of expansion waves and corresponding pressure drops. The expansion corner induces a ‘lock-in’ effect, where the separation onset is locked nearly at the expansion corner for different incident positions. When the shock wedge angle is 15 $^\circ$ and the distance between the shock impingement point and expansion corner ( $d$) equals $0.5\delta _0$ (boundary layer thickness), streamwise separation extended beyond the corner with a separation point located at $7.5\delta _0$ upstream from the corner, namely the third type of EC-ISWBLI. The large-scale separation bubble exhibited nearly linear growth in the second type of EC-ISWBLI as the shock impingement point moved downstream from the corner, while the surface topology changed complicatedly. All three oil-flow visualisation cases demonstrated a ‘node-saddle-node’ configuration along with a separation line formed near the corner. The reattachment line transitioned from the ‘node-saddle-node’ to a new configuration consisting of seven critical points including four nodes and three saddle points.
The schlieren images and pressure distribution of the first and second types of EC-ISWBLI were compared with those of P-ISWBLI. In both groups, the overall pressure rise in P-ISWBLI was significantly higher than in EC-ISWBLI, regardless of whether the expansion waves appeared or not. An inviscid model incorporating the shock polar was proposed, through which we found that the expansion corner influenced the flow deflection angle during the reattachment process, resulting in a lower reattachment pressure rise than in P-ISWBLI. The accuracy of this model was validated by comparing the theoretical overall pressure rise with experimental data.
The feasibility of FIT in EC-ISWBLI was discussed. Two criteria were established based on the value of  ${F(\bar {x})}_{plateau}=6.00$. The parameters of flow passing through expansion waves were carefully selected to derive the first criterion, which explained why the separation bubble not only occupied the vicinity of the impingement position of the shock but also extended into a larger spatial scale. Similarly, by considering the physical variables of undisturbed incoming flow, we obtained the second criterion that defines a threshold for the ‘lock-in’ effect. When the inclination angle of the separation bubble is smaller than $\alpha _{2FIT}$, regardless of shock intensity or the impingement position, separation onset remains locked near the expansion corner. However, once the inclination angle exceeded the threshold value, the separation onset occurred far upstream of the corner. In fact, the outward expansion of the corner body shape provided a greater tolerance for large-scale separation compared with P-ISWBLI. The estimation of the separation scale can be achieved by comparing the test data with the threshold value, which in turn guides the design of a supersonic inlet.
Acknowledgements
The authors would like to express sincere gratitude to the editor and reviewers whose generous advice was valuable and helpful in revising and improving the paper. We also appreciate advice from Ms Xu on the details of English writing.
Funding
This work is funded by the National Natural Science Foundation of PR China through grant nos 12172175 and 12272177, Young Scientific and technological Talents Project of Jiangsu Association for Science and Technology grant no. TJ-2021-052 and Young Talents Scholar Lift Project 2021-JCJQ-QT-064.
Declaration of interests
The authors report no conflict of interest.
Appendix
In this appendix additional information is provided on the shock polars. Polar  $\varGamma _0$ is associated with upstream uniform state 0 and represents any shock forming in state 0, specifically incident shock $C_1$. For the second and third types of interactions, the incoming flow passes through incident shock wave $C_1$ induced by a shock generator and the separation-induced shock wave $C_2$. The states of downstream flows 1 and 2 are points 1 and 2 on $\varGamma _0$. For identical inflow conditions and wedge angles, $\varGamma _0$ remains constant in conjunction with point 1. The pressure at state 2 is determined from pressure measurements of the separation pressure rise. The corresponding airflow deflection angle $\alpha _2$ can be obtained from the shock polar. Shock waves $C_3$ and $C_4$ are represented by polars $\varGamma _1$ and $\varGamma _2$ for upstream states 1 and 2, respectively. For flows 3 and 4 to be compatible, flows 1 and 2 must be deflected such that they adopt a common direction and $p_4=p_5$. Therefore, states 3 and 4 coincide with the intersection $I$ of $\varGamma _1$ and $\varGamma _2$. Due to the presence of the isobaric-dead air region, $p_4$ decreases as a result of successive expansion waves emanating from point $I$, resulting in a transition to state $E_1$. In state $E_1$, $p_{E1}=p_2$ and the flow further deflects towards the wall surface. At the inviscid reattachment point $R$, the airflow encounters the wall surface and forms a reattachment shock wave $C_5$, which corresponds to the polar curve $\varGamma _3$. The flow direction becomes parallel to the wall after passing through $C_5$.
Figures 23 and 24 depict the shock polar for  $\alpha _1=12^\circ$ and $\alpha _1=15^\circ$, respectively. The flow deflection towards the horizontal wall is negative.

Figure 23. Shock polar for  $\alpha _1=12^\circ$.

Figure 24. Shock polar for  $\alpha _1=15^\circ$.


