


1. Introduction
A variety of transport phenomena can be characterised by solving the advection–diffusion equation (ADE) using numerical methods such as the finite-element method, but these methods are computationally costly and do not necessarily provide insight into the underlying physics. To model transport in a particular problem domain, often there is a need for analytic forms that can be calculated rapidly and that can help elucidate the relationship between the advection and diffusion processes and associated parameters, see e.g. Gelderblom et al. (Reference Gelderblom, van der Horst, Haartsen, Rutten, van de Ven and van de Vosse2011). Prior work in this area is concerned with deriving general solutions to the ADE include the work of Kim (Reference Kim2020) and Pérez Guerrero et al. (Reference Pérez Guerrero, Pimentel, Skaggs and van Genuchten2009). For a cylindrical shaped domain it is beneficial to consider the ADE in cylindrical coordinates and this specific problem requires special treatment in order to derive an analytical solution. Previous studies concerning the axisymmetric cylindrical domain include the work of Chen et al. (Reference Chen, Chen, Liu, Liang and Lin2011), in which constant velocities are assumed and a method for treating radial diffusion, by using the Hankel transform is proposed. However, this method cannot be applied when a radially varying velocity field is considered. Aris (Reference Aris1956) considers the one-dimensional (1-D) ADE with added Taylor dispersion, assuming that enough time has elapsed such that radial diffusion can be neglected. The Taylor dispersion is included in the form of additional axial diffusion in the 1-D ADE for which an analytical solution can be obtained. This treatment of radial diffusion will probably be invalid when a time varying input concentration is present at the inlet, and radial equilibrium in the concentration will not be reached when the change in concentration over time is significant.
In this paper we address the problem of characterising the dynamics of contrast agent transport in contrast-enhanced medical imaging, specifically, coronary computed tomography angiography (CCTA), which is a diagnostic procedure for imaging the coronary arteries that provide the blood supply to the muscle of the heart. Advances in CCTA imaging technology have enabled the acquisition of high-resolution images of the coronary arteries that can be used to quantitatively assess the severity of coronary artery disease – the primary manifestation of heart disease and the leading cause of death worldwide. The CCTA is performed in conjunction with an intravenously injected contrast agent, and the observed intensities in the CCTA image scale linearly with concentration of the contrast agent. Previous clinical studies have explored the utility of quantifying intensity gradients along the vessel path as a potentially useful indicator of physiological function that may be used to help diagnose disease severity (Choi et al. Reference Choi, Koo, Yoon, Min, Song, Hahn, Choi, Gwon and Choe2012; Stuijfzand et al. Reference Stuijfzand2014; Steigner et al. Reference Steigner2015; Fujimoto et al. Reference Fujimoto2018). A recently proposed method for indirectly quantifying coronary blood flow from the observed contrast variations along vessels in a CCTA image is known as translumninal attenuation flow encoding (TAFE) (Lardo et al. Reference Lardo, Rahsepar, Seo, Eslami, Korley, Kishi, Abd, Mittal and George2015). The TAFE is based on the solution of the 1-D advection equation, in which neglecting radial diffusion was justified by the observation that the radial variation in contrast appears minimal (Eslami Reference Eslami2016). This, however, is a flawed observation because the spatial resolution of a CCTA image is not sufficient to adequately reveal variations in concentration near the vessel wall. A clinical validation of TAFE was later performed by Bae et al. (Reference Bae, Hwang, Han, Kim, Kim, Park, Lee, Moon and Choi2018), where perfusion computed tomography (CT) was used to provide ground-truth per-vessel flow values. In that study, the authors proposed a modification to the original TAFE method by introducing an empirically calibrated correction constant  $k$ for scaling the TAFE flow estimation. This correction constant was necessary to improve the correlation of the estimated flow with perfusion CT-based flow, which suggests that the original TAFE method does not always accurately estimate per-vessel flow. In order to obtain more accurate estimates, a higher-fidelity forward model is needed. Indeed, it is possible to use three-dimensional finite-element methods to estimate the per-vessel flow by properly adjusting relevant parameters in order to match the observed contrast gradients. For simulating the contrast-agent transport in the coronary circulation a highly refined mesh and multiple finite-element solutions are needed for the blood-flow estimation, resulting in a computationally expensive method. Examples of these finite-element-based estimation methods can be found in Funke et al. (Reference Funke, Nordaas, Evju, Alnæs and Mardal2019) and Lassila et al. (Reference Lassila, Manzoni, Quarteroni and Rozza2013). More recently, neural-network methods such as physics-informed neural nets (Raissi, Yazdani & Karniadakis Reference Raissi, Yazdani and Karniadakis2020), which produce estimates of solution fields that are constrained to follow physical relationships, have been proposed to study fluid and transport phenomena. These methods perform best when provided with highly resolved temporal and spatial data. However, CCTA data typically only contains a few high-spatial-resolution snapshots in time and these spatial data can contain significant levels of noise and artefacts. There is a need for a general solution to the ADE that can be obtained efficiently and that allows for the exploration of the advection and diffusion processes governing the dynamics of the contrast agent and their relationships to the underlying coronary blood flow.
In this paper, we propose an accurate semi-analytical solution to the ADE for straight cylindrical vessels and axisymmetric radially varying velocities and concentration profiles. We use this approach to specifically highlight the potential deficiencies arising from certain simplifying assumptions used by the TAFE method, namely, neglecting the impact of radial velocity and diffusion, which we capture in our solution to varying degrees of fidelity. We verify the semi-analytical solution against a numerical solution obtained using a spectral-element method. Finally, based on the semi-analytical solution, a new method for flow estimation from contrast gradients, advection–diffusion flow estimation (ADFE), is derived and compared with the current TAFE methodology.
2. Methods
2.1. Problem formulation
The transport of a solute can be modelled using the ADE, and for the contrast material used in CCTA we assume that transport is passive. This is justified when the volume fraction of the solute, or concentration, is low enough. Passive implies that the solute does not impact the material properties of the carrying fluid (here, blood), that the velocities of the solute and the carrier are equal and that no mixing of the two fluids occur. The concentration of the solute  $C=C(\boldsymbol {x},t)$ is described by
 \begin{equation} \frac{\partial C}{\partial t} + \boldsymbol{v} \boldsymbol{\cdot} \boldsymbol{\nabla} C = D \nabla^{2} C, \end{equation}
where  $\boldsymbol {v}$ is the velocity and $D$ the diffusion constant. We introduce cylindrical coordinates $(r, \phi , z)$ with $r$ the radial, $\phi$ the circumferential and $z$ the axial coordinate and further assume that both the velocity and concentration fields are axisymmetric. The ADE (2.1) can then be written as
 \begin{equation} \frac{\partial C}{\partial t} + v_z\frac{\partial C}{\partial z} + v_r\frac{\partial C}{\partial r} = D\left(\frac{\partial^{2} C}{\partial z^{2}} + \frac{1}{r}\frac{\partial C}{\partial r} + \frac{\partial^{2} C}{\partial r^{2}}\right), \end{equation}
with the subscript indicating the corresponding component of  $\boldsymbol {v}$. Finally, we assume a steady developed velocity field where $v_r = 0$ and $v_z(z, r, t) = v(r)$. This results in the following equation:
 \begin{equation} \frac{\partial C}{\partial t} + v(r)\frac{\partial C}{\partial z} = D \left(\frac{\partial^{2} C}{\partial z^{2}} + \frac{1}{r}\frac{\partial C}{\partial r} + \frac{\partial^{2} C}{\partial r^{2}}\right). \end{equation}
To make the formulation dimensionless we apply a scaling analysis using
 \begin{equation} t = T \hat{t}, \quad r = a \hat{r}, \quad z = L \hat{z}, \quad v(r) = V \hat{v}(\hat{r}), \quad C(t, z, r) = C_0\hat{C}(\hat{t}, \hat{z}, \hat{r}), \end{equation}
where  $T$ is the time delay between contrast arriving and reaching maximum concentration, $V$ is the cross-sectional averaged velocity, $a$ is the radius, $L$ is a characteristic length in the axial direction and $C_0$ is a characteristic concentration. With the hat to indicate a dimensionless parameter, we derive
 \begin{equation} \textit{St}\frac{\partial \hat{C}}{\partial \hat{t}} + \hat{v}(\hat{r})\frac{\partial \hat{C}}{\partial \hat{z}} = \frac{1}{\textit{Pe}}\left( \frac{1}{\hat{r}}\frac{\partial \hat{C}}{\partial \hat{r}} + \frac{\partial^{2} \hat{C}}{\partial \hat{r}^{2}} + \left(\frac{a}{L}\right)^{2} \frac{\partial^{2} \hat{C}}{\partial \hat{z}^{2}} \right), \end{equation}
where  $\textit {St}$ is the Strouhal number $\textit {St} = L/V T$ and $\textit {Pe}$ the radial Pèclet number $\textit {Pe} = V a^{2}/D L$. For completeness, an estimate for each of the characteristic physiological values during CCTA is listed in table 1. For slender cylindrical domains, such as the coronary arteries we consider here, $a \ll L$, and thus we can neglect the axial diffusion in (2.5), yielding
 \begin{equation} \textit{St}\frac{\partial \hat{C}}{\partial \hat{t}} + \hat{v}(\hat{r})\frac{\partial \hat{C}}{\partial \hat{z}} = \frac{1}{\textit{Pe}}\left( \frac{1}{\hat{r}}\frac{\partial \hat{C}}{\partial \hat{r}} + \frac{\partial^{2} \mathcal{C}}{\partial \hat{r}^{2}} \right). \end{equation}
To complete the problem formulation for  $\hat {C}(\hat {r},\hat {z},\hat {t})$, the equation must be supplemented by the initial and boundary conditions. Initially, i.e. for $t \leqslant 0$, no solute is present in the fluid. At the inlet, $z=0$, the input solute concentration is prescribed by the product of a time-varying function $f(t)$ and a radial variation $g(r)$. At the wall, the radial flux of $C$ is zero. This leads to the conditions
 \begin{equation} \hat{C}(\hat{r},\hat{z},0)=0,\quad \hat{C}(\hat{r},0,\hat{t})=f(\hat{t})g(\hat{r}),\quad\frac{\partial \hat{C}}{\partial \hat{r}}(1,\hat{z},\hat{t})=0. \end{equation}
The axial velocity is assumed to be fully developed, implying that  $v(r)$ has a parabolic profile. Choosing $V=Q/{\rm \pi} a^{2}$, the averaged velocity, with $Q$ the total flow rate, we obtain for the dimensionless velocity
 \begin{equation} \hat{v}(\hat{r}) = 2 (1- \hat{r}^{2}). \end{equation}
Unless otherwise noted, from here on we will always refer to the dimensionless formulation while omitting the hats.
Table 1. Order estimates of the characteristic physiological values found in CCTA data.

2.2. Galerkin method
We first decompose  $C(r; z; t)$ as a series of Bessel functions according to
 \begin{equation} C(r,z,t) = \sum_{m=1}^{\infty} C_m(z, t) \textrm{J}_0(\xi_m r),\quad \text{with } \textrm{J}_1(\xi_m) = 0, \end{equation}
where  $\textrm {J}_0$ and $\textrm {J}_1$ are the zeroth and first-order Bessel function of the first kind with a parameter $\xi _m$ to enforce the no-flux boundary condition. Substituting this equation into (2.6), we obtain
 \begin{equation} \textit{St}\frac{\partial C_m}{\partial t}\textrm{J}_0(\xi_m r) + v(r)\frac{\partial C_m}{\partial z}\textrm{J}_0(\xi_m r) + \frac{\xi_m^{2}}{\textit{Pe}}C_m \textrm{J}_0(\xi_m r) = 0, \end{equation}
and for the boundary conditions
 \begin{equation} C_m(z, 0) = 0,\quad C_m(0, t) = f(t)g_m, \end{equation}
with  $g_m$ resulting from separating $g(r)$ in the same way as $C$. We employ the Galerkin method by multiplying (2.10) with $\textrm {J}_0(\xi _n r) r$ and integrating the result with respect to $r$ from $r=0$ to $1$. For practical calculations we truncate the infinite sum (2.9) at a finite number $N$, letting $m$ run from 1 to $N$. Thus, we derive
 \begin{equation} \textit{St}\frac{\partial C_n}{\partial t} + \sum_{m=1}^{N} Z_{nm}\frac{\partial C_m}{\partial z} + \frac{\xi_n^{2}}{\textit{Pe}}C_n= 0,\quad 1 \leqslant n \leqslant N, \end{equation}
with
 \begin{equation} Z_{nm} = \frac{2}{\textrm{J}_0(\xi_n)^{2}}\int_0^{1} v(r) \textrm{J}_0(\xi_m r) \textrm{J}_0(\xi_n r) r \,\textrm{d}r. \end{equation}
Substitution of  $v(r) = 2(1 - r^{2})$ results for $Z_{nm}$ in
 \begin{equation} Z_{nm} = \begin{cases} 1 & \text{for } n=m=1, \\ \dfrac{4}{3} & \text{for } n=m \neq 1, \\ -8 \dfrac{(\xi_m^{2} + \xi_n^{2}) \textrm{J}_0(\xi_m)}{(\xi_m^{2} - \xi_n^{2})^{2} \textrm{J}_0(\xi_n)} & \text{for } n\neq m. \end{cases} \end{equation}
2.3. Laplace transform
We proceed by using the Laplace transform  $\mathcal {L}\{C_m(z, t);t,s\} = C_{mL}(z; s)$ in time to simplify (2.12) to
 \begin{equation} \sum_{m=1}^{N} Z_{nm}\frac{\partial C_{mL}}{\partial z} + \left(\frac{\xi_n^{2}}{\textit{Pe}} + \textit{St}\,s\right) C_{nL} = 0, \quad C_{nL}(0;s)=g_n f_L(s),\quad n \in (1,N), \end{equation}
with  $f_L(s)$ the Laplace transform of $f(t)$. Introducing the $N$-vectors $\boldsymbol {C}_{\boldsymbol {L}} = \{ C_{nL} \}$ and $\boldsymbol {g}=\{g_n\}$ and the $N \times N$-matrices $\boldsymbol{\mathsf{Z}}=\{Z_{nm}\}$ and $\boldsymbol{\mathsf{S}}= \mathrm {Diag}\{ \xi _n^{2}/\textit {Pe} + \textit {St}\,s\}$, a diagonal matrix, we can write (2.15a,b) in matrix notation as
 \begin{equation} \boldsymbol{\mathsf{Z}}\frac{\partial \boldsymbol{C}_{L}}{\partial z} + \boldsymbol{\mathsf{S}} \boldsymbol{C}_{L} = 0. \end{equation}
The solution of the first-order ordinary differential equation (2.16) is constructed with the eigenvectors and eigenvalues of  $\boldsymbol{\mathsf{Z}}^{-1} \boldsymbol{\mathsf{S}}$, resulting in
 \begin{equation} \boldsymbol{C}_L(z, s) = \sum_{k = 1}^{N} f_L(s) c_k \boldsymbol{A}_k(s) \exp({-B_k(s) z}), \end{equation}
where  $\boldsymbol{A}_k$ is the $k$th eigenvector and $B_k$ is the $k$th eigenvalue of $\boldsymbol{\mathsf{Z}}^{-1} \boldsymbol{\mathsf{S}}$. Moreover, the coefficients $c_k$ are constants that can be determined by the boundary conditions
 \begin{equation} \boldsymbol{c} = \boldsymbol{\mathsf{A}}^{{-}1}\boldsymbol{g}, \end{equation}
where  $\boldsymbol{\mathsf{A}}$ is the $N \times N$-matrix with columns $\boldsymbol {A}_k$, i.e. the eigensystem representation of $\boldsymbol{\mathsf{Z}}^{-1} \boldsymbol{\mathsf{S}}$. Following Abate & Whitt (Reference Abate and Whitt2006), for the inverse Laplace transform we approximate $\boldsymbol {C}$ by the finite linear combination of the transform values
 \begin{equation} \boldsymbol{C}(z, t) \approx \sum_{k = 1}^{K} \frac{\omega_k}{t}\boldsymbol{C}_L\left(z, \frac{\alpha_k}{t}\right), \end{equation}
with  $K$ the number of Laplace evaluations, while $\omega$ and $\alpha$ are defined by the fixed Euler summation method for non-negative real values from Abate & Whitt (Reference Abate and Whitt2006). This approach speeds up the inversion compared to calculating the integral with a trapezoidal rule because fewer computations of $\boldsymbol {C}_L$ are needed. Note that, as stated by Abate et al., high numerical precision is needed for the inverse Laplace transform.
2.4. ADFE method
For the ADFE method we utilise the solution described in §§ 2.1–2.3 to solve the inverse problem of recovering the flow rate  $Q$ given an observed concentration field $C_d$ at time of observation $t_d$. For this, ADFE only requires cross-sectional averaged concentration data $\bar {C}_d(z, t_d)$ along the vessel. Time-dependent concentration data at the inlet of the vessel needs to be available to construct $f(t)$. A schematic example of such data is shown in figure 1. The motivation for using the cross-sectional averaged concentration is attributable to the spatial resolution of CCTA; it is typically inadequate to measure the radial concentration distributions, especially near the coronary artery walls. For straight vessels, we can calculate the semi-analytical $\bar {C}_a$ as
 \begin{equation} \bar{C}_a(z,t) = 2 \int_0^{1} C(r,z,t) r \,\textrm{d}r = C_1(z,t), \end{equation}
using the computed  $f(t)$ and $t=t_d$. We define the least-squares error $E_m$ between $\bar {C}_d$ and $\bar {C}_a$ as follows:
 \begin{equation} E_m = ||\bar{C}_d(z, t_d) - \bar{C}_a(z, t_d)||_2, \end{equation}
and compute  $Q$ that minimises $E_m$ via an iterative minimisation method. In this work the limited-memory Broyden–Fletcher–Goldfarb–Shanno bounded algorithm available in the SciPy ‘minimise’ function, is used for the minimisation of $E_m$ (Jones, Oliphant & Peterson Reference Jones, Oliphant and Peterson2001).

Figure 1. Schematic example of the input concentration function  $f(t)$ (a) and snapshot of the cross-sectional averaged concentration at $t=1$, i.e. $\bar {C}_a(z,1)$, (b). The blue dots indicate specific concentration values evenly spaced over time and serve to show the nonlinear relationship between $f(t)$ and $\bar {C}_a(z,1)$.
2.5. Spectral-element solver
The reference solutions  $C_d$ used in this work are computed using two-dimensional meshes on which (2.5), with the boundary conditions from (2.7a–c) and velocity field from (2.8) is solved numerically by the spectral-element method with high-order Legendre polynomials as the shape functions. The integration and interpolation points are chosen to be the same and are the Gauss–Lobatto–Legendre points in the $z$-direction and Gauss–Radau–Legendre points in the $r$-direction in order to avoid singularities at $r=0$ (Bernardi et al. Reference Bernardi, Dauge, Maday and Azaïez1999; Shen, Tang & Wang Reference Shen, Tang and Wang2011). Only one high-order element is used in the radial direction to ensure connectivity. For time integration the generalised- $\alpha$ method is used from Jansen, Whiting & Hulbert (Reference Jansen, Whiting and Hulbert2000). The implementation is tested through benchmark problems to ensure proper computation of solutions.
3. Results
To compare the semi-analytical solution with the reference solution computed with the spectral-element solver described in § 2.5, we created a data set of 48 simulations with  $\textit {Pe}$ ranging from 1.67 to $1.6\times 10^{5}$ and $St$ values of $[0.025, 0.0375, 0.075, 0.15]$. These ranges are deliberately large in order to verify the solution over a large parameter space. For the boundary conditions we used a flat concentration profile $g(r)=1$ and input function $f(t) = 0.5(1-\cos ({\rm \pi} t))$, which is the input function used in the original TAFE study by Lardo et al. (Reference Lardo, Rahsepar, Seo, Eslami, Korley, Kishi, Abd, Mittal and George2015). For the computational results, a time step of $0.0001$ was used and the mesh consists of 200 elements with a radial polynomial order of 30 and axial order of 2. A mesh independence test was performed to confirm that these parameters were adequate for computing $C_d$.
3.1. Verification of the semi-analytical solution
We calculated the numerically simulated concentration  $C_d$ and the semi-analytical concentration $C_a$ on the same grid points as the spectral-element mesh as for the TAFE data set. To obtain $C_a$ we used $M=8$ for the computation of the inverse Laplace transform. An example solution is shown in figure 2, where it can be seen that near the wall a high concentration gradient appears that changes with $t$ and $z$. The relative error is defined as $E = ||C_d - C_a||_2/||C_d||_2$. Figure 3 shows $E$ as function of $\textit {Pe}$ for selected values of $N$ and $\textit {St}$. Here it is seen that for increasing $\textit {Pe}$, more terms, $N$, in the Bessel series are needed to maintain an acceptable value of $E$, and in general as $N$ increased, $E$ decreased. The effect of $\textit {St}$ turns out to be rather small.

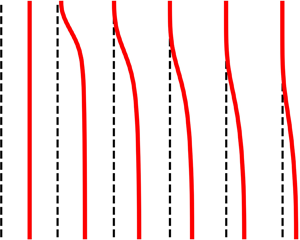
Figure 2. Comparisons between the numerical solution  $C_d$ (markers) and the semi-analytical solution $C_a$ (lines) for the concentration field with $\textit {Pe} = 2667$ and $St = 0.15$ at three time points, $t = 0.6$ (orange crosses), $t=0.8$ (blue squares) and $t=1.0$ (red circles), using the concentration input function from the original TAFE study. Part (2a) shows concentration profiles for the numerical solution and the semi-analytical solution as functions of axial position at radii $r=0.0015$ (left) and $r=1$ (right) and part (2b) shows the radial concentration profiles at $z=0.2$ (left) and $z=0.6$ (right).

Figure 3. The log–log plots of the relative error  $E = ||C_d - C_a||_2/||C_d||_2$ at $t=1$ as a function of $\textit {Pe}$ with $N=5$ (red circles), $N=20$ (blue squares), $N=50$ (orange crosses), $N=70$ (black diamonds), $g(r) = 1$ and $f(t) = 0.5(1-\cos ({\rm \pi} t))$. Relative errors corresponding to four different $St$ values are shown in the individual subplots.
3.2. ADFE results
To benchmark the ADFE method described in § 2.4, we computed the velocity  $V_a$ by both the TAFE and ADFE method and compared them against the ground-truth velocity $V_d$ used in the spectral-element simulations. The velocity $V_a$ computed by ADFE and TAFE as function of $\textit {Pe}$ is shown in figure 4. From this figure we conclude that ADFE more accurately predicts the velocity $V_d$ compared with TAFE, and the accuracy of the prediction increases with increasing $N$. On the other hand, TAFE can greatly underestimate $V_d$. Because the lack of radial diffusion has a larger impact on the concentration field $C$ for increasing $\textit {Pe}$, TAFE's accuracy declines for increasing $\textit {Pe}$.

Figure 4. Computations of  $V_a$ by ADFE with $N=5$ (red circles), $N=20$ (orange crosses) and $N=50$ (black diamonds) and TAFE (blue squares) as a function of $\textit {Pe}$.
4. Discussion
We derived and verified a semi-analytical solution for the axisymmetric ADE. This solution was compared with numerical solutions from a spectral-element method. The evaluation data set consisted of a wide range of values for  $\textit {Pe}$ and $\textit {St}$. We conclude that, provided that $N$, the number of terms in the series expansion, is sufficiently large, the semi-analytical solution accurately matches the numerical solutions. We showed that with increasing $\textit {Pe}$, a larger $N$ is needed to maintain a low error against the numerical solution, which suggests that resolving the radial variation in $C$ becomes more important when $\textit {Pe}$ is large. The difference in the error against the numerical solution, when holding $N$ constant was less when varying $\textit {St}$ compared to varying $\textit {Pe}$. This suggests that for a coronary tree where the flow is divided after each bifurcation, an adequate value of $N$ could be estimated based only on the geometry and the properties of the contrast agent.
The semi-analytical solution forms the basis of the ADFE method, which allows for the estimation of the underlying flow rate,  $Q$, based on the observed concentration field, $\bar {C}_d$ at a fixed time $t_d$. The estimated $Q$ from ADFE was compared with that from the TAFE method, where the latter does not consider any form of diffusion. This comparison showed that ADFE estimates $Q$ more accurately than TAFE for a wide range of $\textit {Pe}$, highlighting the importance of representing the effects of radial variations in the concentration and radial diffusion.
In order to apply this solution in a setting with real CCTA images, we note that the current method does not account for some important phenomena. In reality, the velocity field  $\boldsymbol {v}$ is pulsatile and is developing near the entrance of the coronary circulation. The current method can be modified for different steady or pulsatile developed $\boldsymbol {v}$ by updating $\boldsymbol{\mathsf{Z}}$. However, for a non-developed flow, $v_r$ would not be zero and both $v_r$ and $v_z$ would depend on $z$ and $t$. Thus it would be necessary to quantify the error because of assuming a developed $\boldsymbol {v}$ in the semi-analytical solution. Furthermore, the coronary vessels are typically not perfectly straight cylindrical vessels and are often slightly tapered, curved and with non-circular cross-sections. Additionally, the vessels have distensible walls and deform and translate owing to the beating myocardium. While it is difficult to account for the combined impact of these effects, it is possible to estimate the impact of radius variations in the vessel on the prediction accuracy of ADFE compared with the straight cylinder setting. It can be derived that perturbation to the ADFE prediction from radius variation scales with $\xi _n$, having a larger impact on $C_n$ for increasing $n$. From the structure of $\boldsymbol{\mathsf{Z}}$ it can be deduced that the dependency of $C_1$ on $C_n$ decreases for increasing $n$, indicating that with large $\textit {Pe}$, the contribution of the $\xi _n^{2} / \textit {Pe}$ term to $C_1$ is limited. This implies that even without precise knowledge of $\textit {Pe}$ and the variations in the vessel radius, we may still accurately predict $\bar {C}_d$ by estimating $St$. Moreover, real coronary arteries contain bifurcations and stenoses, which may introduce sudden changes in the concentration field either by suddenly splitting the concentration field beyond a bifurcation, or by radially increasing or decreasing the concentrations when passing a stenosis. Instead of applying the semi-analytical solution over the entire vessel, one can use the solution in segments between bifurcations or stenoses. However, at the start of each segment a significant jump in concentration or change in axial gradient compared with that in the proximal vessel can occur. This effect should be incorporated in the radial variation $g(r)$ prescribed at the inlet to ensure an accurate ADFE method. Future work should investigate how this can be performed correctly. All the segments should be combined such that conservation of mass of both the flow and concentration field is ensured.
Future work aims at quantifying the impact of the described limitations on the performance of the ADFE method. It needs to be ensured that the extracted cross-sectional averaged CCTA intensities correlate well with the contrast agent concentration. Here, a linear relationship between the intensity and concentration of the contrast agent is used. However, the CCTA image modality causes blurring, noise and additional artefacts, which can lead to nonlinearities. Bae et al. (Reference Bae, Hwang, Han, Kim, Kim, Park, Lee, Moon and Choi2018) stated that the underestimation of TAFE was attributable to these imaging artefacts. However, the amount of underestimation is of the same order of what was found in our results. We therefore expect that the additional accuracy of ADFE will still be seen in clinical CCTA data when compared with TAFE.
5. Conclusion
In this paper a semi-analytical solution describing the transport of solute through a cylindrical shaped domain was successfully derived and validated. Based on this solution, a novel method, ADFE, was developed. It presents an inverse solution for the flow rate based on snapshots of the concentration field in a cylindrical domain. A nearly perfect correspondence between this semi-analytic solution and a numerical spectral-element method solution was found. Moreover, the ADFE solution was benchmarked against the existing TAFE method. The comparison demonstrated that ADFE has improved accuracy compared with the TAFE method for extracting flow rates from contrast gradients.
Declaration of interests
The authors report no conflict of interest.


 Open access