A number of studies have looked at the effects of political ties on the performance of companies since the seminal work of Sapienza (Reference Sapienza2003). Firms with political connections are observed to enjoy preferential treatment in obtaining bank loans (Sapienza Reference Sapienza2003; Khwaja and Mian Reference Khwaja and Mian2005; Claessens, Feijen, and Laeven Reference Claessens, Feijen and Laeven2008; Li et al. Reference Li, Meng, Wang and Zhou2008; Firth et al. Reference Firth, Lin, Liu and Wong2009; Boubakri, Cosset, and Saffar Reference Boubakri, Cosset and Saffar2012), with respect to tax benefits (Adhikari, Derashid, and Zhang Reference Adhikari, Derashid and Zhang2006; Faccio, Masulis, and McConnell Reference Faccio, Masulis and McConnell2006; Wu et al. Reference Wu, Wu, Zhou and Wu2012), and in gaining financial assistance from the government (Johnson and Mitton Reference Johnson and Mitton2003; Faccio, Masulis, and McConnell Reference Faccio, Masulis and McConnell2006). This literature concludes that connected firms also have superior financial performance (Fan, Wong, and Zhang Reference Fan, Wong and Zhang2007; Boubakri, Cosset, and Saffar Reference Boubakri, Cosset and Saffar2012; Faccio Reference Faccio2010; Wu, Wu, and Rui Reference Wu, Wu and Rui2012).
With respect to China, it is known that state-owned enterprises (SOEs) enjoy an advantaged status in obtaining bank loans, subsidies, tax breaks, and many crucial inputs (Chow, Song, and Wong Reference Chow, Song and Wong2010; Poncet, Steingress, and Vandenbussche Reference Poncet, Steingress and Vandenbussche2010; Wu et al. Reference Wu, Wu, Zhou and Wu2012). Firms with political connections do not face underinvestment problems (Xu, Xu, and Yuan Reference Xu, Xu and Yuan2013), receive favorable government treatment (Sheng, Zhou, and Li Reference Sheng, Zhou and Li2011; Khwaja and Mian Reference Khwaja and Mian2005; Li et al. Reference Li, Meng, Wang and Zhou2008), are more likely to receive government contracts and bailout funds (Faccio, Masulis, and McConnell Reference Faccio, Masulis and McConnell2006), have stronger cash positions, secure larger long-term loans and have lower financing costs (Su and Fung Reference Su and Fung2013), and are more likely to survive (Du and Girma Reference Du and Girma2010). Such firms also have more confidence in the legal system (Li et al. Reference Li, Meng, Wang and Zhou2008).
The theoretical reason for these findings is simply stated. The incentive for corporations to establish political connections in transition economies ultimately arises from continuing state control of key resources. In a relationship-based economy such as China's, building connections with the government or even engaging in politics can facilitate private communications with officials, thereby mitigating severe information asymmetries and risks of discrimination (Li et al. Reference Li, Meng, Wang and Zhou2008; Wu, Wu and Rui Reference Wu, Wu and Rui2012; Xu, Xu, and Yuan Reference Xu, Xu and Yuan2013).
Previous studies have generally shown how political connections affect average corporate performance across large samples of firms, typically using OLS specifications. But these findings only summarize the average relationship between a set of regressors and the outcome variable based on the conditional mean function. There are reasons to think that the effects of political connections are heterogeneous. Weakly performing corporations are more likely to obtain more significant effects from the informal links with the government. Put differently, the marginal effect of building connections with the government should be larger for poorly performing corporations.
Such results can be viewed as an extension of the resource-based theory of the firm, because such firms have insufficient resources and information as compared with their better performing peers. Take bank loans as an example. Better-performing firms have a good reputation with respect to repayment of loans from banks. Poorly performing firms do not have such reputations, so obtaining loans is harder and the terms are less favorable. Political connections can overcome these disabilities and should thus have larger marginal effects on performance.
To test for the possibility of these differential effects, we adopt the quantile regression (QR) approach. The QR approach has been used extensively in various studies (Margaritis and Psillaki Reference Margaritis and Psillaki2010; Li, Sun, and Zou Reference Li, Sun and Zou2009; Ebersberger, Marsili, and Reichstein Reference Ebersberger, Marsili and Reichstein2010; Falk Reference Falk2012). In comparison with OLS, QR has two advantages for our purposes. First, QR provides a richer characterization of the data, and allows for the consideration of the effect of a covariate on the entire distribution of induced variable and not merely its conditional mean. Second, QR is more robust to non-normal errors and outliers than OLS.
Our QR regression results do find that firms can benefit from political connections whether they perform well or poorly. However, the magnitude of coefficients varies widely across the distribution, particularly when we focus on companies in the bottom quantile of firm performance. The positive effect of political connections for the bottom quantile is approximately twice as high as that in the top one, thereby indicating that the effect of political tie is diminishing with respect to firm performance.
DATA
To measure political connections, we obtained a profile of the CEO's and of other directors from the “Profile of Directors and Senior Managers” section of the company's prospectus in the China Stock Market and Accounting (CSMAR) database. We also manually collected the information of the TMT/board members’ curriculum vitae, and defined political ties in terms of former or current People's Congress (PC) and Chinese People's Political Consultative Conference (CPPCC) membership. This is a count variable where we count if a TMT/board member belongs to the PC or CPPCC at any level of the Chinese government. In contrast with previous studies (Fan, Wong, and Zhang Reference Fan, Wong and Zhang2007), our indicator of political ties is more comprehensive because it not only counts information for all directors or senior managers but also for the CEO and chairman (Wu, Wu, and Rui Reference Wu, Wu and Rui2012; Xu, Xu, and Yuan Reference Xu, Xu and Yuan2013). Therefore, the indicator we adopt is a continuous measurement other than a dummy variable. However, we also run tests with a simple dummy measurement (dum_gov) equal to 1 when the firm has political connections; otherwise, it is 0, to maintain consistency with previous literature. From the perspective of robustness, we also consider a proportional measurement (propgov), which is the proportion of political ties measured as PC and CPPCC members—again former and current—divided by the total number of board and TMT members. An advantage of this last measure is that it controls for the problem of firm scale.
In Table 1, we separate the entire sample into five quantile intervals according to the different levels of firm performance, where the levels of political ties remain relatively constant regardless of the measurement used.
Table 1 Data Description (By Different Levels of Firm Performance)

Note: This table presents different measurements of political tie on the sample of listed A share firms in China during the years 2004 to 2012. We split the whole sample into five quantile intervals according to the level of firm performance. Column 3 to 5 report the summary statistics (number of observations, min, mean and max) for each count (Gov), dummy (dum_gov) and proportional (propgov) measurements of proportional tie respectively.
Our financial data are taken from CSMAR database, and include firm performance, firm size, firm age, financial leverage, and ownership concentration index.Footnote 1 Firm performance is measured as return on assets (ROA). Our sample spans the years 2004 to 2012, and includes 2,381 firms and 14,917 firm-year observations of non-financial A-share listed Chinese firms from 2004 to 2012. A detailed description of all variables can be found in the Appendix 1.
EMPIRICAL ANALYSIS
To maintain consistency with the previous literature (Wu, Wu, and Rui Reference Wu, Wu and Rui2012; Wu et al. Reference Wu, Wu, Zhou and Wu2012), we first re-estimate the political tie–performance interdependence within the following model:
 $$ROA_i = \alpha _0 + \alpha _1 \cdot Gov_i + \alpha _2 \cdot Controls_i + \epsilon _i,$$
where GOV i and ROA i denote political ties and firm performance for each firm i, respectively. Controls i is a 1 × k vector that represents control variables, including the natural logarithm of total assets, the nature logarithm of firm age, the debt ratio and the percentage of shares held by the largest shareholder.Footnote 2 We also include time, province and industry fixed effects in our model, and robust variances are clustered at the firm level. In Table 2, we can observe that our all our measures of political connections are positive and significant with respect to firm performance, which is consistent with previous literature (Li, Sun, and Zou Reference Li, Sun and Zou2009; Wu, Wu, and Rui Reference Wu, Wu and Rui2012: Wu et al. Reference Wu, Wu, Zhou and Wu2012; Xu, Xu, and Yuan Reference Xu, Xu and Yuan2013).
Table 2 Impact of Political Tie on Firm Performance (Pooled OLS Model)

Note: This table reports the relation between political tie and firm performance. The following model is estimated with a vector of controls, in particular firm size, firm age, financial leverage and shareholder concentration index: ROA i = α 0 + α 1 Govi + α 2 Controls i + ε i . Time dummy, province dummy and industry dummy are also considered to capture time, regional and industrial fixed effects. The definitions of all variables are stated in Appendix 1. Robust t values are reported in parentheses, clustering at firm level. Here ∗, ∗∗, and ∗∗∗ respectively indicate significance at the 10%, 5%, and 1% levels.
We also implemented a panel fixed effect model (Table 3) and obtained conclusions consistent with the pooled OLS model in Table 2. Again, the results of the panel fixed effect model also show that the effect of the political tie-performance relation on the firm performance is obviously positive under any measurement of political tie.
Table 3 Impact of Political Tie on Firm Performance (Panel Fixed Effect Model)

Note: This table reports the relation between political tie and firm performance. We include firm fixed effect to address the issue of firm heterogeneity. The following model is estimated with a vector of controls, in particular firm size, firm age, financial leverage and shareholder concentration index: ROA i = α 0 + α 1 Govi + α 2 Controls i + ε i . The definitions of all variables are stated in Appendix 1. Robust t values are reported in parentheses, clustering at firm level. Here *, **, and *** respectively indicate significance at the 10%, 5%, and 1% levels.
However, as we noted OLS does not consider the possibility of heterogeneous effects across the distribution. For a comprehensive understanding of QR, we consider a linear specification for the conditional quantiles of ROA i
 $$ROA_i = C_i\beta + \epsilon _i,$$
where ROA i represents firm performance, C i are the k × 1 regressors that represent political ties and other constraints, β is the coefficient, and ε i is the error term. The objective of the quantile regression model is to generate different conditional quantile functions.Footnote 3
We now apply the above QR method to examine the conditional quantile estimates for the political tie–performance relation. Table 4 shows that as the firm performance quantile level changes, the political connectedness coefficient for each quantile varies slightly with respect to its statistical significance, but still indicating that political tie affects firm performance throughout the entire distribution. However, the magnitude of coefficients diminishes quickly, especially when the bottom quintile is compared with other ones. For example, the coefficient of interest of the lowest quantile (while Q = 0.1) is approximately twice as large as that of the highest one (while Q = 0.9). These results are robust to the use of different measurements of political ties (see Appendix 2 and 3).
Table 4 Impact of Political Tie (Gov) on Firm Performance—Quantile Perspective

Note: This table reports the relation between political tie and firm performance at various quantile points. The following model is estimated with a vector of controls, in particular firm size, firm age, financial leverage and shareholder concentration index: ROA i = α 0 + α 1 Govi + α 2 Controls i + ε i . Time dummy, province dummy and industry dummy are also considered to capture time, regional and industrial fixed effects. The definitions of all variables are stated in Appendix 1. Robust t values are reported in parentheses, clustering at firm level. Here ∗, ∗∗, and ∗∗∗ indicate significance at the 10%, 5%, and 1% levels, respectively.
Figure 1 exhibits the changing parameter of the political tie-performance relationship for the entire distribution, together with the corresponding OLS estimate. Similar to Table 3, the significance varies slightly but the magnitude drops sharply in successive quintiles. Compared with the OLS estimates, the results indicate that the effect exceeds the average (OLS estimates) for the relatively low quantile interval.
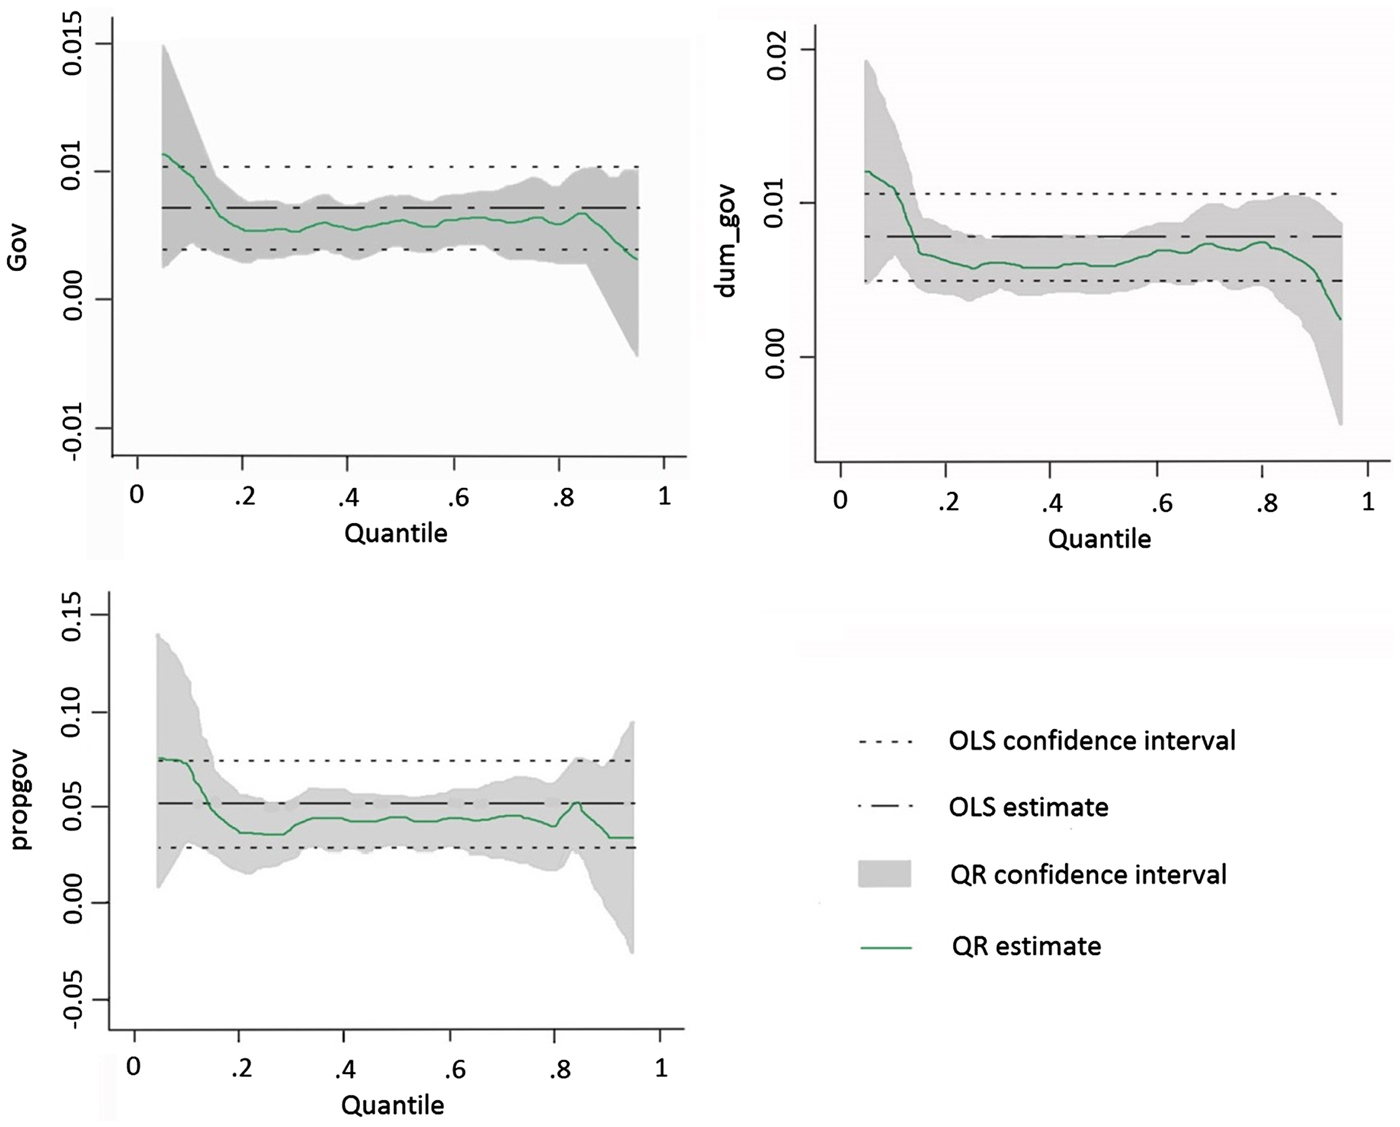
Figure 1 The Quantile Estimates of Political Connectedness Coefficient
CONCLUSION
Whether political ties enhance or impede firm performance has been extensively investigated including in China. But this study is the first to look at this question in a QR framework and find that the effect of political ties—while significant across the distribution—are diminishing with respect to firm performance. Hence, we can conclude that political ties play a particularly important role for poorly performing companies. The implications are two-fold for well-performing firms and their counterparts. Political ties improve the profitability of well-performing firms but they would probably be performing well anyway, given the diminishing marginal effects. At the other end of the distribution, political ties are sustaining firms that might otherwise fail. A more market-oriented interpretation is that the government should look hard at these political connections because they are helping firms that don't need it, while sustaining firms that it would be more efficient to let fail.
Appendix 1. Variable Definition

Appendix 2. Impact of Political Tie (dum_gov, dummy measurement) on Firm Performance – Quantile Perspective

Appendix 3. Impact of Political Tie (propgov, proportional measurement) on Firm Performance – Quantile Perspective